RoadTest: Seeking an Electronics Product Reviewer for the Nordic Power Profiler 2
Author: wolfgangfriedrich
Creation date:
Evaluation Type: Test Equipment
Did you receive all parts the manufacturer stated would be included in the package?: True
What other parts do you consider comparable to this product?: There is no real competition for a source meter of this limited scope. Without the recording/trigger feature a power supply and 2 DMMs would be required. For recording/trigger an oscilloscope with current claps would do the job.
What were the biggest problems encountered?: No problems, Everything went as planned.
Detailed Review:
First I would like to thank Element14 and NORDIC Semi to give me the opportunity to roadtest the Power Profiler Kit2 (Which I will call PPK2 from now on).
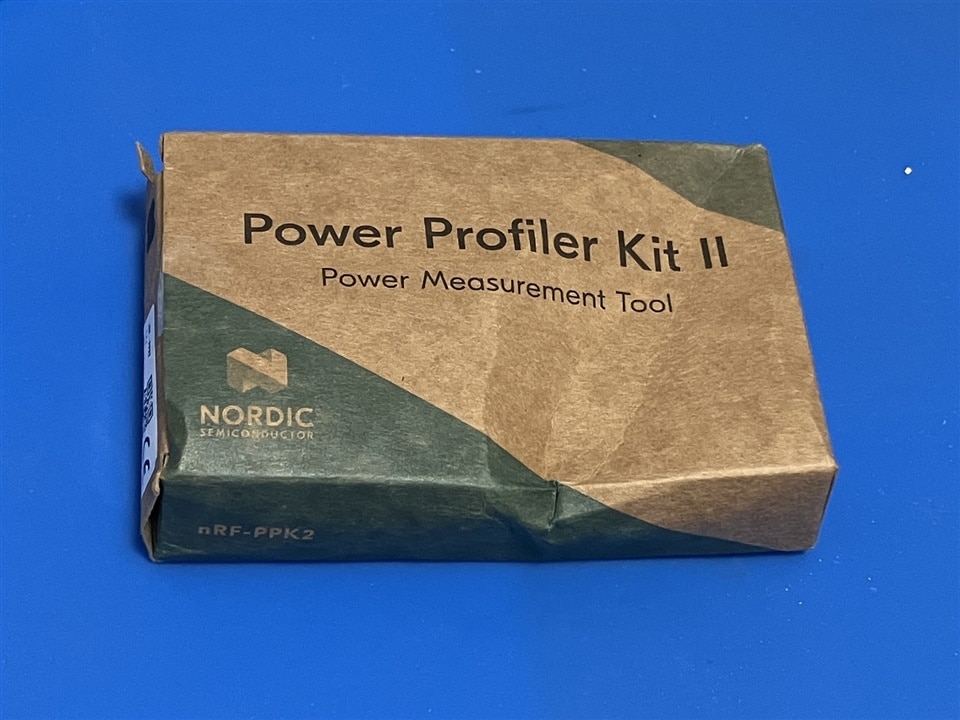
The unit arrived in an astonishing small cardboard box. I guess that happens when you expect a piece of test gear without thinking about a reference of scale. The contents are the PPK2 itself and 2 cable harnesses, one for the connection to the unit under test and one for the digital input interface.

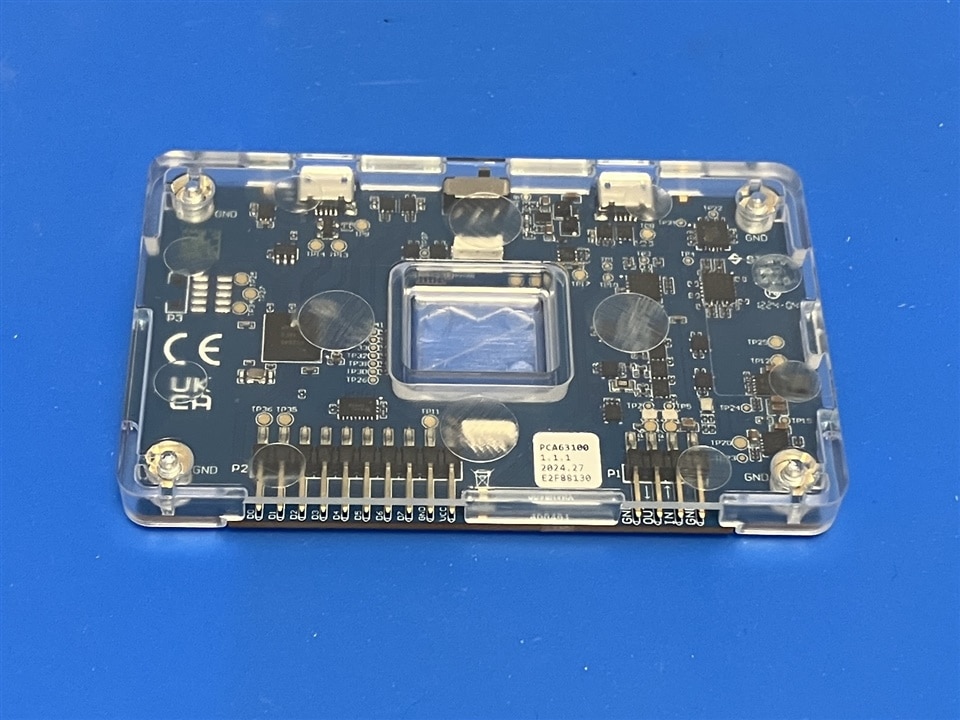
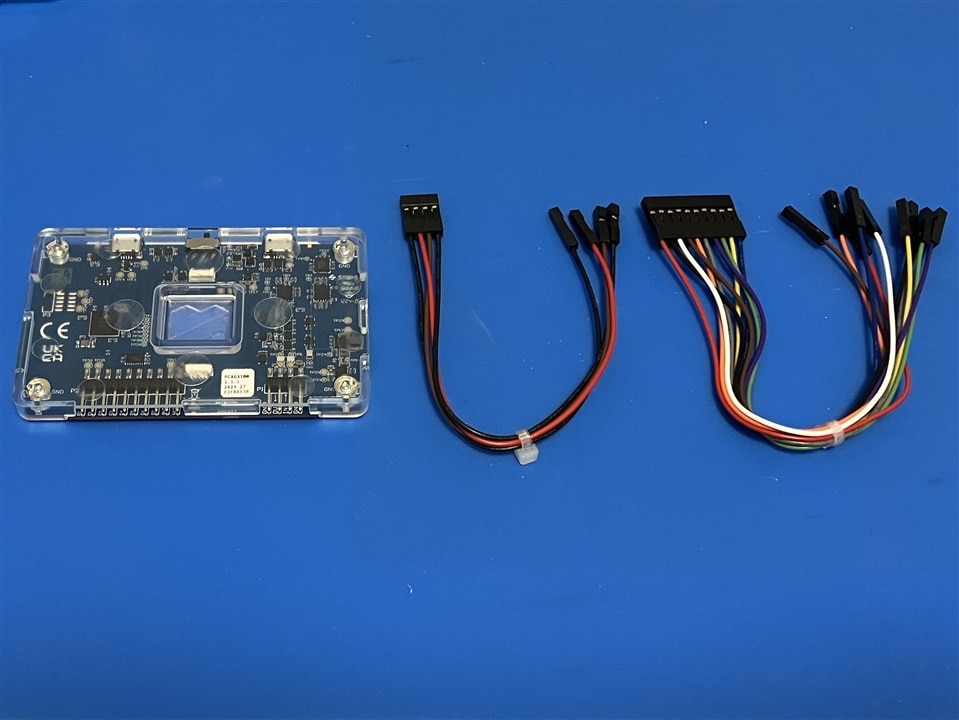
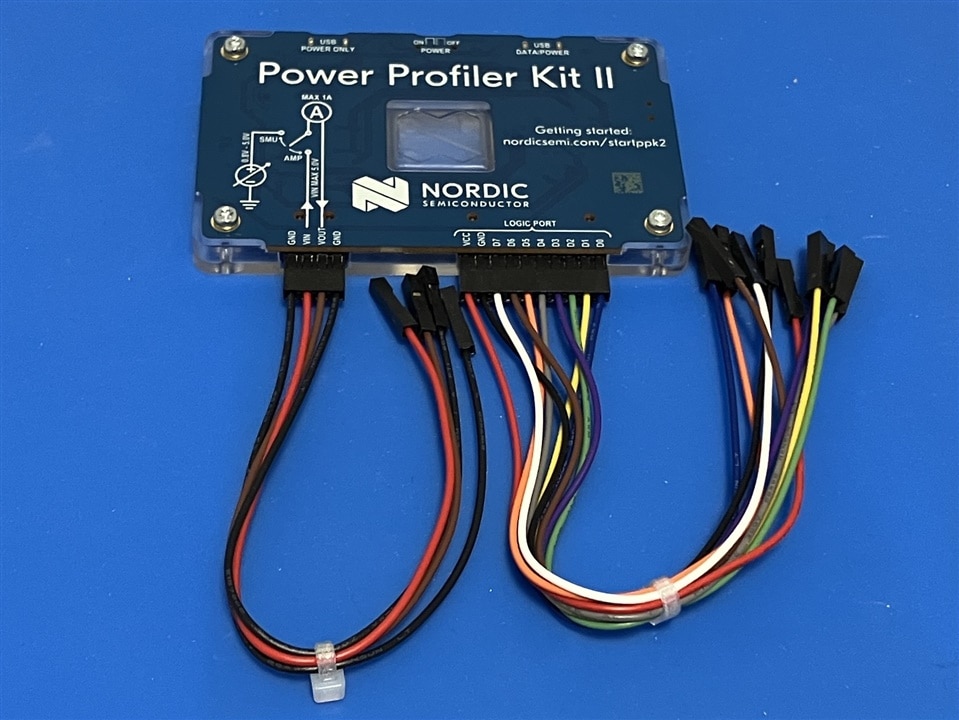
The PPK2 has an interesting enclosure concept. For usability sake, I assume the bottom side is a clear plastic housing protecting the PCB; the top is the PCB itself with a very descriptive silkscreen to label all connectors and switches; and each pin of those. Additionally there is a handy wiring diagram on how to connect the power supply and current meter part. Also present is a website link, pointing to all reference material, and a QR code which was not readable by my mobile devices. It is probably a production artifact. The part that I don’t like about this enclosure design: there a multiple traces visible behind the silkscreen on the PCB. All those signals are not ESD protected and simply part of the internal circuitry protected only by the solder mask. If this unit gets used away from an ESD controlled area, failure through zapping is a real possibility.
Lastly, the cardboard box was mangled due to the fact that the unit got shipped in a polybag without a lot of mechanical protection. Sometimes I wish shipping habits would not follow the big A with their cost savings approach, which is always at the expense of the customer. The PPK2 was not damaged in the travel adventures, so everything is set for an interesting roadtest.
The original roadtest was advertised to ship with the nRF5340 DK Development kit, which was not included with my delivery. I am OK with that, as I already stated in my application that I won’t use the dev kit during my testing which I have other ideas for. And [cstanton] confirmed that I don’t need the dev kit, otherwise I still could have gotten it.
To use the PPK2, the Power Profiler app is required, which is part of the nRF Connect for Desktop cross-platform development software for Nordic Products. The installation package lets you decide what apps to install; I opted to install only the Power Profiler and the Serial Terminal. I am always curious about terminal software, if any new product does something revolutionary different from all the other offerings. Surprisingly both apps threw a warning that they require the Segger J-Link software. So I installed this package as well.
To start the Power Profiler software, I always have to remember to connect the hardware unit before starting the app. After plugging in, the clear plastic housing makes even more sense now. 2 RGB LEDs illuminate the center section which is visible from the PCB side through a cut-out.
First thing to do is to select a device. Selecting is an easy choice because only 1 device is available. It greeted me with a message to be programmed, seems like it did not have the latest required firmware. I bravely clicked “Program”. Now I also know why the J-Link software is required.

After some LED flashing and status messages (programming, rebooting, reconnect), the software was stuck in ‘connecting…’ mode. The only way to get to connected mode was a full power cycle. And now I see the anticipated selection between source meter (red LED) and ampere meter (blue LED) mode. The LED colours are not intuitive to me, flashing green means the unit is powered but not connected, flashing red shows a connected status in source meter mode (stopped) and flashing blue indicates scope mode (stopped). I would have expected the inactive, disconnected mode to be red, but that is just a minor personal detail. Constant red resp. blue means the data sampling is running in the respective mode indicated by the colour.
A source meter is an instrument that (for the PPK2) can source a variable voltage into a test unit and measure the current. The PPK2 is a 1-quadrant source meter, because it only can supply a positive voltage and measure a positive current. Source meters come in up-to 4-quadrant instruments, which can source and sink (source a negative V or I) voltage and current and measure both parameters. They are very versatile equipment and in my opinion highly under-rated, e.g. could be used as a programmable electronic load. An amp meter is basically a cross-breed between a DMM and an oscilloscope with a current probe, being able to be hooked into a power path and measure current with a fancy display and trigger/recording options.
I am not going through all the features of the software package just to show what is possible. That is what the user guide is for. Let’s jump right into the testing and explore the capabilities that way.
First test is going to be a simple current measurement through a bunch of assorted resistors to get a feel for the accuracy and range.
I took a sample of through hole and power resistors and measured their values with a 6-digit DMM in 4-wire mode to get exact resistor values. The set consists of 15, 30, 500, 1 K, 20K, 33K, 100K and 1 Meg Ohm resistors. They are simply hooked into the VOUT and GND port with the PPK2 used in source meter mode. In addition I hooked up my UNI-T UT61B+ multimeter across the resistor to measure the real voltage at the resistor. With the set and measured voltage, I could calculate 2 current numbers and compare them to the measured current of the PPK2. The resistor values and voltages covered the current range from 1uA to 330mA, which is not quite the full range of the PPK2, which ranges from 200 nA to 1 A.
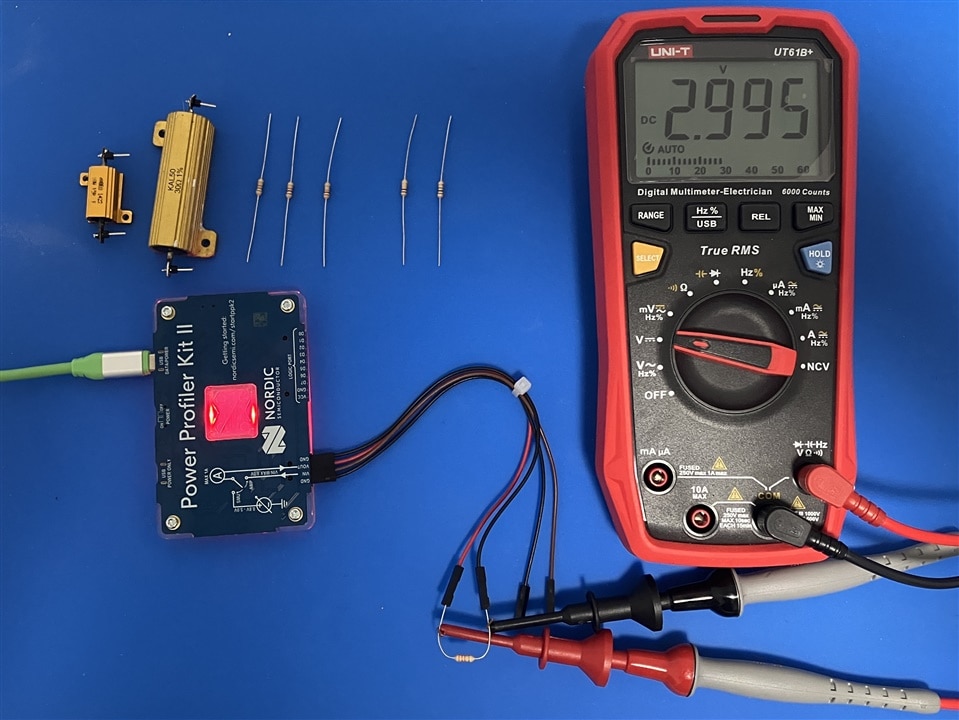
First thing I noticed that I can see quantization steps of the current reading on the data plot, see next image below. It immediately came to mind to be able to calculate the ADC bits of the PPK2. But then I remembered that the PPK2 is full open source device with available hardware and firmware files, showing the whole design. So I took the schematic and found out quickly that the nRF52840 has a build-in 14-bit ADC. Not bad for a MCU.
I started each test with the set voltage and let it run for some time to account for any thermal effects, at least 30 seconds. Then I pick a 10 second window for noting down the average and min, max values for the current draw. Then I change the voltage in 3 steps through 1 V, 2.5 V and 4.5 V and re-run the test.

I am using the average current measurements and the measured resistance and voltage for the deviation calculation.
The current calculations show a deviation around 2% for most of the measurements with some outliers at up to 6% and the exception of the 1 Meg resistor measurement, which sits at up to 14%. This is expected as current measurements at low absolute values are very difficult to achieve being accurate.
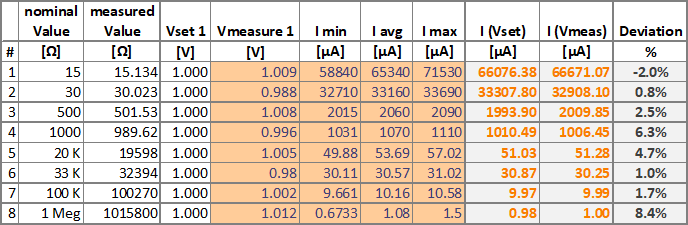
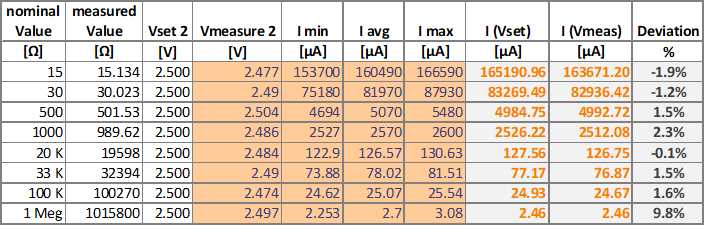
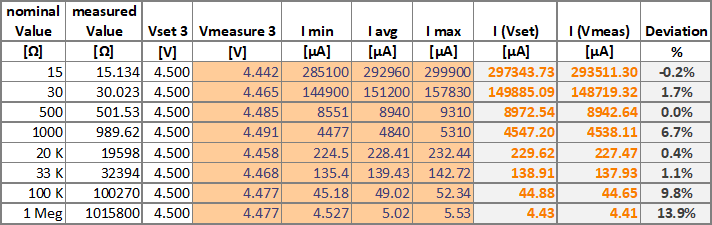
The spread from minimum to maximum measured current is rather significant. It shows that the PPK2 is not doing any filtering to smooth out the results. Spreads from 3 to 15 % are regular through my whole measurement range and going up to 20 – 76 % at the lowest current measurements.
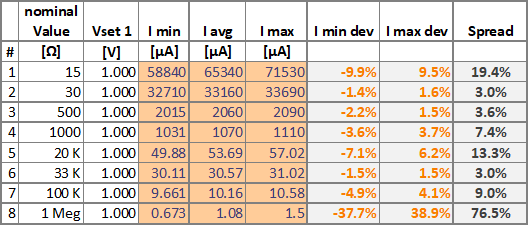
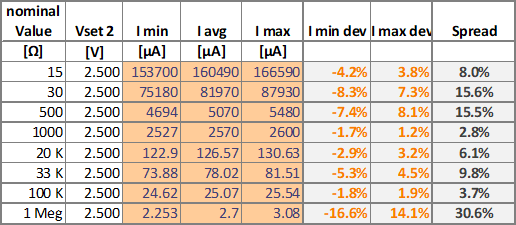
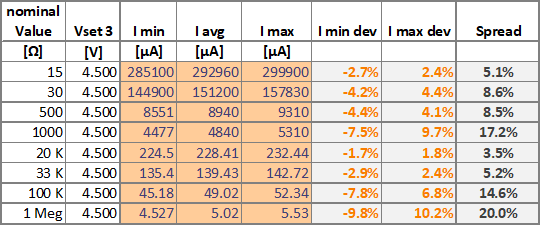
Only the 15 Ohm resistor at 4.5 V got noticeably luckwarm during the test passing ~ 300 mA and dissipating 1.35 W. This is also close to the limit of the PPK2 without a 2nd USB cable providing another 500 mA @ 5V.
Note: The minimum value does not get recorded, so I took the readings of the data logger trace.
This test got me thinking about the difference of the set voltage to the measured voltage and I created another test which I had not planned before.
I whipped up another test to try and characterize the observation that the set voltage differs from the measured voltage. I want to find out if there is a dependency or trend to be able to account for the difference. It is basically the attempt to be able to calibrate the PPK2.
A resistor is hooked between the Vout and GND connection of the PPK2 unit and the measurement is done in source meter mode. The multimeter is connected to the 2 sides of the external resistor and set to DC voltage mode to measure the voltage across the resistor.
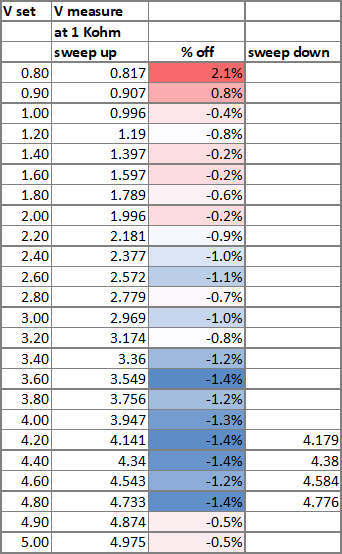
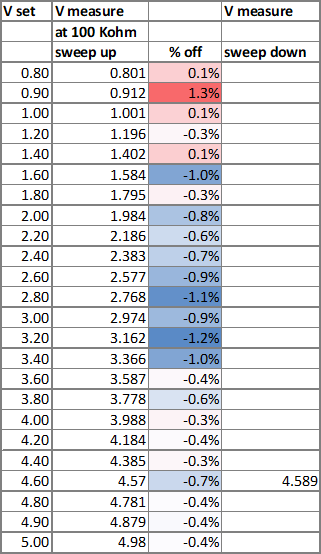
I picked 2 resistor values on the upper and lower end of my spectrum (1 KOhm and 100 KOhm) and swept the voltage through the full range of 0.8 to 5.0 V and recorded the measured voltage across the resistor.
The measured voltage at the test unit is accurate to +2.1%/-1.4% with the 1 KOhm resistor and +1.3%/-1.2% accurate with the 100 KOhm resistor.
I saw some different output voltage results when sweeping down from initially higher voltage settings? It only happened at a few voltage levels and I could not find a good metric to explain these findings.
The multimeter showed quite some overshoot when changing the voltage on the fly without turning off the output. Let’s have a look with max hold and confirm with the scope…
With the same setup as the source meter voltage sweep and the multimeter set to max hold, the “Set Power Supply” input is used to switch form a lower voltage to a higher voltage without turning the output off. Measurements are done with the 1 KOhm and 100 KOhm load again. Then the same target voltages are set while the source meter output is off and then switched on to measure if a similar overshoot is noticeable.
The following overshoot values are measured:
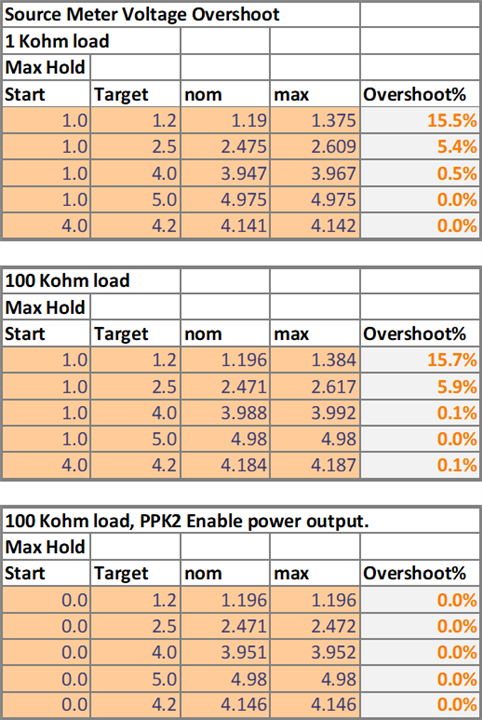
When switching the input voltage while the output is on, the overshoot is considerable high up to about 16% at lower voltages. It gets less when switching to higher voltages in the operational range. The non-existing overshoot at 5 V, is probably because of the system being powered by USB and VBUS sitting at 4.975 V. And noticeably, when changing the voltage while the output is off and then switching the output on, shows basically no overshoot. Next I wanted to confirm those numbers with an oscilloscope. I used the same test setup with the scope instead of the multimeter and recorded the overshoot from starting at 1 V to a new set voltage of 1.2 V, 2.5V, and 4.5 V and from a turned off output also to 1.2 V, 2.5V, and 4.5 V. Here the results show that the overshoot is up to 540 mV and lasts for up to 700 msec. Below is a slideshow, showing the initial spike and the full duration until the output reaches the set voltage.
| {gallery}Scope plots of Overshoot measurements |
|---|
|
Overshoot 1 V -> 1.2 V - 100 msec timebase |
|
Overshoot 1 V -> 1.2 V - 0.25 msec timebase |
|
Overshoot 1 V -> 2.5 V - 100 msec timebase |
|
Overshoot 1 V -> 2.5 V - 0.1 msec timebase |
|
Overshoot 1 V -> 4.5 V - 100 msec timebase |
|
Overshoot 1 V -> 4.5 V - 0.25 msec timebase |
|
Overshoot OFF -> 1.2 V - 0.1 msec timebase |
|
Overshoot OFF -> 2.5 V - 0.1 msec timebase |
|
Overshoot OFF -> 2.5 V - 0.25 msec timebase |
|
Overshoot 1 V -> 4.5 V - 0.25 msec timebase |
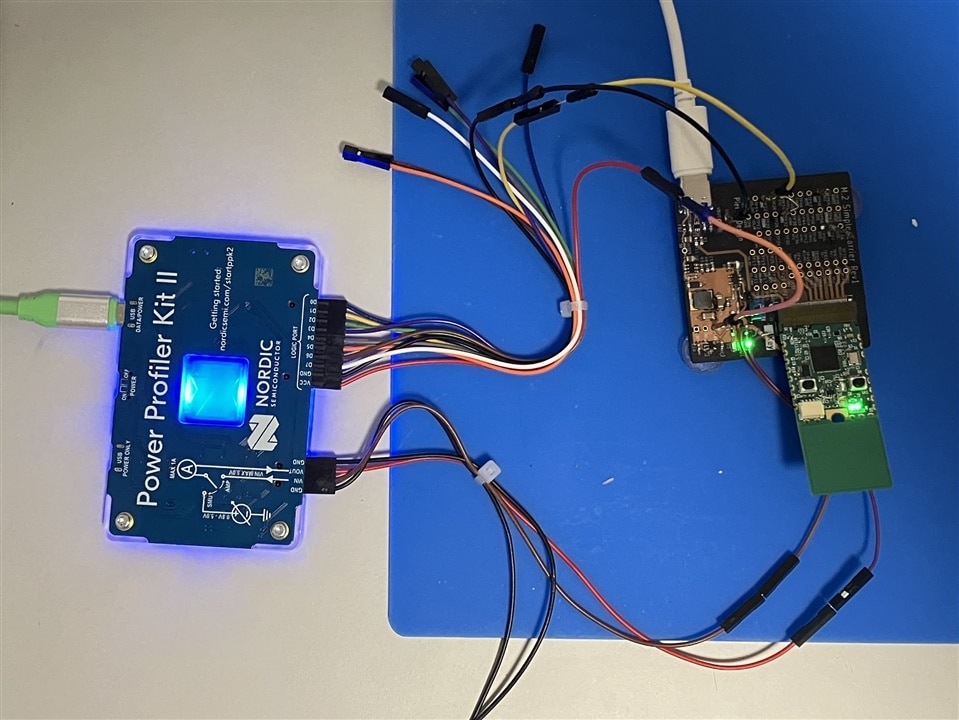
For a real-world example, I am using my trusty M.2-Pico RP2040 microcontroller platform with a self-built M.2 carrier board. I am measuring the supply current into the RP2040 and try to find out some interesting results. It is also possible to use the digital interface to trigger on known events.
The PPK2 is used in AMP meter setup (blue LED) and scope mode. With this configuration, the tricky part is to know a working current threshold to make the scope trigger, here a continuous free running mode or a force trigger would be very useful.
My IDE of choice to program the RP2040 board is Arduino for its ease of use for simple applications. It is a simple program, using the UART interface on the M.2 end to loop back some sent transmit bytes and display them through the built in USB/COM port.
To make my life easier, I hooked up the loopback UART to a digital input pin of the PPK2 and trigger on a digital event. VCC on the digital interface of the PPK2 is also an input and needs to be connected to the VCCIO rail of the test unit. In my case it is a 1.8 V signal and I have this voltage available on the carrier board.
Current draw (and the digital trigger signal) is recorded for later analysis. With the digital trigger signal recorded as well it is easy to know where to start the decoding process. If only the current trace is available, some more reverse engineering would need to be applied to extract data from the measured results.
I am using a drawing tool to move condition markers around the recorded screenshot. With the minimum bit (shortest hi or low pulse) length of 416 usec, the baud rate of 2400baud can be extracted. A UART byte (8-bit + start and stop bit) will be of 4.16mec length as marked in the screenshot. Here four 0xFF bytes were sent to easily find the start/stop bit combination.
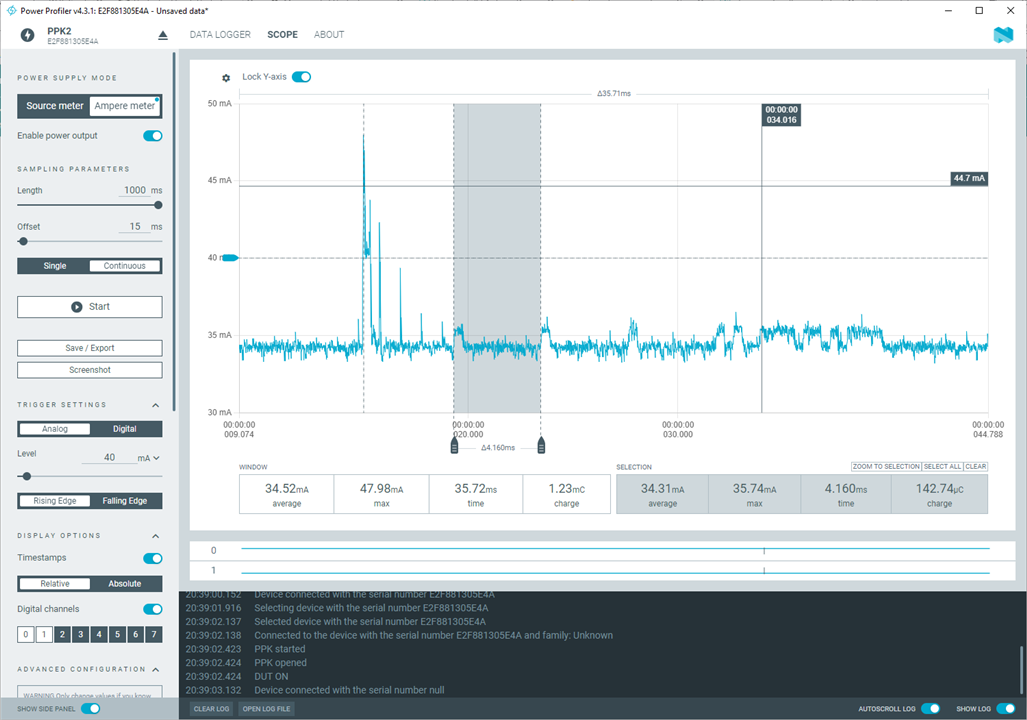
Current draw of the IO driver seems to be a little ahead of the digital signal recording (propagation delays hard at work). And a logic ‘0’ is drawing more current than a logic ‘1’, so the current trace is inverted to the bit values of the UART stream. Below is a fully decoding of a ‘unknown’ UART test signal.

The decoding shows a byte stream of “e14” terminated by 2 carriage returns and a line feed. Not surprisingly, this is exactly what was sent by the program through the command Serial1.println(Testdata);
This admittedly fabricated test shows that the PPK2 could be used for reverse engineering or side channel attacks over the power supply and current draw of a unit under investigation.
Scope mode is missing a force trigger button. I find this feature very useful for a quick check if the signal is the expected range and if the system is running at all.
The software also shows the charge, this is mostly useful for any battery/capacitor type measurements. I’ll leave that to other users to explore deeper.
The PPK2 is a nifty little piece of test equipment. It follows the trend to have the acquisition head in hardware only and leverage a PC for all display and back-end functionality. It does everything advertised well enough, that it will stay on my workbench every time I have to integrate new devices that will fit its input range. The use is limited to 5V in source meter mode and 1 A of current measurement. I still have to review the schematic if it is possible to use the unit in current meter mode for higher that 5 V systems. It might be possible as a low-side measurements hooked up the GND wire of the test unit instead of input power.
I was most impressed by the seamless switching of 5 different current ranges without disconnecting the test unit.
It also has some limitations, which the user needs to be aware of. There was quite some overshoot when turning the power rail on or changing the source meter voltage during operation. At the lower voltage range the overshoot exceeded standard +-10% limits. All measurements show a significant spread between minimum and maximum values. The average value is a good compromise when a stable setup is under investigation. The windowing function to limit the data used for the max/avg display is very useful here.
And for the full current sourcing range 2 USB interfaces are required.
Overall I am very pleased that I applied and got selected for this test. I have learnt a lot and hopefully could give back to the community. And last but not least, my zoo of test gear has a useful new addition.


