RoadTest: 3GHz Spectrum Analyzer - R&S® FPC1000
Author: rachaelp
Creation date:
Evaluation Type: Test Equipment
Did you receive all parts the manufacturer stated would be included in the package?: True
What other parts do you consider comparable to this product?: There are various other Spectrum Analyzers with comparable specs / price / performance. Rigol and Siglent have analyzers in a similar form factor with similar feature sets, although they also have tracking generator options. Tektronix also provide their RSA306 series which operates over a similar frequency range but also requires a dedicated PC for the supporting operating software.
What were the biggest problems encountered?: The various options for instrument control software on both the macOS and Windows platforms weren't without issues and I was unable to get a single satisfactory software setup which worked to my needs. Trying to use the Python scripting capability embedded in RSCommander on my MacBook Pro threw up numerous problems and I was unable to get it working.
Detailed Review:
* * * Work In Progress * * *
I received my new Rohde&Schwarz FPC1000 3GHz Spectrum Analyzer at the end of January. Thank you so much to both Element14 and Rohde&Schwarz for picking me for this Road Test. It's an very good product and I am very happy indeed to have one sitting in my lab as I have been eyeing up various Spectrum Analyzer options for quite a while now.
Spectrum Analyzers have traditionally been very expensive and specialist equipment which were usually out of reach for small development labs with their typically smaller budget. In recent years this has changed a lot and there are now a number of more affordable options which, whilst not yet down at the entry level oscilloscope price range, certainly make them a very attractive option for smaller development labs.
The main Rohde & Schwarz website for the FPC1000: https://www.rohde-schwarz.com/uk/product/fpc1000-productstartpage_63493-363458.html
The package arrived and was surprisingly small and light. It was well packed with plenty of foam padding with a separate section for cables, plug adapters, etc. There's not a lot else in the box, just the instrument, power cables and some basic documentation as you would expect. There are no other additional pieces of hardware for making connections and measurements like you'd get with an oscilloscope, and this is fine as the required external hardware is very dependant on your intended application so I would not expect anything else to be supplied for an instrument of this type.
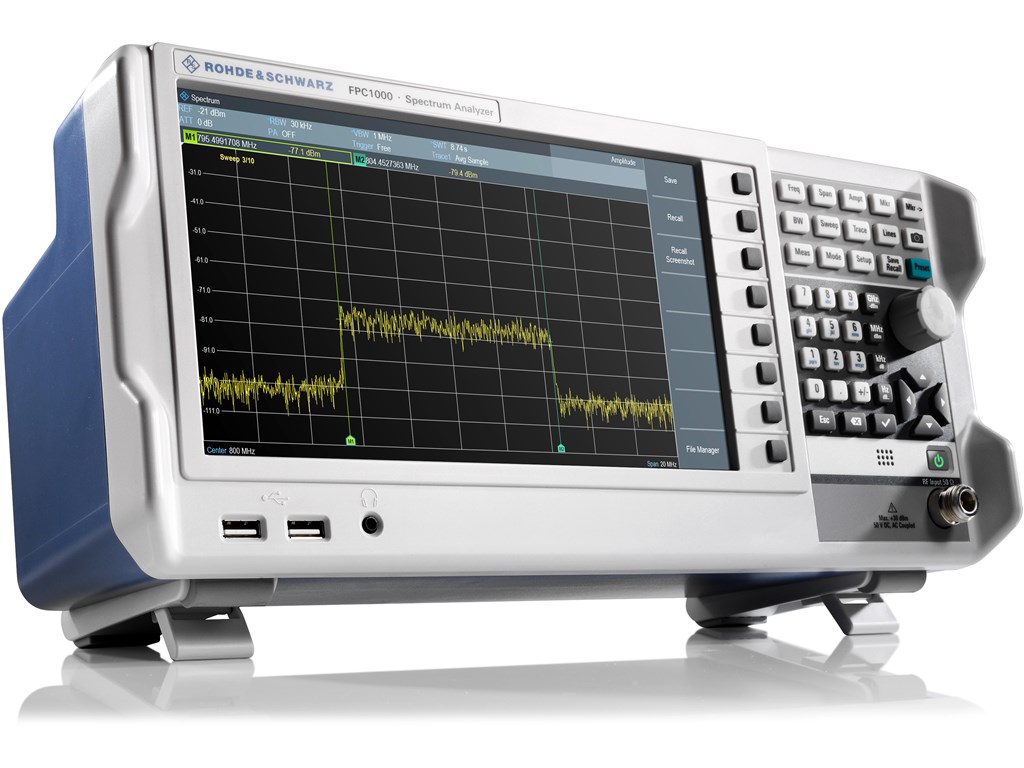
The Rohde & Schwarz FPC1000 is a 5KHz to 3GHz Spectrum Analyzer. A more detailed review of this unit will be given in the following road test report. The big selling feature for this unit is the low entry cost and the complete upgradability by adding software licenses. In this way you can buy the basic 1GHz bandwidth model and then add additional bandwidth and features by adding additional licenses as required. The following shows the basic cost of the unit and all of it's options:
FPC1000 1GHz Spectrum Analyzer: €1530
FPC1000 2GHz Spectrum Analyzer: €2370
FPC1000 3GHz Spectrum Analyzer: €3210
FPC-B2 Frequency Upgrade 1GHz-2GHz: €840
FPC-B3 Frequency Upgrade 2GHz-3GHz: €840
FPC-B22 Preamplifier Upgrade: €350
FPC-B200 Wifi Connection Support: €290
FPC-K7 Modulation Analysis Upgrade: €690
FPC-K43 Receive Mode Upgrade: €490
FPC-K55 Advanced Measurements Upgrade: €490
It can be seen from the list above that the total cost of a fully loaded instrument would be €5520.
Here are some of the key specifications for this instrument:
Input Measurement Range: 5KHz to 3GHz
Input Power: +30 dBm (continuous), +36 dBm (peak, < 3s)
Resolution Bandwidth (RBW): 1Hz to 3MHz in 1/3 sequence
Video Bandwidth (VBW): 1Hz to 3MHz in 1/3 sequence
Displayed Average Noise Level (DANL): (Without pre-amplifier) 1MHz-10MHz: -135 dBm (typ), 10MHz-2GHz: -150 dBm (typ), 2GHz-3GHz: -147 dBm (typ) ; (With pre-amplifier) 1MHz-10MHz: -157 dBm (typ), 10MHz-2GHz: -165 dBm (typ), 2GHz-3GHz: -163 dBm (typ)
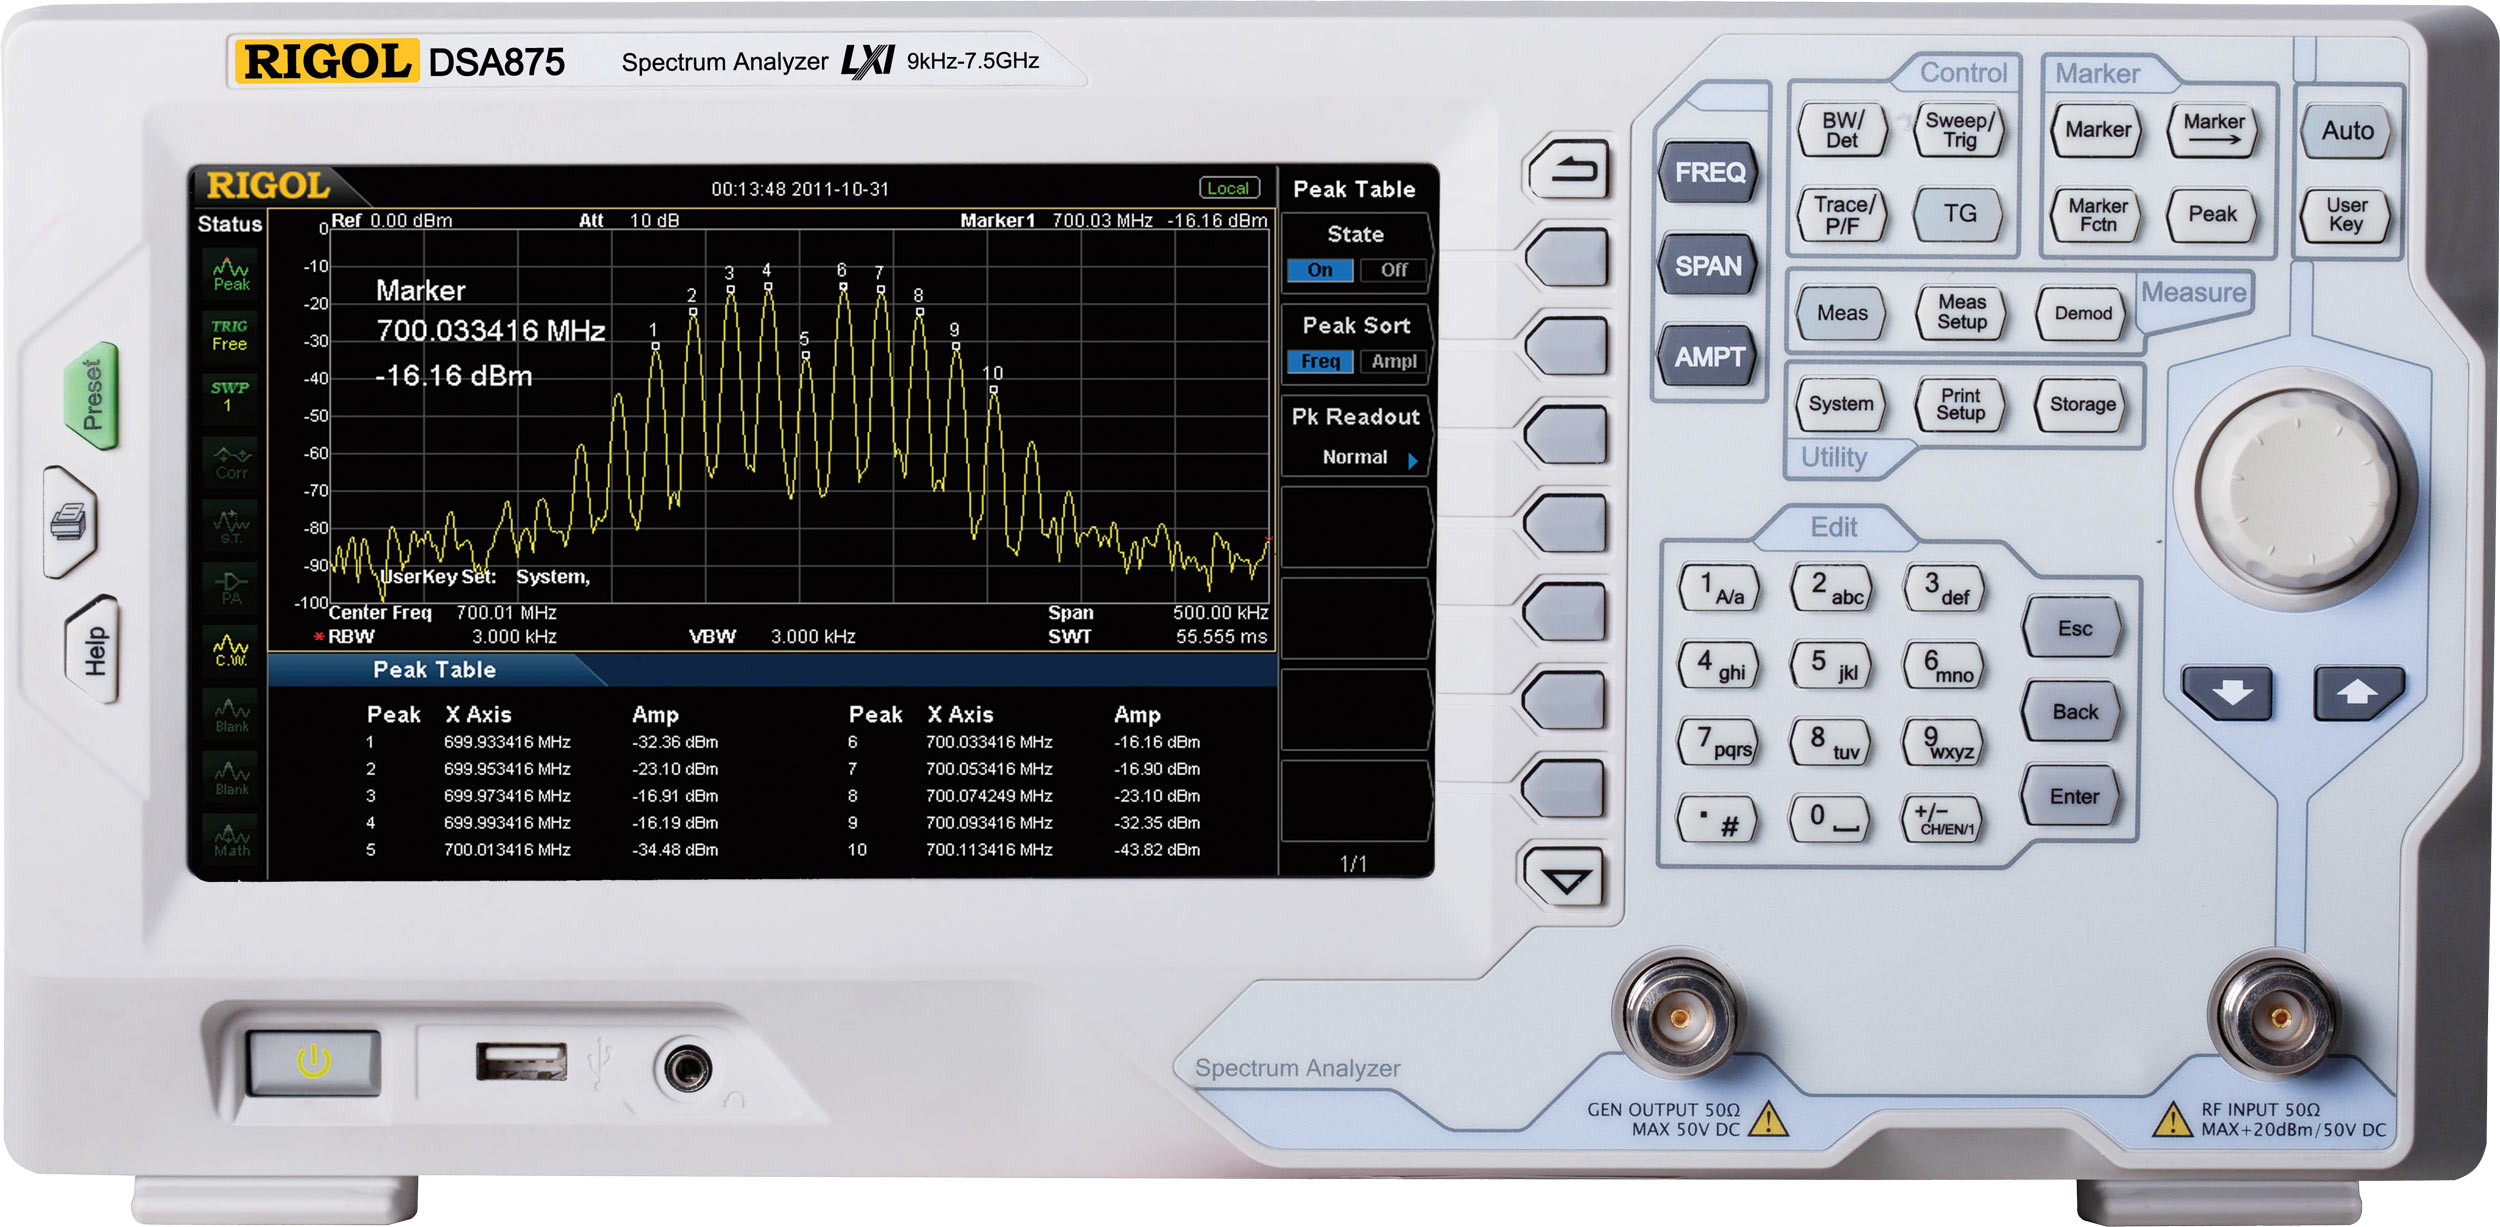
The Rigol DSA832 is a 9KHz to 3.2GHz Spectrum Analyzer. I don't have access to this unit to do a side by side comparison. The front panel has similar controls as you'd expect. This unit has the option to purchase it with a built in tracking generator for a small extra cost. This has to be purchased up front when you buy the unit and it doesn't support license based bandwidth upgrades but the range does go all the way up to a 7.5GHz option. At the time of writing this unit is heavily discounted, probably due to the new Rigol RSA5000 series now being available. The total cost for this would currently be €2995 or €3495 with the tracking generator option. If you are happy with slightly worse noise and ageing specs there is a DSA832E version which comes in at €1995 or €2495 with the tracking generator option.
Here are some of the key specifications for this instrument:
Input Measurement Range: 9KHz to 3.2GHz
Input Power: +20 dBm (Attenuation -30dB) CW RF, +30 dBm Max. Damage Level
Resolution Bandwidth (RBW): 10 Hz to 1 MHz, in 1-3-10 sequence
Video Bandwidth (VBW): 1 Hz to 3 MHz, in 1-3-10 sequence
Displayed Average Noise Level (DANL): 9KHz-<100KHz: -110 dBm, 100KHz-<1Mhz: -142 dBm, 1MHz-<5MHz: -145 dBm, 5MHz-<3.2GHz: -151 dBm

The Siglent SSA3032X is a 9KHz to 3.2GHz Spectrum Analyzer. I don't have access to this unit to do a side by side comparison. The front panel has similar controls as you'd expect. This unit has a build in tracking generator which is available as a license upgrade option. At the time of writing this unit is heavily discounted and the tracking generator option is being bundled in for free. The total cost for this would currently be €2259.
Here are some of the key specifications for this instrument:
Input Measurement Range: 9KHz to 3.2GHz
Input Power: 33 dBm, 3 minutes, input attenuation >20 dB
Resolution Bandwidth (RBW): 1Hz to 1MHz in 1/3 sequence
Video Bandwidth (VBW): N/A
Displayed Average Noise Level (DANL): 9KHz-<100KHz: -117 dBm, 100KHz-<1MHz: -137 dBm, 1MHz-<10MHz: -154 dBm, 10MHz-<200MHz: -161 dBm, 200MHz-<2.1GHz: -158 dBm, 2.1GHz-<3.2GHz: -149 dBm

The Tektronix RSA306B is a 9KHz to 6.2GHz Real Time Spectrum Analyzer. I don't have access to this unit to do a side by side comparison. This instrument is a USB unit which requires a PC running the Tektronix SignalVu-PC software in order to be able to operate it. It's a very compact unit with a high specification and the user interface and control software is the same as works with Tektronix's more expensive spectrum analyzers. The cost for this unit is normally €3860 but there are currently units available for discount at €3281.
Here are some of the key specifications for this instrument:
Input Measurement Range: 9KHz to 6.2GHz
Input Power: +20 dBm
Resolution Bandwidth (RBW): 1Hz to 8MHz
Video Bandwidth (VBW): N/A
Displayed Average Noise Level (DANL): 100KHz-42MHz (LF path): -133 dBm ; 2MHz-<5Mhz: -148 dBm, 5MHz-<1GHz: -163 dBm, 1GHz-<1.5GHz: -162 dBm, 1.5GHz-<2.5GHz: -159 dBm, 2.5GHz-<3.5GHz: -156 dBm, 3.5GHz-<4.5GHz: -155 dBm, 4.5GHz-<6.2GHz: -151 dBm
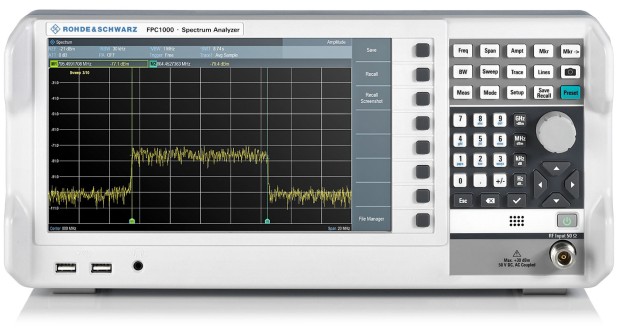
The font panel of the FPC1000 is quite straightforward and well laid out. There is a large 10" LCD display to the left and all the control buttons and knobs to the right including the 'soft' power button to startup and shutdown the instrument. At the bottom right hand side there is the N-Type connector for the RF input and at the bottom left side there are two USB ports and a headphone jack.

The rear panel is very simple. There is a power inlet connector with a dedicated physical power switch to allow the instrument to be completely switched off rather than just being in standby. I like this, too many things (not just test equipment) come with only the 'soft' power button these days and you have physically unplug it if you don't have a switched outlet. Then there are three other connectors, the Ethernet LAN port and a USB port to allow for instrument control, and a BNC connector to allow for the either an external 10MHz reference if you have a very accurate and stable distributed lab reference clock to all your instruments, or an external trigger input.
The following short video shows just how quick this instrument boots up. This is a refreshing change and when compared to my oscilloscope which takes nearly forty seconds to fully boot it is very welcome. This unit is also fan-less so is absolutely silent and in a small development lab which doubles as an office I think this is a huge positive.
Looking at the screen, the waveform area is reduced a little by the permanent menu and status bars which are across the top and down the right hand side. This reduces the overall area for the waveform quite considerably but the display is a reasonable size so I didn't find this to be a problem. There are a set of buttons to the right hand side of the display which align with the menu bar area on the right of the screen.
The control buttons and knobs are split into two sections. At the top there are 15 buttons which control what function we need to access, e.g. the 'Freq' button enters a mode which allows us to set the center frequency, similarly the 'Span' button allows us to set the range of frequencies of interest around the center frequency. The lower section is a numeric keypad with buttons down the right to choose the appropriate units whether they be frequency or level. Finally there is a rotary knob and navigation buttons to allow for navigation around the various menus. Outside of setting up the instrument in the main setup screen I haven't had to use these in normal operation.
From the above we can see that the UI follows a typical pattern used on many instruments. A big screen with virtual button bars, corresponding physical buttons next to them, buttons to control the overall mode and buttons for data entry. Rohde & Schwarz have done a reasonable job of making this unit follow expected usage patterns and giving reasonably quick access too most functions with minimal button presses. To prove the point I decided to just try and use the unit and see if I could easily find what I was looking for and work out how to set up for particular experiments. I found that with only a few minutes of running through all the modes and menus and familiarising myself with all the options I was able to get a pretty good understanding of how to operate the instrument and I found the setup for the subsequent testing to be relatively quick and painless.
Unlike my Keysight oscilloscope and power supply units which have simple to use web interfaces which mirror the front panel in order to be able to control the instrument and grab images from the display, the Rohde & Schwarz FPC1000 does not have such an interface despite having both wired and wireless Ethernet network options available. Opening up a web browser and entering the IP address of the unit redirects to the Rohde & Schwarz GLORIS licensing and support website which then appears to attempt to connect back to my unit using it's local IP address which then fails.


This seems a little strange that a web interface feature would redirect to an external website and even more strange that it would not work reliably. This sort of feature, relating to licensing should be bullet proof in its reliability and should just work. Issues like this in a product from a company like Rohde & Schwarz are disappointing. In any case, what I really want from a web interface is a easy and full featured way to control the instrument and capture waveform data, what is provided with this unit is not what I would have expected. License management is something you might want to do occasionally, at most it should have been an option available from within a more fully featured web interface.
During the course of writing this review, one of the other reviewers gpolder, posted up their review and they have found the solution to the above, which is to run Google Chrome from the command line with the option to enable unsafe mode which allows previously blocked scripts from unsafe sources to run. Here is the command to open Chrome in this mode:
open /Applications/Google\ Chrome.app --args --allow-running-insecure-content
This sort of workaround seems quite wrong to me. These scripts should be on a website with suitable certificates to validate their authenticity and these sorts of workarounds should not be necessary.
RSCommander is an instrument viewer and monitoring application compatible with a large range of the Rohde & Schwarz instruments and which allows you to view and capture the full screen or waveforms for documentation, send SCPI commands to the unit via the interactive control widget, save from and load files to the equipment and run Python scripts to control the unit. All these windows can be undocked and it makes it possible to get some high resolution waveform captures. There are some noticeable limitations however, you can watch a live display of the waveform but it doesn't update with changes made to the instrument configuration until you close it down and open up a new trace window. In addition, there appears to be no way to show the markers on the waveform window and it is not possible to capture the spectogram display with this, just the main traces. If you want an image with the markers or the spectogram then this has to be taken using the full screen capture. This is lower resolution than the waveform capture window though and isn't updated live. Here is an example of what the RSCommander window looks like with a trace capture:

I mentioned above that you can script the instrument using Python and RSCommander provides a rudimentary editor/debugger for writing and running python to issue SCPI commands to the unit to control it using pyvisa. Unfortunately this appears to not be working, even the example scripts supplied error when attempting to run them. It appears to be because of missing python 2.7 packages. Whilst the application appears to have a minimal python environment embedded into it, there are several packages which it repeatedly complains are missing even with the most basic of scripts. This is quite disappointing as things like this should work reliably. I was wondering if it is relating to my machine having python 3.6 installed and the original python 2.7 is no longer available and even though it ships a little python environment including the python 2.7 executable I was wondering whether maybe it is relying on other libraries existing on my system which it is now no longer able to to find. I tested this theory out on another machine which still had the older 2.7 python installed but the problem persists. Further investigation seems to lead me to think it's not able to see the bundled libraries properly due to some path issue but I haven't had the opportunity to fully investigate this. Here is a picture of the script editor window:

Here is the sample code from idn.py which should simply send *IDN? to the instrument using SCPI which should return some basic instrument identification information:
import visa

rm = visa.ResourceManager()
instr = rm.open_resource('TCPIP0::192.168.0.24::INSTR')
print instr.query('*IDN?')
Upon running this, rather than actually issuing the SCPI command to the unit the python interpreter throws errors:
Traceback (most recent call last):
  File "", line 11, in
  File "/Applications/RSCommander.app/Contents/Frameworks/Python.framework/Versions/2.7/lib/python2.7/site-packages/visa.py", line 16, in
    from pyvisa import logger, __version__, log_to_screen, constants
  File "/Applications/RSCommander.app/Contents/Frameworks/Python.framework/Versions/2.7/lib/python2.7/site-packages/pyvisa/__init__.py", line 17, in
    import logging
  File "/Applications/RSCommander.app/Contents/Frameworks/Python.framework/Versions/2.7/lib/python2.7/logging/__init__.py", line 26, in
    import sys, os, time, cStringIO, traceback, warnings, weakref, collections
ImportError: No module named time
Traceback (most recent call last):
  File "", line 1, in
NameError: name 'resource_manager' is not defined
Traceback (most recent call last):
  File "", line 1, in
  File "/Applications/RSCommander.app/Contents/Frameworks/Python.framework/Versions/2.7/lib/python2.7/site-packages/visa.py", line 16, in
    from pyvisa import logger, __version__, log_to_screen, constants
  File "/Applications/RSCommander.app/Contents/Frameworks/Python.framework/Versions/2.7/lib/python2.7/site-packages/pyvisa/__init__.py", line 17, in
    import logging
  File "/Applications/RSCommander.app/Contents/Frameworks/Python.framework/Versions/2.7/lib/python2.7/logging/__init__.py", line 26, in
    import sys, os, time, cStringIO, traceback, warnings, weakref, collections
ImportError: No module named time
Traceback (most recent call last):
  File "", line 1, in
NameError: name 'instrument' is not defined
You can see from the above there there are various import errors, looking for a module called time. You can also see several name errors looking for variables named resource_manager and instrument. We can see from our code that there is an rm and an instr defined though. I'm not sure where it is getting the erroneous names from, they don't appear in the code and renaming the ones that are in the code to match doesn't make any difference. In fact running a simple python script to simply print 'Hello World' also gives exactly the same errors.
InstrumentView is a monitoring and control application for Rohde & Schwarz instruments which is available for Microsoft Windows only. I'm not a Windows user by choice, all my machines are either macOS or Linux. In order to use Windows applications I have a Windows 7 virtual machine running in a virtual machine on VMWare Fusion. Unfortunately, after installing InstrumentView it was unable to connect to the instrument. I was unable to use the automatic detection to find the unit and even manually entering the IP address the software was unable to connect. I checked my networking setup and from a command prompt in Windows I was able to ping the unit so network connectivity was fine and I don't have anything blocking any network ports in the VM, it just wouldn't work which was a little disappointing, especially as RSCommander on macOS was not fully featured or fully working, I was hoping this would be a reasonable way to control the unit during my testing.
MobileView is a monitoring and control app for Rohde & Schwarz instruments which is available for iOS and Android platforms. In my case I am running it on an iPad and I have to say, it actually works quite well. Unfortunately this is a little more problematic for getting images to insert into this review so I will be using a combination of the MobileView app and RSCommander for my testing. Here is a sample screenshot from the MobileView app on my iPad:

In this capture I have the instrument set to a centre frequency of 2.4GHz, span 20KHz, RBW and VBW both to 1Hz. The yellow trace is the standard spectrum trace and the green trace is the second trace set to peak hold. You can see there is a noticeable peak at 2.4GHz. The interesting thing here is that there is nothing attached to the front of the unit, so this 2.4GHz is being picked up either from various RF sources in my lab on the un-terminated input (I don't have anything to put on the input to terminate it) or is from the internal WiFi. I'm going to guess that this is the former and as soon as I get to making real measurements with it this will disappear. I'll keep an eye on this when I perform my first tests to see if it goes away when there is something connected to the input.
I'll be using this app quite extensively to control the instrument in combination with RSCommander to be able to do screen captures of the data. I prefer this approach to controlling the instrument as it means I can set up each experiment and then can adjust the settings and take screen captures quickly and easily without having to switch between my computer and my lab bench too often. Plus it's cold and snowy outside and this means I can mostly stay downstairs by the fire! 
Before I start doing any experiments, I am going to follow the advice given by shabaz on another thread and take some precautions to protect the instruments delicate front end electronics and also to prolong the life of the Type-N connector on its input. To this end by default I will have a 10dB attenuator in-line with the input to reduce the risk of nigh level signals damaging the unit. In addition I am going to add a Type-N to SMA adapter to the front of the unit and that will stay there so that a) I can use SMA cables and b) when the SMA connector wears out from use I can replace the adapter and the main Type-N input connector will not be subject to the wear and tear of adding and removing cables thus prolonging its life. The following items are the ones I am using for my testing:
 | R411810124. - RF / Coaxial Adaptor, SMA Attenuator, 10dB, 3GHz, Intra Series Coaxial, SMA, Plug, SMA, Jack
|
 | 73386-0183 - RF / Coaxial Adaptor, Inter Series Coaxial, Straight Adapter, N, Plug, SMA, Receptacle
|
For this test I will be using the generator which is built into my Keysight MSO-X3054A oscilloscope to generate, sine and square waves as well as AM, FM, and FSK modulation signals, and I will feed this into the FPC1000 Spectrum Analyzer and also into the MSO-X3054A using the FFT mode so I can compare the capabilities of a dedicated instrument with the FFT mode of a regular oscilloscope. It should be noted that the oscilloscope is limited to 500MHz bandwidth vs the 3GHz of the spectrum analyzer but as I am using the built in generator from the oscilloscope the signals we are looking at will be very low down the frequency range anyway (except edges of square waves!) so this shouldn't be too much of a limitation. I don't have access to an RF signal generator to give this a better test at higher frequencies unfortunately.
| Signal Type | Signal Generator Settings |
|---|---|
| Sine Wave | Frequency: 10MHz |
| Square Wave | Frequency: 10MHz |
| Noise | N/A |
| Gaussian Pulse | Frequency: 5MHz |
| AM Modulation | Carrier Frequency: 10MHz; Test Frequencies: 1KHz, 5KHz |
| FM Modulation | Carrier Frequency: 10MHz; Test Frequencies: 1KHz, 5KHz |
| FSK Modulation | Carrier Frequency: 10MHz; Hop Frequency: 10KHz; FSK Rate: 20KHz |
| Signal Type | MSO-X3054A Waveforms |
|---|---|
| Sine Wave |  |
| Square Wave |  |
| Noise |  |
| Gaussian Pulse |  |
| AM Modulation | Unable to capture with FFT |
| FM Modulation | Unable to capture with FFT |
| FSK Modulation | Unable to capture with FFt |
| Signal Type | FPC1000 Waveforms |
|---|---|
| Sine Wave |  |
| Square Wave |  |
| Noise |  |
| Gaussian Pulse |  |
| AM Modulation |
|
| FM Modulation |
|
| FSK Modulation |
|
We can see from the above, when it comes to measuring signals in the frequency domain, whilst it's possible to get some basic measurements using the FFT of an oscilloscope, the dedicated spectrum analyzer significantly out classes it in even the basic measurements and is able to perform measurements where the FFT is unable. The Sine, Square, Noise and Gaussian Pulse measurements above were all taken with the center frequency and span of the instruments set the same for both the MSO-X3054A and the FPC1000. But whereas I can set the bandwidth for the measurement on the spectrum analyzer there is no such setting available on the oscilloscope and the resulting FFT trace is very coarse and noisy as a result. In addition the oscilloscope has much lower resolution on its input ADC's so it's noise performance is significantly reduced. In contrast to the lower quality of the FFT from the oscilloscope, on the FPC1000 you can see nice clean waveforms with distinct narrow peaks on the spectrum analyzer.
My signal generator is able to generate AM, FM and FSK modulation test signals which I have shown above. Unfortunately as my unit was not shipped with the FPC-K7 Modulation Analysis license I was unable to fully explore the capabilities of the FPC1000 for decoding and analyzing these types of signals. The final image of the FSK modulation I threw in an image showing the spectrogram capability of the unit. Basically the spectrogram has time in the vertical and frequency in the horizontal and colours the display such that higher levels are towards the red end of the spectrum and low levels are towards the blue end of the spectrum. This gives another dimension to the information displayed by the instrument and allows you to see if there are any time based relationships in when certain frequencies are present. For example, there may be a peak showing at a certain frequency in the display but you don't know where it comes from. Turning on the spectrogram shows how the peak changes over time and this may help determine if there are particular functions of the equipment being tested which tie up with what is being seen in the spectrogram and are the root cause of the peaks.
For this test I will be using my Ramsey Electronics LLC, STE2800 RF shielded enclosure. It is designed specifically for doing RF testing on mobile phones. The rear of the unit has three connectors. The first is a USB connector which has another USB connector on the inside so the USB can pass through the RF enclosure to allow the phone to be connected up via USB to a computer so that, when put into certain software modes, the various RF functions of the phone can be specifically triggered and tested. The other two are SMA style RF connectors. One of these is a passthrough to a mating connector on the inside (like the USB) presumably so an external antenna on the phone can be removed and the RF transceiver directly connected with coax cable. The second provides a connection to an inbuilt RF antenna with a flat response over the 800MHz to 8GHz range which will receive any signals transmitted by the phone. This is the configuration I shall be using for my testing. I don't know exactly what to expect from this so I will see what peaks appear in the spectrum and will take a look at what other data I can capture, possibly utilizing the spectrogram function to see if there are any repetitive signals.
Here is the test phone which is an old Nokia 6100 in the RF Shielded enclosure. This connects to the FPC1000 via a short SMA cable.

| Signal Type | FPC1000 Waveforms |
|---|---|
Nokia 6100 + STE2800 Shielded RF enclosure |  |
The center frequency is set at 900MHz as the frequency band we are interested in is the GSM-900 band. I tried a number of settings for the span and the RBW but getting a reliable capture was tricky. With a narrower span for some reason it wouldn't capture anything and I found it was a trade off for the RBW, too low and the update would be very low and it would rarely coincide with the signal from the phone. Too large and there wouldn't be anything really distinguishable. This is an area I will investigate more to understand what I am seeing and whether I can adjust the settings to try and get a better capture. What I did manage to capture is shown above. You can see there are two distinct peaks, one and a little below 900MHz and around 910MHz.
From Wikipedia:
GSM frequency bands or frequency ranges are the cellular frequencies designated by the ITU for the operation of GSM mobile phones and other mobile devices.
GSM band ƒ (MHz) Uplink (MHz)
(Mobile to Base)Downlink (MHz)
(Base to Mobile)Channel number Equivalent
LTE bandT-GSM-380 380 380.2 – 389.8 390.2 – 399.8 dynamic T-GSM-410 410 410.2 – 419.8 420.2 – 429.8 dynamic GSM-450 450 450.6 – 457.6 460.6 – 467.6 259 – 293 31 GSM-480 480 479.0 – 486.0 489.0 – 496.0 306 – 340 GSM-710 710 698.2 – 716.2 728.2 – 746.2 dynamic 12 GSM-750 750 777.2 – 792.2 747.2 – 762.2 438 – 511 T-GSM-810 810 806.2 – 821.2 851.2 – 866.2 dynamic 27 GSM-850 850 824.2 – 848.8 869.2 – 893.8 128 – 251 5 P-GSM-900 900 890.0 – 915.0 935.0 – 960.0 1 – 124 E-GSM-900 900 880.0 – 915.0 925.0 – 960.0 975 – 1023, 0 - 124 8 R-GSM-900 900 876.0 – 915.0 921.0 – 960.0 955 – 1023, 0 - 124 T-GSM-900 900 870.4 – 876.0 915.4 – 921.0 dynamic DCS-1800 1800 1710.2 – 1784.8 1805.2 – 1879.8 512 – 885 3 PCS-1900 1900 1850.2 – 1909.8 1930.2 – 1989.8 512 – 810 2
- bands 2 and 5 (shaded in blue) have been deployed in NAR and CALA (North American Region [Canada and the US], Caribbean and Latin America)
- bands 3 and 8 (shaded in yellow) have been deployed in EMEA and APAC (Europe, the Middle East and Africa, Asia-Pacific)
- all other bands have not seen any commercial deployments
- P-GSM, Standard or Primary GSM-900 Band
- E-GSM, Extended GSM-900 Band (includes Standard GSM-900 band)
- R-GSM, Railways GSM-900 Band (includes Standard and Extended GSM-900 band)
- T-GSM, Trunking-GSM
So we can see that these fall within the 880MHz to 915MHz Mobile to Base Uplink for the E-GSM-900 band.
This test will involve investigating the conducted emissions from a cheap (frome eBay) DC-DC converter module operating under reasonable load. In order to do a conducted emissions test I need to use what is called a Line Impedance Stabilisation Network (LISN).
From Wikipedia:
The main function of an LISN is to provide a precise impedance to the power input of the EUT, in order to get repeatable measurements of the EUT noise present at the LISN measurement port. This is important because the impedance of the power source and the impedance of the EUT effectively operate as a voltage divider. The impedance of the power source varies, depending on the geometry of the supply wiring behind it.
The anticipated inductance of the power line for the intended installation of the EUT also plays a role in identifying the correct type of LISN needed for testing. For example, a connection in a building will often use 50 µH inductor, whereas in automobile measurement standards a 5 µH inductor is used to emulate a shorter typical wire length.
Another important function of an LISN is to prevent the high-frequency noise of the power source from coupling in the system. A LISN functions as a low pass filter, which provides high impedance to the outside RF noise while allowing the low-frequency power to flow through to the EUT.
Typically, a spectrum analyzer or an EMI receiver is used to take the measurements during an EMC test. The input port of such an equipment is very sensitive and prone to damage if overloaded. A LISN provides a measurement port with, usually, 50 Ω output impedance. The stabilized impedance, the built-in low-pass filter function, and the DC rejection properties of the LISN measurement port makes it easy to couple the high frequency noise signal to the input of the measuring equipment.
Simplified schematic of a 5uH LISN:
The very simple circuit highlights the basic construction of a simple 5uH LISN which is intended for use with low voltage DC equipment up to 48V. Now, this circuit assumes ideal components, ignores parasitic capacitance and inductance, and has no protection circuitry to ensure the spectrum analyzer front end doesn't get overloaded. I'll cover this in more detail in a separate blog post but for now I will just say I will be basing my LISN on a design found on EEVBlog here: https://www.eevblog.com/forum/projects/5uh-lisn-for-spectrum-analyzer-emcemi-work/msg404662/#msg404662
Unfortunately I have not been able to get my PCB for this made yet so I will be coming back and revisiting this section to add the details of my setup and results once I have got this design completed.
This test will involve investigating the radiated emissions from a board. To achieve this I need to equip my FPC1000 with a set of near field probes. These probes are designed to be able to detect either magnetic (H) fields or electric (E) fields.
An H field probe works by having a shielded loop with the magnetic field passing through the loop and inducing an electric current. The larger the loop the more current is induced, the smaller the loop the more accurate the source of the magnetic field can be located. Usually you will start with a larger loop and "sniff" around the board for emissions to be detected on the spectrum analyser, then you change to a probe with a smaller loop to help narrow down the source.
An E field probe works by directly picking up an electric field present at a point on an EUT. For example the chassis of some equipment may have common mode voltage present on it and using an E field probe will help detect this.
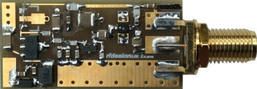
I designed a near field probe set specifically for this road test. I won't go into the design of these in depth here, they will be covered in a separate blog post once I have thoroughly validated and if necessary reworked. For now I will simply show you a few pictures of the probes!

I've created a set of 4 probes. Three H field probes with loop sizes of 20mm, 10mm, and 5mm, and one E field probe.
* * * TBD * * *
* * * TBD * * *
Staring with the positives, the hardware itself is pretty good, I like the form factor, the speed with which it boots, and the silence is bliss compared to most other equipment in my lab. It's got a nice size screen which is easily readable, relatively simple and well laid out controls, and It offers a good specification for a unit in its price range. I really do wish there was a tracking generator option. Its main direct competitor products from Siglent and Rigol both have tracking generator options and this is a useful function to have so it's a shame that with this unit there is no such option available. In order to compensate for this a little it's possible to use a wide-band noise source to test out the frequency response of a UUT (e.g. a filter) as demonstrated by gpolder in his road test of the FPC1000. Some possible options would be:
 | Noise Source Simple Spectrum External Generator Tracking Source SMA Modules SU
|
 | BBGen+ Ultra wideband. (*44 dB ENR = -70 dBm/MHz, so e.g. -90 dBm in 10 kHz bandwidth)
|
Price wise, the entry level base unit is very well priced and offers a pretty low cost of entry for this type of instrument. However, costs soon start to mount as you add in all the bandwidth upgrades and available options and a fully loaded instrument becomes slightly pricey in comparison to its competitors, but then it is a high end brand with the build quality and support that come with that so its understandable that the price would be higher than some of the competitive products. It would be nice if Rohde & Schwarz were offering an app bundle package with all the options at a discount price to bring it down, similar to what Keysight do with some of their oscilloscopes.
You've probably noticed I used the word disappointing quite a few times during this review. I was expecting a product from Rohde and Schwarz to be of exceptionally high quality in all aspects but for this unit, the available software let it down considerably in my testing. Hopefully these are all things that Rohde & Schwarz will be able to address with updates to their various software offerings and related websites. I'd also like to see much better support for macOS and Linux. It's 2018 and cross platform frameworks are readily available to build apps around these days and I suspect if the large test equipment manufacturers started to fully support these platforms with their offerings a lot of others would too and we end users would find ourselves with better choices for our development IT setups.
I also found a few bugs in the firmware of the instrument. Aside from the failure to store the Wifi credentials, and the incorrect display of the version number as highlighted in other reviews, I managed to cause the UI of the unit to lock up and become unresponsive when repeatedly downloading screen capture images using the RSCommander app when displaying a spectrogram. At this point RSCommander was unable to capture images from the instrument but interestingly the MobileView App was still fully functional and able to capture images. I was still able to display the trace window in RSCommander, just not the screen capture. When I returned to the instrument I found none of the UI buttons were responding and the display was frozen with an old image despite the fact I had been successfully altering the settings using MobileView and capturing other images. I had to press and hold the power button to shut it down.
If Rohde & Schwarz address the software concerns raised and fix the bugs in the firmware I'll be happy to check them out and update my review and scores accordingly. I feel that the main things that caused me to mark this instrument down are mostly things which a big manufacturer such as Rohde & Schwarz should have the resources to be able to easily resolve.
This concludes my Road Test Review of the Rohde & Schwarz FPC1000 Spectrum Analyzer. Thank you all for reading this review and thanks again to Element 14 and Rohde&Schwarz for choosing me for this Road Test. It has been an honour to receive this item and a pleasure to go through and do a comprehensive review of this equipment. Despite the criticism I have given it in certain aspects, as a basic spectrum analyzer it works very well and it's taking pride of place on my shelf right next to my oscilloscope and I will be making regular use of it.


