RoadTest: RoadTest the Advantech PCIE-1816
Author: ciorga
Creation date:
Evaluation Type: Independent Products
Did you receive all parts the manufacturer stated would be included in the package?: True
What other parts do you consider comparable to this product?: For measurements I compared the PCIE-1816 DAQ card with a Tektronix TBS 1202B-EDU oscilloscope.
What were the biggest problems encountered?: null
Detailed Review:
RoadTest the Advantech PCIE-1816 Outline:
Part 1 Installation of Advantech PCIE-1816 DAQ card and DAQNavi software, and “getting started” steps
Part 2 Signal measurements with Advantech PCIE-1816 DAQ card and DAQNavi software
Part 3 Signal Generation with Advantech PCIE-1816 DAQ card and DAQNavi software
Part 1 Installation of Advantech PCIE-1816 DAQ card and DAQNavi software, and “getting started” steps
What I am planning to cover in part 1: Product description, unpacking and exploring the contents, installing the Advantech PCIE-1816 DAQ card in the computer, installing the software, setting-up and configuring the DAQ card, testing the PCIE-1816 DAQ card using the testing utility supplied.
First I want to thank Element14 and Advantech for selecting me as one of the roadtesters for the Advantech PCIE-1816 DAQ card. I was happy when I received the package and I opened and explored the contents. Inside I found two boxes, one cable, and a memory stick.

One of the boxes contained the PCI-1816 DAQ card,

which came with an installation files and documents on a DVD.
The second box contained the ADAM-3968 low cost universal DIN-rail mounting screw terminal module with a 68-pin SCSI connector:

The bag contained a 68-pin SCSI-68 cable with part number PCL-10168H-1E printed on a label.

The 4 Gb memory stick contains the DAQ-Navi software for Windows and for Linux.
In the package I found also a registration card which has also information about extended warranty plans, 1-year, two-years, and 3-years.

Besides this card, I also found a startup manual for PCIE-1816/1816H DAQ cards:

I like that found on the inside pages a pin assignment table that I will post on the wall and which helps me as a quick reference for the location of the analog and digital signals, analog threshold trigger, digital trigger, scan and conversion clocks, analog outputs external reference, and digital counter controls.

The last page contains diagrams showing how to connect single-ended and differential analog inputs, analog outputs, and external conversion source.

The box included also stickers to be attached on the DAQ card bracket for easier identification in computers with multiple instruments installed.

I then continued with installing the PCIE-1816 DAQ card in my desktop computer. First I have identified an empty PCI-E slot and I removed the metallic tab that corresponded to that slot.

I then plugged the PCIE-1816 DAQ card in one of the PCIE slos:

I then closed the computer cover and I turned on the power.
Next I started the software installation by first inserting the DVD that came in the package, which took me to the driver installation screen:

Actually, both the driver and DAQNavi software are on this DVD, so I could choose to install only the driver or both the driver and DAQNavi. I decided to select “DAQNavi Windows All Products”, which took me to the installation of DAQNavi SDK, DAQNavi driver, Datalogger, Multimeter, and Updater.

Installation has started and a screen window showed me one by one all the software components that where installing.

This installation process took a while and I was happy in the end when I saw all the components with a green checkmark.

For first time users and people who need to learn how to use data acquisition cards there are multiple videos available on the DVD and which got installed with the software. These videos teach all the necessary skills needed to start using this PCIE-1816 DAQ card and to setup and perform advanced measurements and functions using multiple programming languages including C++, Visual Basic, and Matlab.

I then wanted to see if I installed correctly the PCIE-1816 DAQ card, and I started the Advantech Navigator from the startup menu. In the left side I found my PCIE-1816 DAQ card listed, and I also found a “Demo Device”, which is good to have in case anyone wants to explore the DAQNavi features before buying a DAQ card.
In my case I selected the PCIE-1816 card and on the right side screen I got a control panel with four waveform display graphs. There are five tabs at the top that select and configure each of the main functions of this card: Analog Inputs, Analog Outputs, Digital Inputs, Digital Outputs, and Counter.

I briefly went through these selections and configurations to make sure my the PCIE-1816 DAQ card is functions, and all my experiments proved that I have installed the card properly and that it functions correctly. Here is an example of the Analog Output panel:

Part 2 Signal measurements with Advantech PCIE-1816 DAQ card and DAQNavi software
This is the second part in a series of three covering my road test evaluation of Advantech PCIE-1816 DAQ card and DAQNavi software. In this part I am planning to cover signal measurements with the PCIE-1816 DAQ card and DAQNavi software.
After mounting the PCIE-1816 DAQ board in the computer and installing the DAQNavi software I started with a simple measurement of a DC voltage source. First I had to configure the inputs of the DAQ board, and I found quite useful the “PCIE1816_User_interface.pdf” document, in which I found “visual” diagrams showing how to connect signals to the DAQ board inputs, like the example below:

Based on this diagram I connected my voltage supply to AI0 at pin 68, and I used pin 60 for ground:

I then opened the DAQNavi input setup panel and I set the input voltage range on channel 0 to +/-10V:

I then setup 6V on a power supply and I connected a Fluke DMM also on the inputs into the DAQ board. My setup is shown in the picture below:

On the left side computer screen I kept the PCIE1816_User_interface.pdf document open and on the right side screen I opened DAQNavi program. This picture shows the Multimeter function of the DAQNavi software, which measures 6.076V. The Fluke DMM measures 6.073V, close to the DAQNavi Multimeter measurement.
I then used the DAQNavi transient graph window to display the 6V dc input signal, as shown in the screenshot below:

Notice the red trace in the upper graph that started from the left side and moved towards the right as more samples have been recorded. The built-in cursor function shows 5.9V, which is close to 6V considering also the visual approximation of me aligning that cursor with the signal trace.
After measuring this 6V dc signal I moved towards more advanced measurements. Next, I measured a sinusoidal signal from a function generator, as shown in the test bench picture below:

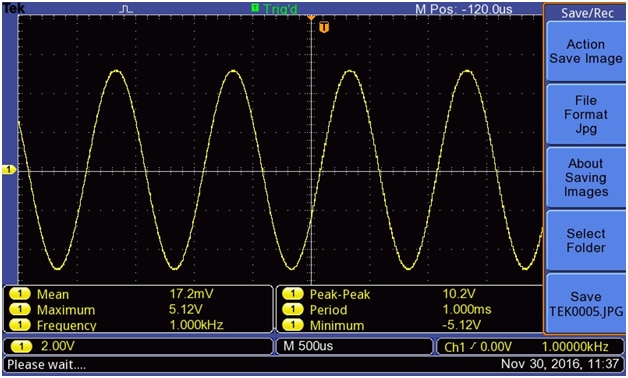
I have also used an oscilloscope to visualize the signal applied to the DAQ board. The signal displayed on the oscilloscope is shown in the picture below:

And the same signal measured with the Advantech 1816 DAQ board and DAQNavi software is shown in the picture below:

Comparing the DAQ card measured waveform with the oscilloscope waveform, the sinusoid period is 5 x-axis divisions of 100us/div on the DAQNavi graph, close to 497us on the oscilloscope. The low level is -3.18V on the DAQNavi graph close to 3.16V on the oscilloscope. The upper level is 3.18V on the DAQNavi graph, as shown below,

which was close to 3.20V on the oscilloscope.
I then increased the frequency to “push” into the Nyquist sampling rate. So the max sampling rate of the 1816DAQ card is 1Ms/s, so I increased the generator frequency to 500kHz. At this setting I ran into stability issues, since it looked like the generator could not keep a constant 500kHz frequency. By manual continuous adjustment I could temporarily maintain 500kHz, like in the screenshot below:

But most of the time I couldn’t, so my sampled waveform looked like this:

Next I evaluated external trigger functions of the Advantech 1816 DAQ card. Again, I found very useful the “PCIE1816_User_interface.pdf” document, which shows in simple to quickly understand the connections for external analog and digital trigger:

The rest of trigger settings I have done in DAQNavi settings panel, which uses a great graphical interface to quickly show how the trigger works and what each setting means. The panel for setting the digital trigger is shown in the screenshot below:

And for the analog trigger:

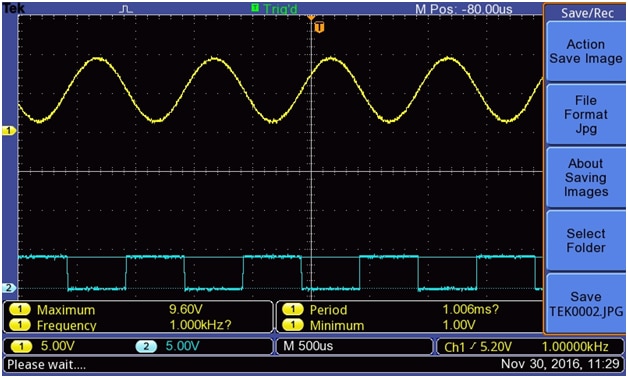
I have looked at various waveform frequencies and trigger settings; here is one example with digital trigger:

And the corresponding input signal (yellow) and trigger signal (blue):

After finishing the measurement of analog signals I looked into measuring digital signals. The DAQNavi software has a nice graphical interface for displaying the logic state at the digital inputs, and which has a pattern matching feature. In this experiment I toggled bit 0 of port 0, so the input pattern changed from 0xFF to 0xFE (hex representation). I opened the DAQNavi settings panel and I setup the pattern recognition to look for 0xFE pattern:

With these settings I then turned on my frequency generator and the DAQNavi software started to display how many matched patterns have been recorded:

Notice the “Event occurrence count” = 4 (and it kept going up as more bit toggling occurred).
Next I setup the 1816 DAQ board counter to measure the frequency of a digital input signal. The counter can perform various other measurements like: event counting, one shot, timer/pulse, pulse width. In this experiment I chose to measure the frequency of a signal provided by an external frequency generator.

Here is the DAQNavi measurement panel:

The measured frequency was 238Hz, and the same signal frequency measured with the oscilloscope was also 238kHz, as shown in the picture below:

Overall I was very impressed of the performance of measuring signals with the Advantech 1816 DAQ card and the easy to setup these measurements in DAQNavi software. The pdf user guide was very clear and of a significant help.
Part 3 Signal Generation with Advantech PCIE-1816 DAQ card and DAQNavi software
This is the third part in this series covering my road test evaluations of Advantech PCIE-1816 DAQ card and DAQNavi software. In this blog post I am planning to cover signal generation with the PCIE-1816 DAQ card and DAQNavi software.
In the previous two blogs I described how I installed the Advantech PCIE-1816 DAQ board in a computer and how I measured various signals with the 1816DAQ board and DAQNavi software. In this blog post I will show how I used the 1816DAQ board and the DAQNavi software to generate analog and digital signals.
I started by first setting up the voltage range of the analog outputs using the settings panel of the DAQNavi software program:

I have setup 0 – 10V voltage range on both channels, 10V reference, and 0V initial state. Next I opened the “PCIE1816_User_interface.pdf” document and I looked for instructions on how to connect the analog outputs. I like this document because it explains clearly and visually all I need to setup my test bench experiment:

I then connected an oscilloscope to the two analog outputs at pins 24 and 58. Here is a picture of my test bench setup:

I then setup sinusoidal signals at both channels using the DAQNavi waveform setup panel:

The sinusoidal signals were set to 1kHz frequency, 5V common mode, and 8V amplitude. I then clicked the “Start” button and I checked the generated waveforms on the oscilloscope:

The displayed waveforms show 8.6V amplitude, 5V common mode, and 0.998kHz frequency, close to the settings in the Advantech 1816DAQ board. Looking at the screen I see channel two sinusoid of 8V amplitude (based on 5V/div setting) and channel one sinusoid slightly higher amplitude, which is also measured with the built-in measurement functions.
Next I changed channel 1 of the Advantech 1816DAQ board to square wave signal, but I didn’t pay attention to the common mode, which remained to the 0V default. When I looked at the oscilloscope screen I noticed only 4V amplitude on the square wave signal instead of 8V:
I then realized my mistake, which was actually shown also in the graph window of the DAQNavi settings panel:

Notice the blue waveform chopped at 0V, so even though I setup 8V in the amplitude field the displayed waveform showed what signal will be generated. I then adjusted the common mode to 5V and the DAQNavi settings panel graph showed me the full 8V amplitude square wave:

The oscilloscope waveform matched the programmed one:

Next I changed the square wave into triangular waveform, also of 8V amplitude and 1kHz frequency:

The oscilloscope displayed these two waveforms as I was expected:

Following these experiments I focused on a single sinusoidal signal starting from 1kHz and gradually increasing the frequency until I reached the maximum that the DAQ board could generate. I have also set the voltage range to +/- 10V and the common mode to 0V.

I have tried to enter higher frequency values, but the DAQNavi panel always displayed the 30.303kHz, which is the maximum frequency that I could generate with this board. The waveform on the oscilloscope looked like an ideal sinusoid:
The measured amplitude and frequency came close to what I have programmed in the DAQNavi settings panel.
This waveform looked like a perfect sinusoid, but to further analyze the “quality” of this sinusoid I setup the oscilloscope to measure the FFT of this signal:

I was impressed of the quality of the generated sinusoidal signal. The fundamental frequency was measured as 30.3030kHz, which is exactly what I have programmed in the DAQNavi panel. There were no significant spurs and visually I could see that the phase noise is quite small compared to other oscillators that I have seen.
Next I switched to a square wave signal also of 30.303kHz frequency:

The oscilloscope displayed this waveform:

The measurements of frequency and amplitude were close to what I have programmed. The oscilloscope also measured the rise time and fall time. For 10.3V amplitude a rise time of 563.6ns (10%-90%) results in a slew rate of 14V/us, and similarly for falling edge 17V/us.
The FFT of this signal looked like an expected FFT of a square wave signal:

The fundamental is at 30.303kHz, exactly what I have programmed, and the harmonics are as expected for a square wave signal. I also wanted to check a triangular signal, and that FFT is shown in the picture below:

Next I generated digital signals. I first opened the “PCIE1816_User_interface.pdf” document, in which I looked for how to access the digital I/Os of the DAQ board:

So to generate digital signals I first had to configure the I/Os in output mode, and then I opened the digital output control panel in which I could toggle outputs by just clicking on corresponding buttons of the software panel. Here is the panel with all outputs set to 0V (logic “false” or low level):

The oscilloscope showed 0V level on D0 and D1 outputs:

Next I toggled D0 in the DAQNavi panel:

And the oscilloscope showed D0 signal going to 5V (logic “true” or high level). Next I toggled D1 also, so both D0 and D1 were generating 5V, and I checked again the oscilloscope waveform:

I have checked various other combinations and all performed as expected.
Based on all these experiments described in this blog post I was very impressed of the quality of signals generated with the Advantech 1816 DAQ card and the easiness to setup the parameters of signals in DAQNavi software.
This concludes my road test evaluation. As a conclusion, I am impressed with the performance of this PCIE-1816 DAQ card and I am happy that I had the opportunity to road test it.
Best Wishes,
Cosmin


