RoadTest: Portable Multi-Channel Recorder
Author: Instructorman
Creation date:
Evaluation Type: Test Equipment
Did you receive all parts the manufacturer stated would be included in the package?: True
What other parts do you consider comparable to this product?: Keysight DAQ970A Data Acquisition Sysytem
What were the biggest problems encountered?: User interface bugs. A lot of user interface bugs.
Detailed Review:
The B&K Precision DAS240-BAT Multi-Channel Recorder: Buggy user interface holds back a great tool with lots of capability.
This review is a summary of my impressions of the B&K Precision DAS240-BAT Multi-Channel Recorder. I put the DAS240-BAT to work while carrying out hardware upgrades to a small solar photo-voltaic (PV) system. Because I had recently completed a Road Test review for the Keysight DAQ970A, I was able to compare the two instruments in this use case. Data loggers, or multi-channel recorders, or data acquisition systems, are instruments that measure and record data from several inputs over time. They usually record relatively slow changing data sources over minutes, hours, or days. In the use case I discuss here, the fastest sample rate was 50 samples/s. The slowest sample rate was 1 sample/minute. Data loggers are not general purpose instruments like multimeters or oscilloscopes. They work best in cases where you need to record multiple slow changing signals over an extended period of time. In lieu of a proper data logger you could set up a group of multimeters, get a stop watch and sit down to manually record readings as the stopwatch marks off sample intervals. This compromise approach is error prone and very tedious.
The DAS240-BAT performed well as a data logger in the use case I describe here, however, bugs, sloppy menus, and awkward methods found in the user interface (UI) diminished my impression of this capable tool. A deep refresh of the UI to clean out bugs and weirdness will go a long way to improve this instrument in my opinion.
In my Road Test application I proposed to use the DAS240-BAT to help me understand the effects of a series of technical upgrades to an existing solar PV power system. I had previously road tested the Keysight DAQ970A data acquisition system for element14 so I proposed to compare the two instruments in this road test. A solar PV system generates the sort of signals suited to data logger capabilities. Voltages generated by photo-voltaic panels directly relate to incident solar radiation, which in turn relate to seasonal variation in daylight hours and daily variation in cloud cover. Changes in incident solar radiation change over day, hour, minute, or second time scales. Slow changing voltages are easily handled by data loggers. Battery voltage in a solar PV system is related to battery condition and moment to moment charge and discharge conditions. The particular solar PV system examined in this road test is located in an unheated garden shed at 53 degrees North latitude in Canada. Tests for this review were conducted in the cold winter months of January and February.
To understand the effects of upgrading various components in the PV system I wanted to run data logs on system performance before and after each component upgrade, thus my interest in a data logging instrument like the B&K Precision DAS240-BAT. For this review I used the DAS240-BAT, and a Keysight DAQ970A to make records of three parameters: PV panel voltage, 12 VDC battery voltage, and ambient system temperature. The illustrations below show the starting and planned ending state of the PV system. The upgrades are occurring as money and time become available. It is winter in Canada so there is a lot of snow on the roof of the garden shed and it is often really cold outside. I have to submit this review by early March so not all of the upgrades will be included in this review. Some of the more extensive upgrades will be performed in the spring.

All of hardware components for the upgrade have been purchased. I am installing the new hardware in phases and using the data logger instruments to evaluate the changes each upgrade makes to the system. This review of the DAS240-BAT occured during implementation of the following system upgrades:
The switch from a Pulse Width Modulated (PWM) charge controller to a Maximum Power Point Transfer (MPPT) charge controller is a more involved upgrade as this step will also involve addition of circuit protection devices, upgrades to rugged quick connectors and rewiring many of the existing loads from the AC bus to a new DC bus. I expect to complete these upgrades in the spring of 2020.
This is a comparison review of the B&K Precision and Keysight logging instruments and not a project blog, so the remainder of the review focuses on comparing how these similar tools performed in this particular use case. I discovered interesting characteristics of the DAS240-BAT and the DAQ970A during the upgrading processes. Neither data logger was perfectly suited to the work I conducted. Each instrument demonstrated strong capability in specific areas and each instrument fell short of expectation in other areas. When evaluated in the context of this specific use case, the B&K Precision DAS240-BAT logger has an edge over the Keysight DAQ970A. However, the firmware in the Keysight instrument is much less buggy than the firmware in the B&K product.
The existing PV system provides power to a few electrical loads including a WiFi camera, a switched 5 W LED light and a power bar where various garden tool battery packs are charged in the non-winter months. A conduit with two multi-conductor cables runs underground between the shed and the house on the property. This arrangement allows data logging to occur in a climate controlled workroom rather than in the unheated shed.
I will take you along on my journey as I used the DAS240-BAT in conjunction with the DAQ970A to gather and analyze data logs during the upgrade project over the last couple of months. I'll discuss several user level experiences with each instrument and indicate my thoughts on which instrument performed better in specific situations.
Structure of the comparisons
I will discuss use of teach logger at various stages as I applied them to the use case described above. The following operational stages are detailed for both instruments:
After examining the performance in each of the five scenarios I will state my preference of one instrument over the other and explain my reasoning.
1. Signal Connection to Input Channels
Unlike multimeters that typically measure one signal at a time, data loggers are meant to gather information from multiple inputs over time. The need to bring multiple inputs into the logger poses a challenge to the instrument designer: how best to provide connections for multiple signals. This challenge can be further complicated if the instrument is intended for field use, as is the case for the DAS240-BAT. The DAS240-BAT and the DAQ970A use similar signal connection methods, but with important differences. The differences in connection methods highlight the bench v. portable design approaches of the two instruments. The Keysight approach is more applicable to a bench set up and the B&K approach works in both a bench and portable set up.
Keysight DAQ970A Signal connection method
The Keysight DAQ970A uses removable multiplexer modules that fit into slots at the back of the chassis. The unit I road tested previously for element14 came with DAQM901A 20 channel armature multiplexer. Signal wires are routed through an opening in the back of the module to screw terminals situated between two banks of relays on the surface of the modules PCB. The images below illustrate signal connection to the DAQM901A module. In this illustration three thermocouples and four two-wire signals (bundled in a single CAT5 cable) are routed to the terminal blocks. In this example, 7 of the available 20 channel inputs are used and the routing path out the back is already getting crowded.
To add, remove, or preposition a signal, the logger is powered down, then the module is removed from the back of the chassis, and the transparent cover lifted. Signal wires can then be adjusted and repacked for exit out the rear of the multiplexer module. Although this process is not difficult to perform, it is tedious. For this instrument it is best to plan your data logging signal requirements carefully in advance to avoid having to repeat the connection set up process.
| {gallery} DAQ970A signal connection |
|---|
Signal connections to the DAQM901A 20 channel armature multiplexer: The module is removed from the DAQ970A chassis, then sensors or signal wires are routed to screw terminals |
Multiplexer module with signal connections installed in DAQ970A chassis: Once signals have been routed to the screw terminals, the module cover is replaced and module is inserted into an open slot in the back of the chassis. |
B&K Precision DAS240-BAT signal connection method
The DAS240-BAT also uses a screw terminal connection architecture, but with externally situated modules connected to the logger through a short cable. The logger came with a single 20 channel connection module. The module can be easily connected to additional modules to increase the number of input channels. The DAS240-BAT came with a package of 20 three wire (+, -, and GND) screw terminals that push into the channel input slots in the external module. The user simply pushes a screw terminal adapter into an open channel slot on the external module then secures the input signal wires with the provided screwdriver. The Keysight DAQ970A also came with a courtesy screwdriver for the same purpose.
| {gallery} Signal connection to the DAS240-BAT |
|---|
The DAS240-BAT external signal connection module: Showing four signal connections and the interface cable leading to the logger instrument |
DAS240-BAT signal connection module: Close up view |
Bag of screw terminal adapters: Includes 20 adapters and a screwdriver |
|
My preference: B&K Precision DAS240-BAT
The ease of signal connection and especially of signal reconfiguration made possible by having an external connection module gives the DAS240-BAT an edge over the DAQ970A in my opinion. The interface cable between the signal connection module and the logger instrument is not very long, but extensions are available. Adding additional 20 channel modules appears to be very straightforward. Moving input signals from one channel to another is a simple matter of pulling out the screw terminal adapter (with wires still attached) and moving the adapter to another open channel.
2. General Instrument Set Up
Let's go through the steps necessary to set up example logging missions on each instrument. The objective will be to capture PV panel voltage and 12 VDC battery voltage under conditions that cause the PWM charge controller to switch in and out of charge mode. When the battery is at or near full charge and the PV panels are under bright sunlight the PWM charge controller will switch in and out of charge mode to maintain peak charge in the battery. Depending on state of charge and load on the battery the charge controller may drive charge into the battery for several seconds, or for only a few 100 ms. During these logging missions the system was powering a 1000 W pure sine inverter and, in turn, the inverter was powering a WiFi camera. As mentioned I also set up two PT100 RTD temperature sensors to record ambient temperature in the area around the battery, inverter, controller, and panels.
The B&K Precision instrument is well suited to capture high resolution signal logs over long time periods. It has a huge built-in 30 GB memory and sample intervals can be set as low as 1 ms. Later on I will share a data log that I ran for a full week with a 100 ms sample interval on three channels (that amounts to 6,048,000 samples/channel). The Keysight instrument equipped with the DAQM901A relay switch module has a couple of limitations that need to be considered. First, because relays are mechanical devices they need time to switch. This puts a lower limit on sample interval. I found that combining a 0.02 Power Line Crossings (PLC) integration time (about 333 microseconds at 60 Hz power line frequency) with an Auto interval selection caused the relays to chatter away at an alarming rate, but the system did not seem capable of keeping up with this rate for very long as gaps appeared in the record after a few seconds. For the comparison below I settled on an integration time of 1 PLC and a 1 second sample interval. The second limitation to be aware of is that relays wear out. Every relay in the DAQM901A module is tracked by the operating system and a running count of relay cycles is accessible through the menu system. Operating the relays in short interval cycles for a long time will wear them out. Therefore, the DAQ970A with a DAQM901A multiplexer is not ideal for running long duration logs with short sample intervals.
B&K DAS240-BAT Entering an IP address
In addition to connecting the three signals that will be logged to the signal input module I also connected the DAS240-BAT to a Windows 10 PC with a CAT-5 Ethernet cable to permit uploading and viewing of log files. Here is where I ran into my first frustration with the DAS240-BAT user interface. On my laptop I started DasLab, the very spartan software available from Sefram that communicates and controls the DAS240-BAT. The Daslab Connection menu brings up a prompt to enter the IP address of the instrument. With DHCP configured on the DAS240-BAT, it had acquired an IP address of 169.254.72.176 from my local network.

Thinking it would be easy to enter this IP address by simply typing it, I began typing: 1-6-9 (cursor moves to next triplet - good), 2-5-4 (good), 7-2. . . huh? It didn't take the 7, but it did take the 2. So I backspace and try 0-7-2. Okay it likes that. Then I finish off with 1-7-6 and hit enter. It tries to connect for a few seconds then comes back with "Connection Error". Okay. Try a different approach. This time I try 1-6-9 2-5-4 then "space" then 7-2. Nope. Only takes the 2. Try again. How about 1-6-9 2-5-4 then right cursor then 7-2. Ah ha! It takes the 7 and the 2! Finish off with 1-7-6, return, and victory! Connection established. This description compresses the actual time it took me to figure out how to enter 72 in the third triplet. In reality I pondered and experimented for probably 5 minutes before figuring out how on Earth to enter my IP address so DasLab would take it. From my perspective, the way DasLab expects IP addresses to be entered is not intuitive. User interfaces should, above all, be intuitive and dead easy to use. A user interface should never oblige a user to figure out what the UI designer thought would be the best way to enter data. This data entry oddity became the first on a growing list of UI glitches, oddities, and annoyances that caused me to knock points of my rating for this otherwise very capable instrument.
Keysight DAQ970A Entering an IP address
Don't need to enter an IP address. The Keysight instrument uses DHCP to get an IP address, then when BenchVue is started, it automatically (usually) enumerates all of the instruments on the network and places them in a graphical image list on the right side of the screen. Example below.

My preference: Keysight DAQ970A
Having the desktop application auto-enumerate all instruments on the network, including my Tektronix oscilloscope, and the B&K logger, is a great convenience. This is a feature B&K should consider adding to DasLab.
3. Channel Configuration
In this use case there are three channels to configure: PV panel voltage, Battery voltage, and ambient temperature. Both loggers will take readings from all three. The voltage signals can be fed in parallel to inputs on the two instruments because the inputs are high impedance and even in parallel, they do not present much of load to the sources. A single RTD sensor can not easily be shared by the two loggers. An RTD changes resistance in response to temperature changes. Measuring resistance entails driving a current through the device, so there would be much confusion if the two loggers drove current simultaneously through a single RTD sensor. The solution I settled on was to use two independent but closely situated RTD sensors, each connected to its own wire pair running back to the lab. The mapping of signals from the PV system to the channels on the loggers is shown in the table below.
| Measurement | B&K Precision DAS240-BAT channel | Keysight DAQ970A channel |
|---|---|---|
| PV panel voltage | A8 | 106 |
| 12 VDC battery voltage | A9 | 107 |
| PT100 RTD ambient temperature | A10 | 104 |
Since the PT100 sensor set up is more involved, I will provide detailed comparison of the process to set up this senor on each instrument.
B&K DAS240-BAT
The PT100 RTD sensor presents a resistance of 100 Ohms at 0 degrees C. The copper cable running from the sensors to the data loggers is about 80 feet (24 m) long. Copper wire has a small but measurable resistance. Over an 80 foot run the resistance is enough to add a significant offset to the measured RTD device resistance. This cable resistance needs to be measured and compensated out of the data logger measurements to obtain accurate temperature readings. To measure the cable resistance I used a shorting bar in the shed and an ohmmeter in the lab. The measured cable resistance for both runs was about 4.70 Ohms. The 5k thermistor mounted below the PT100 RTD was not used in the experiments described here.


To provide something of a temperature reference for the RTDs, I placed a wireless temperature sensor near the RTDs. The receiver was located in my lab next to the loggers. The wireless sensor only provides integer resolution (no decimal digits), but it gave me a reference when compensating for the wire resistance between the logger inputs and the RTDs. My plan was to enter the measured wire resistance, then adjust to get the value computed by the loggers to agree with the wireless sensor. This worked well for the DAQ970A, but the resulting compensation value for the DAS240-BAT ended up well off of the measured 4.70 Ohm value shown above.
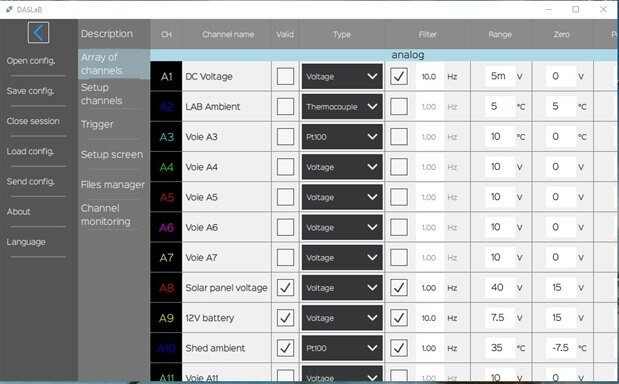
To set up input channels on the DAS240-BAT, the Channels icon is tapped form the Home screen, which brings up the rather busy screen below. The three channels of interest are A8, A9, and A10 detailed in the three columns toward the right side of the screen.

A very nice feature of the B&K DAS240-BAT is the ability to connect a standard USB keyboard to one of the two USB ports along the top edge of the instrument and use the keyboard to enter text or numeric values for menu fields. It may seem minor, but I think this is pretty much a must have feature on modern test equipment. The scroll and select menu keyboards that are provided on other tools are error prone and tedious to use at the best of times. Also, you can connect a standard USB mouse to the DAS240-BAT and use it to control the cursor on the instrument screen. Because there are two USB ports on the DAS240-BAT, you can connect a mouse and a keyboard at the same time. I am giddy with delight!
There are a couple of oddities and annoyances in the channel set up menu. First, you can perform screen captures of some, but not all, screen images. The camera icon next to the record button is not always available. For example, when I click on the Type field under A10, a sub menu appears, but I can't screen capture from the DAS240-BAT screen because the capture button is disabled for sub menus. One work around it to make use of a Virtual Network Connection (VNC) which enables remote desktop use of the DAS240-BAT from a PC. You need VNC software running on your PC to accomplish this. I used Ultra VNC (uVNC) available as a free download under the GNU General Public License. The UltraVNC Viewer application simply requires entry of the IP address for the DAS240-BAT on your network, followed by entry of the VNC password (set up in the DAS240-BAT under the VNC menu button).
The gallery below shows the sub menus selected to set channel A10 for connection to a PT100 2 wire RTD. The last set up menu is for entering the wire resistance for long cable runs. I entered 4.70 Ohms, based on the measured cable resistance. This resulted in a significant error between the wireless temperature sensor value and the value reported by the other RTD connected to the Keysight logger. I made adjustments until all three values were in agreement and ended up with a wire resistance value of 1.65 Ohms. Odd, but, whatever, it works.
I will report a minor annoyance here: The wire resistance sub menu is titled in French (Resistance du fil), even though the instrument is configured for English. I figured out what the menu was for, however, there are other examples where a clean conversion to English has not been accomplished (example: channels are labelled "Voie" in the set up table). I am not a language elitist, but these scattered bits of French in an English configuration show sloppiness in the Quality Assurance department. This sloppiness impacts customer opinion of brand quality.
| {gallery} DAS240-BAT RTD submenus |
|---|
Channel Type sub menu: Selecting the type of sensor/signal |
Channel Type sub menu: PT100 details |
Channel Type sub menu: Adding a wire resistance value |
Now to a more series bug. The VNC connection only works properly for setting up some of the channel parameters. I had success in using the VNC to select a 2 wire PT100 sensor and entering a wire resistance value. However, I could not get the VNC interface to work properly when trying set a temperature range, Center zero, Max or Min value. The remote connection provided the correct screen images and I could enter values at the PC, but any changes I made were ignored once I hit the green check mark icon. This is also true when trying set range, min, max, and center zero for the two voltage channels. Very frustrating.
I resorted to local entry of range, center, min, and max on the DAS240-BAT touch screen. I noticed that there is interaction between the parameters that is important to be aware of. Setting a range of say 30 degrees C will automatically set the Max and Min temperatures based on the Center zero setting. In another scenario, setting a Max temperature will then set Range and Center zero based on the existing Min setting. Something to be aware of. I ended up wishing there was an auto range setting because I was dealing with wild temperature swings from -30 C to +10 C in the span of a couple of weeks of logging. If I set the range too wide I would not be able to see some of the smaller micro-climatic shifts, so I had to frequently adjust the range when temperatures went outside the fixed range settings. For the experiments discussed here I chose a range of 30 C, Max of +10 C, and a Min of -20 C.
Keysight DAQ970A
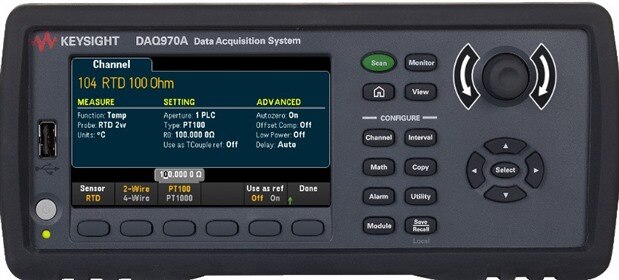
Setting up a PT100 RTD sensor on the DAQ970A is slightly more time consuming when compared with the set up time on the DAS240-BAT. The DAQ970A has a smaller, non touch sensitive screen, and it does not support external USB keyboard input. The smaller screen means several separate set up screens have to be accessed to configure a handful of parameters. Use of a scroll and select technology for text entry slows things down during the channel set up process. The set up steps for a PT100 RTD are summarized here and in a photo gallery below.
Setting up an offset that will get the measured value to agree with the remote sensor reading involves using the rotary knob on the front panel and the cursor movement keys and a bit of iteration between the offset entry screen and the Monitor screen. I eventually got agreement with an offset value of -14.78 degrees C.
| {gallery} Setting up an RTD on the DAQ970A |
|---|
Staring point for configuring a channel: Measure mode is OFF. This image shows the Channel label after it has been keyed in |
Entering a Channel Label: Must use cursor keys and Select button to enter alphanumeric text |
Select measurement type: TEMP has been selected from the available choices |
Select sensor details: RTD is set as the sensor type, then PT100 and 2-wire connection |
Use Math to configure offset: Enter an offset to compensate for wire resistance |
My preference: B&K Precision DAS240-BAT
Although the Keysight instrument supports a greater variety of configuration options than the B&K instrument, set up is quicker on the B&K instrument because the user interface uses a large touch screen and it supports external full size keyboards and mice. The large screen allows multiple parameters to be set up from a single view. Touch input and keyboard support allow time saving direct entry of alphanumeric values.
4. Collecting and Viewing Data Locally
There are two ways to work with these logging instruments. The user can collect and view data locally on the instrument, or make a remote connection to the instrument through a LAN and operate and view data on a PC.
In this section I look at operating the instrument locally.
B&K DAS240-BAT
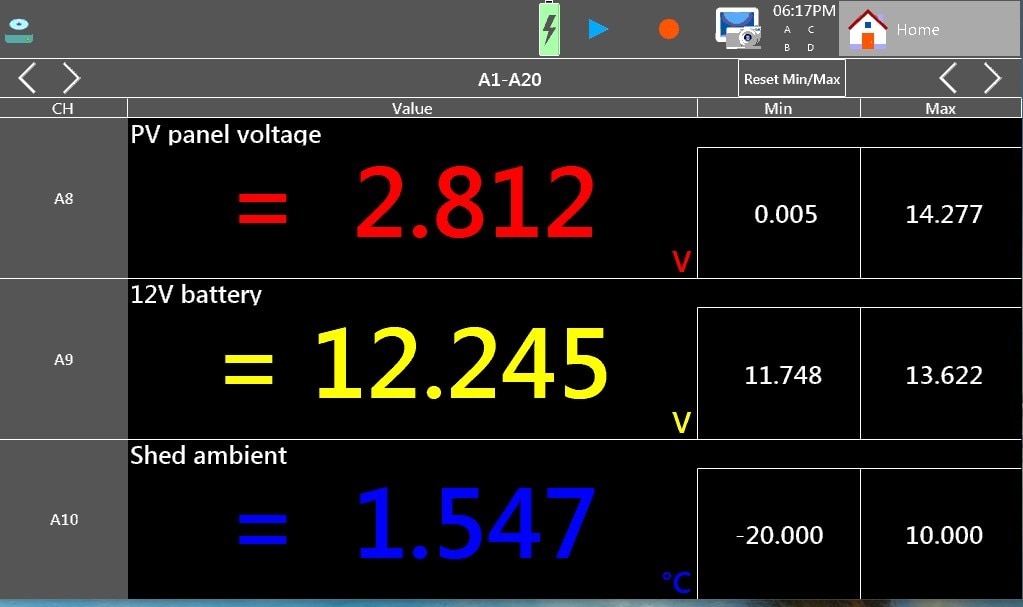
Once the channel parameters are set up and the desired channels selected for viewing or logging, the user has the option of making the logger behave like a strip chart recorder (via the F(t) option), or getting a live numeric update of selected channels (via the Numeric option). An example of the Numeric mode display is shown below. This screen shot was taken near sunset, so the PV panel voltage is dropping rapidly toward zero. The Min and Max numbers appear to be correct for PV panel voltage and 12V battery voltage, however, the Min and Max values for Shed ambient temperature appear to from the values I setup during channel configuration. A strong plus working in favor of the B&K instrument is the expansive touchscreen. Look at the size of those readouts!
I have been using the DAQ970A for two months now. The F(t) mode behaves like an adjustable graphical strip chart recorder and is very useful, but it has a few bugs. One example is seen in the screen capture below. The image shows a data log stored locally in the instrument captured over a full week at a sample interval of 100 ms/sample. The ability to store a weeks worth of data at this sample rate is outstanding. I could have logged for longer at an even higher sample rate without reaching the limit of this instruments capability. In terms of memory depth and range of sample interval, I am very impressed, however, code sloppiness in the user interface is apparent. Look at the cursors on the Shed Ambient trace (blue trace). The availability of cursors is great, but temperature ranges should be labeled as delta T, not delta V. Oh, and the font size on the vertical axis labels is . . . well, to my eyes, nearly unreadable.

To illustrate the impressive density of data that is included in the example log shown above, I used the "Zoom between cursors" feature to isolate four of the PWM charge controller pulses from the fourth day of the log. In the image above, the red trace shows PV panel voltage over time. Each pulse represents one day of sunlight generated voltage. Once the sun rises, panel voltage increases quite rapidly, and as the sun sets, panel voltage rapidly decreases. On clear days when the sun is unobstructed and the incident angle is approaching perpendicular, the PWM controller can enter a mode where current from the panels charges the battery until a maximum cutout voltage is reached, causing the controller to disconnect the panels. The battery then feeds charge into the loads and battery voltage decreases as the stored energy is depleted. Once a lower voltage threshold is reached the controller reconnects the panels to the battery. This charge controller behavior creates the voltage spikes riding on top of some of the pulses seen in the top trace. Because the sample interval is 100 ms/sample, it is possible to zoom in to a group of individual charge cycle pulses, or even on a single pulse out of hundreds of pulses in the 7 day record. The screen capture from the DAS240-BAT front panel shown below illustrates this zoom in capability.


Without too much fuss I was able to zoom into a group of four charge/discharge pulses on the fourth day of the record. This particular zoom went from a 7 day view covering 604,800 seconds to a view covering about 20 seconds. B&K provide a wide choice of tools to interact with data log records. To achieve the image shown above I first used the touch screen on the DAS240-BAT to position time cursors on the PV panel voltage trace, then zoomed between cursors repeatedly until I had the four pulses in view. I then used UltraVNC viewer running on my laptop to control the DAS240-BAT with my laptop mouse. I switched the cursor to horizontal mode on the battery voltage trace, then dragged them to the peaks. The delta V calculation readout was obscured by the trace, so I dragged it over to make it readable. The only issue I encountered was a flaw with the VNC interface that does not allow numeric values to be entered from the desktop using the mouse to control the virtual numeric keypad. To enter new range position values (to enlarge the relatively smaller delta V range) I had to use the touch screen on the DAS240-BAT. In the Remote Instrument Operation section I show how the Sefram Viewer application can be used to explore this same data set on the laptop.
Keysight DAQ970A
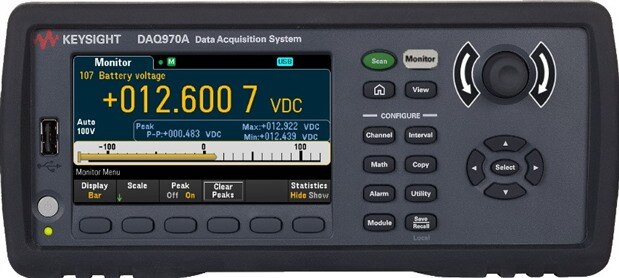
Local viewing of multiple data streams is limited on the Keysight DAQ970A. Options include a text listing of the last sweep values, or individual channel histograms, trend charts, or DMM style numeric displays. Each option is illustrated below. What is missing, perhaps as a consequence of the small screen, is the ability to look at trend charts for several channels simultaneously on the same screen. As shown in the screen captures for the DAS240-BAT the ability to examine multiple channels together on one screen supports easy comparison of relationships between system signals.
I have run trend charts on the DAQ970A that last for several days. The auto scale feature on this instrument is very helpful in that the scale adjusts as values move outside of the current display range. The B&K instrument does not seem to have this option. The Keysight instrument also allows the trend chart time scale to be flipped between "All" and "Recent". The "All" setting graphs the entire accumulated data record on the screen. "Recent" shows only the most recently gathered values over a period selected by the user. The B&K instrument allows fixed time intervals to be set on the trend chart from 100 ms/div to 20 min/div. With 10 divisions across the screen, this allows viewing the most recent 1 second to 200 minutes of signal activity. Longer time periods, like the week long record shown above can be brought up on the screen locally once a data logging mission has been completed.
| {gallery} Keysight local data collecting and viewing |
|---|
List view of scan memory: Shows the time stamp and value from the most recent scan of selected input channels. |
Number display mode: Note that only one channel value can be displayed at one time |
Bar display mode: Adds a bar scale with option to display Min, Max, and P-P values on a single channel |
Histogram display: This display mode is not available on the B&K DAS240-BAT |
Display Trend (All) mode: Allows the entire accumulated data record from a single channel to be displayed on one screen. The elapsed time value can be incorrect if a long integration time is selected. |
Display Trend (Recent) mode: Shows only the most recent samples from a user selected time frame. Here the last minute of data collection is graphed. |
My preference: B&K Precision DAS240-BAT
The flexibility and richness of visualization options are superior on the B&K DAS240-BAT. I really appreciate the ability to graph multiple signals on the same screen. The only drawback to the DAS240-BAT trend chart feature is the inability to show a full history of all collected samples during data collection (if the history extends beyond 200 minutes). This feature is available in the Keysight instrument.
The strip chart (F(t)) feature on the B&K instrument is a little buggy, however. Sometimes, when switching from strip chart mode, to numeric mode, then back to strip chart mode, random discontinuities appear in the strip chart. An example is shown below. The images below capture a sequence of display mode switches. The time base is 20 min/div and the logger has been running overnight. The red trace (PV votage) is seen rising on the left with sunrise. It flattens when panel voltage exceeds battery voltage by about one diode drop. The odd and sudden drop to 0V near the right end of the trace appeared in the trace when I switched from F(t) mode to Numeric mode and back to F(t) mode. The center image shows a subsequent switch from F(t) mode to Numeric mode. The right image shows new discontinuities added near the left side of the traces when a switch is made back t F(t) mode. These discontinuities are not real. They appear in the traces after switching into and out of Numeric display mode while the instrument is accumulating samples, but they are not recorded in the data logs.


5. Remote Instrument Operation
Both loggers support remote instrument control and data record upload over an Ethernet LAN connection. The interfaces differ quite a bit, however, and each vendor's approach offers benefits and drawbacks. This section looks at remote operation and data upload methods available in each instrument.
B&K DAS240-BAT
The easiest way I found to remotely operate the DAS240-BAT was via a Virtual Network Connection (VNC). This approach allows the user to operate the DAS240-BAT from a PC through a screen mirroring technique. VNC software needs to be running on the PC to enable this capability. As mentioned earlier, I used UltraVNC, an open source free downloadable package from uvnc.com. UltraVNC uses Remote Frame Buffer protocol to mirror the remote instrument screen. You can operate menu buttons on the DAS240-BAT using your PC mouse. The screen update rate is good and I did not encounter any latency issues in instrument operation. However, as mentioned previously in this review, keyboard data entry did not work at all for me using UltraVNC. I assume there is a bug in the DAS240-BAT that prevents keyboard data entry.
In general, anything you can accomplish locally on the DAS240-BAT, you can accomplish remotely using a VNC connection. However, to upload data files for analysis on a PC B&K would like you to use DasLab and Sefram Viewer. Both are available as free downloads from B&K Precision's website. These programs are fairly bare-bones, and a little quirky, but they get the job done. The DasLab opening screen is very spartan. You have two choices: Launch Pilot or launch Viewer. Either choice is a one-way trip; you will not be coming back to this view once you make a choice.

If we make the choice to open Pilot, we are taken to the following screen.

I discovered through experimentation that the best way to re-establish a connection to the DAS240-BAT was to click on the IP address under "Recents configurations/connexions", which almost immediately establishes a connection and brings up the screen below.

From here you can configure channels, set up triggers and monitor channel values. These are all things that can be accomplished with the VNC connection, but here they are done with a different user interface. One advantage to using this interface versus the VNC connection to set up channels is that alphanumeric values entered in DasLab work correctly. Once a configuration is set up, the entire configuration is sent successfully to the DAS240-BAT when "Send Config." is selected from the drop down menu on the left. However, there is no indication on the PC that the send was successful. I only knew it worked when I checked for updated configuration settings on the screen of the DAS240-BAT. The function I use most from this screen is the Files Manager. From here I can select data records to be uploaded to the PC. One issue with this feature is that it has not been programmed to remember destination file selection. Every time I start up DasLab I have to re-select the destination file I am using for uploads.
Once a log file has been uploaded to the PC (or Downloaded according to the Sefram Viewer terminology), Sefram Viewer can be used to open it for graphical viewing and analysis. The user interface for Sefram Viewer needs work in my opinion. The built in help is of limited use and good portions of it are only available in French. I was able to figure out what most of the functions did through experimentation, but it would be better to have a clean, well supported, standardized UI to make this tool really useful. The image below shows the full 7 day log that I examined earlier in the review.

There is a lot of data in the image above, presented in a clean, readable, and easy to comprehend format. The sample interval for this mission was 100 ms/sample/channel. The mission ran for a full 7 days from midnight on February 1 to midnight on February 7. This means the file contains 6,048,000 samples per channel. With a fair bit of trial and error I was able get some calculations and cursors to appear on the graph. The UI does not respond in a way that is intuitive to me. Learning to use the cursor and calculation features felt like an exercise in adapting my normal thinking to that of a mysterious coding team somewhere in France (I assume). I managed to do this, but I am put off by the necessity of taking this journey in order accomplish tasks that other UIs make easy and obvious. Once I figured out how to make the cursor and calculations features work, they did provide nice insights into the data set. On the graph below, Min and Max values have been automatically positioned on the 12 V battery chart and on the ambient temperature chart, along with a Max voltage marker for the PV panel voltage. Vertical cursors on the PV panel voltage are set up around the sunlight hours on the 4th day. I will use the Zoom Between Cursors icon to examine the charge activity on the 4th day in more detail.

After zooming between cursors, the chart changes to the image shown below. The Min and Max calculations have been updated to the new view, now isolated to day 4 of the log. The cursors, however, have mysteriously kept the same relative separation as on the full 7 day log and now are positioned over a disassociated 44 minute window. Oh well, let's zoom in further to examine what is happening during individual charge cycles.

In the image below I have zoomed in to show a duration of about 3 minutes shortly after solar meridian on February 4 (solar meridian occurred at 12:47 PM on the 4th in my city). There are 33 charge cycles in this window. The battery load remained nominally constant over the 3 minute window, but duration of charge cycles is variable. My working theory is that the variation in charge cycle duration is a result of changes in solar radiation intensity on the PV panels. this theory is supported by the observation that the discharge portion of the cycles remains approximately constant, but the charge portion is variable, suggesting that the amount of current from the panels changed, which in turn suggests a change in incident solar radiation. I've moved the cursors around to get some measurements on panel and battery behavior at about 12:55:20 PM. The sky was generally clear on this day and the Sun was near its peak altitude in the sky (about 20 degrees). Under these solar radiance conditions and with the loads and charge state of the battery we can see that a charge cycle took 6.298 s. The cycle was composed of a discharge phase where the charge controller allowed battery voltage to drop from about 14.27 V to 13.88 V. The controller then connected the panels to the battery and a charge phase occurred where battery voltage increased again to about 14.27 V.
I plan on running this log again on a similar sunny day, but with the second PV panel disconnected. The two panels are currently connected in parallel to boost available charge current. I expert the slope of the charge portion of each charge cycle to decrease if only one panel is generating charge current. Less available charge current means it should take longer to reach the cut out voltage on the battery.

Although the Sefram Viewer UI is awkward and quirky, I was able to use it to get the information I needed out of data logs gathered by the DAS240-BAT. With a few badly needed modifications I think Sefram Viewer could be a highly capable tool for performing the sort of data analysis I am looking to do during this solar upgrade project. Now on to the same sort of upload and analysis using the Keysight DAQ970A and the BenchVue and LXI Web UI tools.
Keysight DAQ970A (BenchVue and LXI Web UI)
Keysight provides a really slick LXI Web UI that supports remote instrument control, just like the remote instrument control that UltraVNC provides for the B&K DAS240-BAT. The differences I notice in the Keysight Web UI are the top notch graphics and menus, the fully functional interface, and (so far) blissfully bug free operation that makes sense to me. If you want to operate the instrument remotely from a realistic front panel proxy, the LXI Web UI, illustrated below, is recommended. Simply use mouse clicks to operate front panel buttons, or turn the rotary knob left or right. Commands are sent to the instrument and changes to the screen are reflected on the Web UI on your PC.
Because the Web UI mimics the DAQ970A front panel it suffers from the same limitations imposed by a relatively small screen on the instrument itself. If you are trying to set up several channels for a complex data logging mission, I recommend using the BenchVue platform instead. BenchVue is a beast of a platform. It provides a lot of capability across many Keysight instruments and it can be difficult to master. I also found it agonizingly slow to load until recently. I ran a registry cleaner app that removed a bunch of broken links and put a bunch of apps to sleep, including National Instruments software that was slowing start up down considerably.

If you need to set up multiple sensors, configure test sequences involving several instruments, or have a need to upload and analyze data logs, then BenchVue might be a good choice. Once BenchVue starts and enumerates the instrument array connected via USB or LAN, the user has the option to launch specific instrument applications or to bring up recorded logs for analysis. The channel set up screen for the DAQ970A allows all channels to be configured via a table array, very similar to the arrangement provided on the DAS240-BAT.
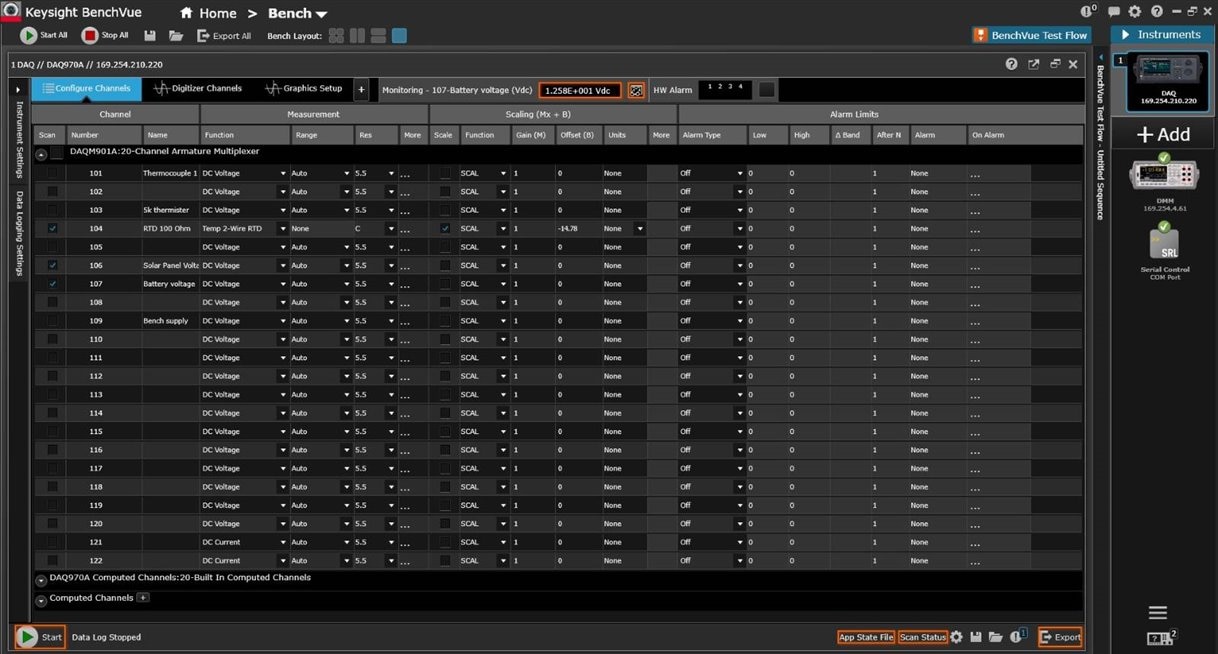
Sample interval is set up under a separate menu. For the data log shown below, I configured the two voltage channels with integration times of 1 power line crossing and the temperature sensor was integrating for 10 power line crossings. Limitations on sample interval range at the lower end are where the DAQ970A with a relay multiplexer module comes up short. I found that sample intervals under about 500 ms become problematic. Relays in the multiplexer have a difficult time keeping up with short sample intervals. Rapid switching accelerates wear on the relays, moving the muliplexer module closer to end-of-life. The chart below represents one day of activity on the PV system as captured by the DAQ970A. Panel voltage is on top, battery voltage in the middle, and temperature on bottom. The sample interval is 1 sample/minute.
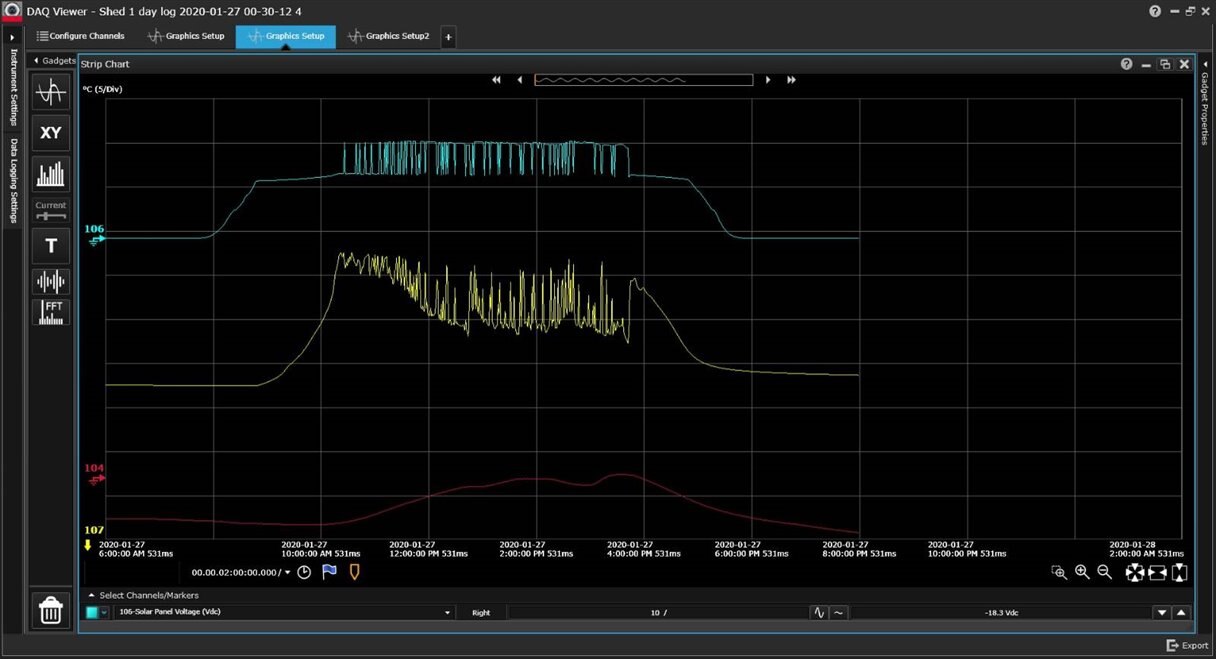
The traces have the general shape characteristics I expect and they agree in general with traces I had taken with the B&K DAS240-BAT and before that with my Fluke 287 logging multimeter. Zooming in on a portion of this log around noon reveals the drawback of using lengthy sample intervals on rapidly changing signals. See the illustration below. The behavior of panel voltage and battery voltage do not look quite right, especially when compared to the behavior captured by the DAS240-BAT when it was sampling at 100 ms/sample. There are runt pulses in the panel voltage trace, the pulse durations are very uneven and the pulses lack the sharp switching edges revealed in the DAS240-BAT log. Traces taken at 1 sample per minute only provide a high level perspective of system behavior. From these traces you could determine that the battery was being pulse charged and roughly determine when that mode of charging started and stopped during the day, but you could not reliably determine how long each charge pulse was, or the trip thresholds on the PWM charger. So, the data set is somewhat useful, but it is imperative to be aware of the relationship between sample rate and signal frequency when using a data logger.

To demonstrate that the DAQ970A can capture fine details similar to the detail captured by the DAS240-BAT I set up a short data log mission that took 60 samples at "min value" scan interval. From what I have observed, "Min value" scan interval means the relays will operate as fast as they can limited only by integration time set up on each channel. Integration time was set to 0.01 PLC on all three channels for the log shown below. With min interval and short integration times the relays made a lot of chattering noise during the roughly 6 seconds it took to gather this logs below. However, these settings were adequate for capturing the charge detail that I was looking for. I can clearly see the PWM behavior on the charge controller and can measure the trip voltages on the battery that cause the controller to switch in and out. Note that the very short integration time of 0.01 PLC causes the temperature trace to be rather noisy.

Even though the DAQ970A with a relay switch module can be configured to gather data at a rate sufficient for analysis of this particular PV system, the settings stress the relays and it would not be sensible to run a day long mission, or a multi-day long mission at these sample rates. The B&K DAS240-BAT handles long duration missions at high sample rates with ease and, in general, is a better choice for the sort of work I am carrying out during this upgrade project.
My preference: No clear winner
BenchVue provides a much slicker, full featured UI, but it is slow to load and slow to process data logs, even after I optimized my PC. Keysight has also imposed a pay model in order to obtain updates to application modules. DasLab and Sefram Viewer are free, but they are also clunky, buggy, and awkward to use. They get the job done and are quite responsive once loaded. So each interface has its advantages and disadvantages. Both need work to make them truly effective and responsive to user needs.
Conclusion
I set out to evaluate these two data logging tools in a specific application. After using both tools for two months in this particular use case, I would say the B&K Precision DAS240-BAT is the better tool. In spite of its many bugs, odd operational procedures, and quirkiness, I prefer it because of its capabilities. I found the large built in memory and ability to support fairly high sample rates to be quite useful. The large touch screen is wonderful to use. Signal connection is easy and flexible. The ability to operate from a battery is a nice extra feature. I only ran the unit from battery for a few hours, but I can see how this feature can be very useful. Battery operation means the instrument is not tied to a powered bench; it can be moved to the field if necessary. My list of bugs and anomalies piled up during this review and I ended up scratching my head in wonder on a few occasions. Ultimately I was able to get the DAS240-BAT to do everything I needed it to do, but I can't give it top notch ratings until the bugs are removed from the UI.
The Keysight DAQ970A comes across to me as a far more mature and stable instrument with fewer bugs and a more intuitive UI. In the use case examined here where I needed to sample data on several channels at fairly high rates, the DAQM901A relay multiplexer is not the best choice. The signal connection method is better suited to lab situations that are well planned in advance because making changes to connections is cumbersome.
Thank you to B&K Precision and element14 for the opportunity to Road Test the DAS240-BAT,and thank you to element14 members that read and comment on this review.