


Nature bounces back amid coronavirus
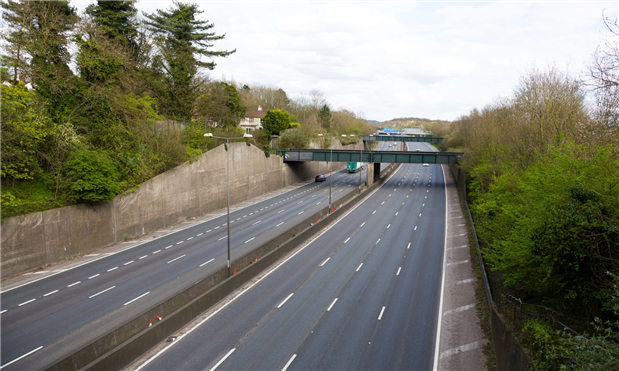
Since the COVID-19 pandemic forces people to stay at home, fewer vehicles have been taking the streets. Especially on London’s M25 motorway, which is usually busy. (Image Credit: Dave Stevenson/REX/Shutterstock)
The COVID-19 pandemic that’s impacting human lives is also having a positive role on the planet. With factories being shut down and motorways clearing up, carbon dioxide and nitrogen dioxide have been decreasing by 40% in countries like China, Italy, the UK, Germany, etc. just days after lockdown. In turn, this has improved air quality while reducing the risk of asthma, heart attacks and lung disease. This could be a sneak-peek into what the world looks like without burning fossil fuels. So far, China’s carbon emissions went down by 18%, or 250m tonnes, between early February and mid-March. Europe and the US could see a reduction of around 390m tonnes, which is due to passenger-vehicle traffic dropping close to 40%. This is excellent news for our planet since oil is the leading source of carbon emissions that heat the earth while disrupting weather systems. While humans deal with lockdowns, wildlife is also benefiting from less on-road vehicles. This year, the UK should see less roadkills, where vehicles take the lives of 100,000 hedgehogs, 30,000 deer, 50,000 badgers and 100,000 foxes yearly. Meanwhile, in the US, coyotes have been seen wandering on the Golden Gate Bridge in San Francisco, and deer are grazing near homes in Washington, a few miles away from the White House.
Great Barrier Reef could eventually die off from climate change
Australia’s Great Barrier Reef could eventually die off due to bleaching, which is the result of hot water washing up from climate change. (Image Credit: NASA) 
Australia’s Great Barrier Reef, which survived five glacial periods, might not last much longer. On March 26th, the Reef suffered through its third major bleaching event in five years. According to the Australian government, the Reef underwent huge amounts of bleaching, even in the southern areas where it was untouched by past events. A warming climate is to blame for the waves of hot water that wash up on the 3,000 coral reefs making up the entire 2,300 km living structure. Stressed coral begin releasing their symbiotic algae when water temperatures are slightly above normal. As a result, this leads to bleaching and if it happens too frequently and intensely, the reefs and their ecosystem die off. As it stands now, sea surface temperatures are expected to be 2.5C above normal by the end of the century. Australia’s marine park agency says “Climate change remains the single greatest challenge to the Reef,” In the end, climate change could devastate the Great Barrier Reef and all its living inhabitants.
Carbon emissions could have the biggest drop since World War Two

The coronavirus pandemic has caused carbon emissions to taper off around the world. (Image Credit: CDC)
We could see carbon emissions drop drastically since World War Two this year. This is mainly because the COVID-19 global pandemic brought the economy to a complete halt. Carbon output could fall by over 5% year-on-year, which would be the first time it’s seen such a reduction since the 2008 financial crisis. This prediction sheds a bit of light during the coronavirus outbreak: Climatologists warned governments that emissions need to drop by 2020 in order to avoid the worst effects of climate change. However, all emissions reductions could have a short-term effect and could have minimal impact on the concentrations of carbon dioxide that collected in the atmosphere. Greenhouse gas emissions rose back up to 5.1% while recovering from the 2007-2008 financial crisis. A significant increase after pollution dropped. This has already started to take effect in China, where emissions dropped drastically by approximately 25% after they shut down factories and went into lockdown. To prevent global temperatures from rising to 1.5C, emissions will need to be reduced by an average of 7.6% per year. Since governments have launched substantial stimulus packages to prevent their economies from collapsing, investors will be keeping an eye on countries affected by COVID-19 to see how they take advantage of lower-emission energy sources.
Maps show smog reduction from COVID-19 pandemic
Certain parts of the United States have seen a drastic reduction in emission levels. The darker blue areas represent more pollution. I'm in Chicago... not looking so good. (Image Credit: Descartes Labs)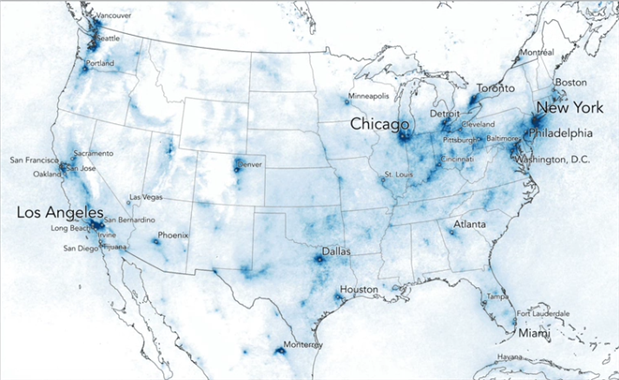
Nitrogen dioxide air pollution has dramatically decreased by 30% during the first month of the coronavirus lockdown in the Northeastern United States. Meanwhile, thanks to fewer vehicles roaming the streets and reduced air traffic, smog in places like Los Angeles has nearly vanished. This has also happened in China and Italy, where emissions are usually alarmingly high. Satellite imagery from Descartes Labs keeps track of changes in air quality. So far, NO2 pollution in Seattle fell by 19% compared to last year. It also fell in other places like New York (22%), Denver (15%), and Los Angeles (33%). New Delhi, India, has seen a 70% reduction in nitrogen dioxide pollution and PM 2.5, which are minuscule soot particles. Since air pollution contributes to heart attacks, asthma and lung disease, it could also cause more COVID-19 deaths where an area is more polluted. According to the WHO, around 7 million people around the world die every year from exposure to air pollution. However, since China started operating factories again, poor air quality has resurfaced, so a decrease in pollution may only be temporary in the United States. Still, the clear skies are a good indication of what’s possible without polluting the air from emissions.
Coronavirus shutdown leads to clear skies in California
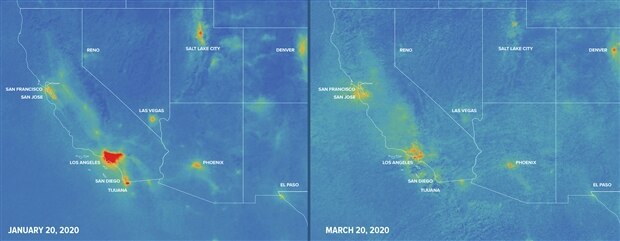 The map, which compares pollution levels from a year ago, shows a striking difference between then and now. (Image Credit: Earther interactive map)
While humans around the globe practice social distancing and businesses shut down during the pandemic, earth-orbiting satellites have been observing reduced nitrogen oxide levels, especially in California. By using data collected from satellites, ground instruments, and aircraft, the California Air Resources Board’s Air Quality and Meteorological Information Systems can observe air pollution. They discovered that areas like San Bernardino and Los Angeles, California, have significantly reduced air pollution, while other areas saw a decrease of over 50%. However, this has also led to higher ozone levels during the night. This is because nitrogen oxides can create ozone when mixed with different molecules, and it can react with ozone, which is more common at night. An interactive map created by Earthen that runs on Google Earth Engine shows how much air pollution has decreased around the world. The map, which uses data from the ESA’s Sentinel SP satellite, displays nitrogen emissions from December 2019 to March 20th, 2020. The dark red and bright orange spots represent the emissions, which were once very high, but have been drastically reduced ever since.
Have a story tip? Message me at: cabe(at)element14(dot)com
