element14 Community
element14 Community
    Register Log In
  • Site
  • Search
  • Log In Register
  • About Us
  • Community Hub
    Community Hub
    • What's New on element14
    • Feedback and Support
    • Benefits of Membership
    • Personal Blogs
    • Members Area
    • Achievement Levels
  • Learn
    Learn
    • Ask an Expert
    • eBooks
    • element14 presents
    • Learning Center
    • Tech Spotlight
    • STEM Academy
    • Webinars, Training and Events
    • Learning Groups
  • Technologies
    Technologies
    • 3D Printing
    • FPGA
    • Industrial Automation
    • Internet of Things
    • Power & Energy
    • Sensors
    • Technology Groups
  • Challenges & Projects
    Challenges & Projects
    • Design Challenges
    • element14 presents Projects
    • Project14
    • Arduino Projects
    • Raspberry Pi Projects
    • Project Groups
  • Products
    Products
    • Arduino
    • Avnet Boards Community
    • Dev Tools
    • Manufacturers
    • Multicomp Pro
    • Product Groups
    • Raspberry Pi
    • RoadTests & Reviews
  • Store
    Store
    • Visit Your Store
    • Choose another store...
      • Europe
      •  Austria (German)
      •  Belgium (Dutch, French)
      •  Bulgaria (Bulgarian)
      •  Czech Republic (Czech)
      •  Denmark (Danish)
      •  Estonia (Estonian)
      •  Finland (Finnish)
      •  France (French)
      •  Germany (German)
      •  Hungary (Hungarian)
      •  Ireland
      •  Israel
      •  Italy (Italian)
      •  Latvia (Latvian)
      •  
      •  Lithuania (Lithuanian)
      •  Netherlands (Dutch)
      •  Norway (Norwegian)
      •  Poland (Polish)
      •  Portugal (Portuguese)
      •  Romania (Romanian)
      •  Russia (Russian)
      •  Slovakia (Slovak)
      •  Slovenia (Slovenian)
      •  Spain (Spanish)
      •  Sweden (Swedish)
      •  Switzerland(German, French)
      •  Turkey (Turkish)
      •  United Kingdom
      • Asia Pacific
      •  Australia
      •  China
      •  Hong Kong
      •  India
      •  Korea (Korean)
      •  Malaysia
      •  New Zealand
      •  Philippines
      •  Singapore
      •  Taiwan
      •  Thailand (Thai)
      • Americas
      •  Brazil (Portuguese)
      •  Canada
      •  Mexico (Spanish)
      •  United States
      Can't find the country/region you're looking for? Visit our export site or find a local distributor.
  • Translate
  • Profile
  • Settings
Open Source Hardware
  • Technologies
  • More
Open Source Hardware
Forum Archaeology Resistivity Meter
  • Blog
  • Forum
  • Documents
  • Events
  • Polls
  • Members
  • Mentions
  • Sub-Groups
  • Tags
  • More
  • Cancel
  • New
Join Open Source Hardware to participate - click to join for free!
Actions
  • Share
  • More
  • Cancel
Forum Thread Details
  • Replies 332 replies
  • Subscribers 318 subscribers
  • Views 41649 views
  • Users 0 members are here
  • armp
  • archaeology resistivity meter
Related

Archaeology Resistivity Meter

kltm
kltm over 5 years ago

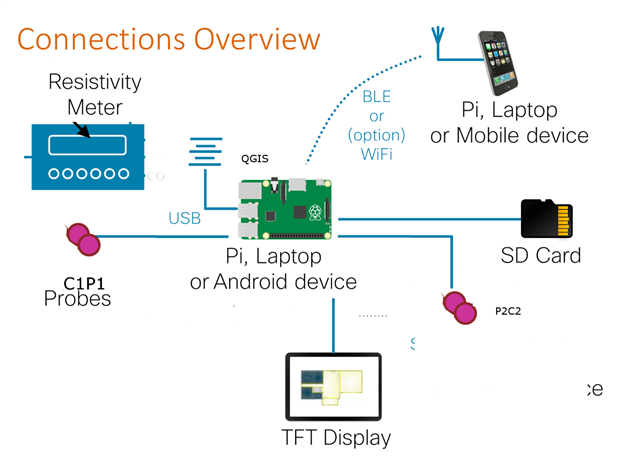
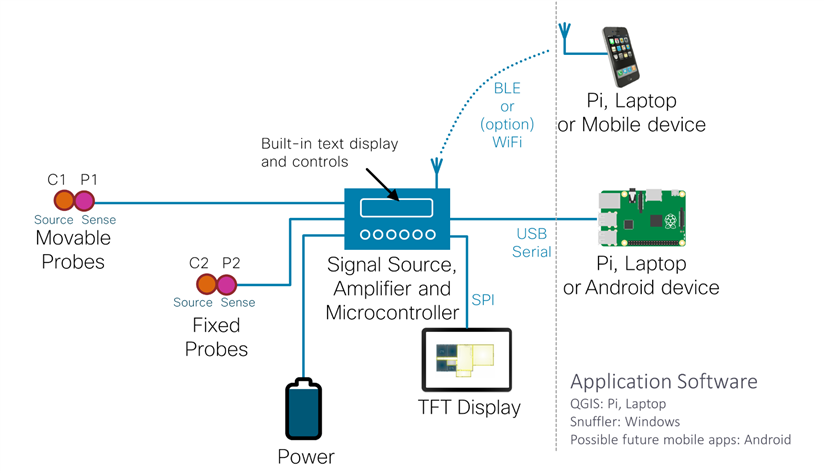
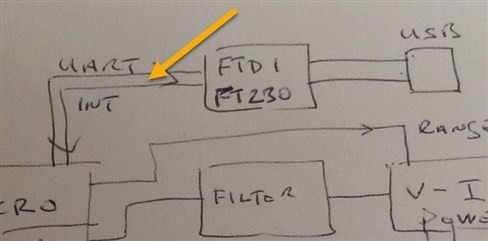
Hi I'm looking for ideas on an update to a resistivity meter for archaeology. The only published designs for diy were in 2 magazines. One was published in 1997 and the other in 2003. I have copies of both articles available. The reason behind this is the current high cost of available equipment, usually well beyond the reach of most archaeological groups. I've attached a basic block diagram. In the first magazine article the meter is very basic. It relied on the operators to write down the reading given as the survey was taken. Given that a normal survey grid is 20m x 20m and 1 reading is taken on every sq mtr there would be 400 readings to write down and then input into a program used to interpret the results. The later article is really an update to the first where a PIC has been added to record the readings. This again is prone to error, because eadings are taken manually by pressing a button.

I'm sure given the advances in electronics there must be better ways. 


image

  • Sign in to reply
  • Cancel

Top Replies

  • kltm
    kltm over 5 years ago in reply to michaelkellett +8
    Hi Michael This all sounds very interesting and encouraging. I see you have found the original article, the update is also on slideshare somewhere. I haven’t really thought much about cost, but as you…
  • michaelkellett
    michaelkellett over 5 years ago in reply to shabaz +7
    I can't live with that - I have to have symmetry The problem is that the Howland current pump doesn't constrain the voltage on the load at all when perfectly balanced - and my LTSpice model is unrealistically…
  • michaelkellett
    michaelkellett over 5 years ago in reply to michaelkellett +7
    AS promised - now for the phase sensitive detector. I couldn't easily model this in LTSpice, which is no great surprise because it needs multiplication and square roots. I used Simulink in MATLAB - which…
Parents
  • genebren
    genebren over 5 years ago

    Interesting ideas so far.  I meant to chime in earlier, but things have been pretty busy for me lately (building a deck and entertaining my Grandchildren again).


    Several years ago, I was asked to sit in with some friends of my sister that work at a geotech company.  They were looking to build impedance measurement devices for soil surveys.  I came across this amazing looking chip from Analog Devices that looked like a great way to measure impedance (including a complex component).


    Here is a snippet from the specification:


    The AD5934 is a high precision impedance converter system solution that combines an on-board frequency generator with a 12-bit, 250 kSPS, analog-to-digital converter (ADC). The frequency generator allows an external complex impedance to be excited with a known frequency. The response signal from the impedance is sampled by the on-board ADC and a discrete Fourier transform (DFT) is processed by an on-board DSP engine. The DFT algorithm returns a real (R) and imaginary (I) data-word at each output frequency.Once calibrated, the magnitude of the impedance and relative phase of the impedance at each frequency point along the sweep is easily calculated using the following two equations:Magnitude = 22IR+Phase = tan−1(I/R) A similar device, available from Analog Devices, Inc., is the AD5933, which is a 2.7 V to 5.5 V, 1 MSPS, 12-bit impedance converter, with an internal temperature sensor, available in a  16-lead SSOP.


    This might be of some help in your planning.


    Good luck and let me know if you need any help on this project.


    • Cancel
    • Vote Up +4 Vote Down
    • Sign in to reply
    • Cancel
  • shabaz
    shabaz over 5 years ago in reply to genebren

    Hi Gene,


    It's a super-interesting chip, I was keen to use it a few years ago for plant soil purposes, and for hydroponics - to try to see if the soil or liquid has nutrients. The idea being to have a signature of known good soil or water by sweeping through the spectrum. I never got to try it though sadly, the project moved on to something else.

    It was felt that it could have had a lot of merit because then you could publish the signature, so others could try to replicate a yield (it wasn't going to be for farmers, more for home use), and to not waste nutrient. But, I have no idea in practice if the result would have been usable, or too inconsistent/variable.

    I wish I'd done some work on it at the time, since it could have been useful for other purposes too.


    The proposed design so far is one half of the impedance measuring system, but with digital processing. In theory it could be converted to an impedance measuring system with no additional hardware change, just a software upgrade, since the frequency will be know, and there will be some sync pulse from the FPGA, we just need to internally multiply with a 90 degree out of phase signal from that sync pulse too.

    • Cancel
    • Vote Up +3 Vote Down
    • Sign in to reply
    • Cancel
  • michaelkellett
    michaelkellett over 5 years ago in reply to shabaz

    A lot of the hand drawn lines look a bit dashed. image


    I was just warming to the idea of an STM32H7 ...... but I think lower power is better really.


    MK

    • Cancel
    • Vote Up +4 Vote Down
    • Sign in to reply
    • Cancel
  • paul_d_arch
    paul_d_arch over 5 years ago in reply to shabaz

    Shabaz,


    I have changed your outline. In the UK two of the probes are 'fixed' and can be in the same position for the day (or longer)


    The QGIS team have vast experience to call on in displaying this type of data  Many groups in the UK use QGIS and some run training days in Python.


    You can have a table and power at P2C2 and use existing equipment (including a tea and coffee facilities - YES most groups have a tent that could be pitched close to the 'fixed' probes if needed) My editing of your original is very bad, sorry.


    When I said "What about a Pi" I meant "QGIS would be good. it runs on Laptops and a Pi"


    Paul D

    image

    • Cancel
    • Vote Up +4 Vote Down
    • Sign in to reply
    • Cancel
  • shabaz
    shabaz over 5 years ago in reply to paul_d_arch

    Hi Paul,


    I've updated it to incorporate your comments regarding the probes and software. One underlying difference (won't make a difference to the user apart from a major improvement hopefully!) is that the older existing designs use analog circuitry for most of the signal generation and processing. In this design however, more of that is done digitally, and so needs precise timing and regular fast calculations, which would be an overhead for the Pi, so all that underlying processing needs a microcontroller (and an FPGA), hence the separation between that and the Pi. The Pi has full control via USB Serial, which is a key difference to Snuffler. The Pi can instruct the desired frequency, start/stop measurements and acquire the data in real-time, i.e. the Pi is in full control using Python, C or any desired language. Also, the interface can still work with existing software in real-time (I've run Snuffler to examine what data is expects), so I've listed those in the diagram now.

    For those who want to use a laptop, they will find it equally seamless with Windows and existing software, it's just more convenient to use USB rather than have the older RS232 DB9 connector. Just like with the Pi, they can have full control using any programming language if desired.

    For those who want to use Android, initially there could be just a simple skeleton app which doesn't do much but provides some basic visuals, or just collects up the data to e-mail it.


    image

    • Cancel
    • Vote Up +3 Vote Down
    • Sign in to reply
    • Cancel
  • paul_d_arch
    paul_d_arch over 5 years ago in reply to shabaz

    Shabaz,


    What software are you using to create your drawings? They are great.


    Paul D

    • Cancel
    • Vote Up +3 Vote Down
    • Sign in to reply
    • Cancel
  • shabaz
    shabaz over 5 years ago in reply to paul_d_arch

    Hi Paul,


    Thanks! I'm using Powerpoint. I've used it a lot and so already had things like the Pi and display ready to use.

    For items like the phone graphic, I usually google search for (say) 'phone transparent png' and then it finds stuff with the transparent background.

    • Cancel
    • Vote Up +2 Vote Down
    • Sign in to reply
    • Cancel
  • phoenixcomm
    phoenixcomm over 5 years ago in reply to michaelkellett

    michaelkellett I do agree with you, but

    1. The Pi4 can support Debian (Linux)
    2. I disagree with Shabaz about using USB between PI and control head, As said before CAN bus is robust and you don't have to write the protocol.
    3. I disagree with Shabaz about  using WiFi ( sucks power)
    4. If you go with the Pi, then with a USB3 to SATA adapter (this is what my VOIP server is running on) and run a notebook drive, for the OS and Data The Pi can be set not to boot from the SD card if you wish.
    5. if you use a tablet, that's overkill + you would have to write an app.
    6. if you use a small control box (operator panel) you could put Arduino in it. The would drive the CAN bus communications,  4xx20 I2C display, and keyboard, plus and switches etc.
    7. So if you go with my suggestion you need two cables in the waterproof cover.
      1. (5 Volts and Ground)
      2. two-wire shielded twisted-pair (50-ohm stuff works fine.

    ~~ Cris

    .

    • Cancel
    • Vote Up +2 Vote Down
    • Sign in to reply
    • Cancel
  • phoenixcomm
    phoenixcomm over 5 years ago in reply to phoenixcomm

    michaelkellett  and of course the PI would handle the GPS.

    • Cancel
    • Vote Up +1 Vote Down
    • Sign in to reply
    • Cancel
  • paul_d_arch
    paul_d_arch over 5 years ago in reply to shabaz

    Oh, sometimes the oldies are the best!


    Paul D

    • Cancel
    • Vote Up +3 Vote Down
    • Sign in to reply
    • Cancel
  • shabaz
    shabaz over 5 years ago in reply to phoenixcomm

    Hi Cris,


    The existing visualization/archeology software doesn't use CAN, it uses serial (either RS232 or USB serial, either will work with them). If CAN is used between Pi and the main unit could you approximately sketch or list what modules etc will do the translation to RS232, or will appear like /dev/ttySerial to the software? (and appear like a Serial interface to the PC too, otherwise people cannot use the existing Snuffler software, which only runs on Windows).


    Just to clarify although it says USB, really the underlying communication is traditional 9600 or 115200 etc baud serial, i.e. easily swapped to RS232 or any long distance, robust method. If anyone wants these methods, they would be very easy to convert, and no code changes are required because there's no USB protocol being coded, there is a UART-to-USB chip (which could be unsoldered and replaced with UART-to-RS232 or to any other desired method). If anyone knows what hardware to use for wiring CAN to Pi and write some code for it, then it can be easily wired in, because there's no USB from the microcontroller, it's two-wire UART Tx and Rx. That detail will appear on the block diagram that Ken is drafting.

    image


    I agree regarding WiFi, I don't see the need for those comfortable with the other methods, but it's an option for those who feel more comfortable programming for an ESP chip. It's just to accommodate them, so they can contribute too if they want to. I don't know how to use the ESP, and it is labelled as an option for anyone else (if they want to) to contribute.

    The tablet/phone is a low-priority option, it is enabled for zero additional hardware cost since it uses the same connection (USB Serial). Using it would give some free advantages (by free I mean no hardware cost, beyond owning a phone) such as the potential to grab positioning data, or sending data using cellular. For those more comfortable doing it with the Pi and GPS module, that's totally fine.

    I'm self-encouraged to write a simple mobile app if anyone sees an advantage in it. I did some brief testing last night to confirm for myself that I'm not over-promising by putting the tablet in the diagram and then subsequently discovering it is impossible. If no-one wishes it, that's fine, the time wasn't wasted because I can use that for a different project one day. It could be a really poor solution, for instance if the mobile battery dies etc. I don't know.

    • Cancel
    • Vote Up +2 Vote Down
    • Sign in to reply
    • Cancel
  • phoenixcomm
    phoenixcomm over 5 years ago in reply to shabaz

    shabaz  ok no matter what you do you will need 2 CPUs.

    • one controlling the probes, etc most likely a PI, I would also have the GPS module there as well, and a CAN Module for talking to the control panel.
    • the control panel could be an Arduino mega, 4x20 LED I2C display, a keyboard, and maybe some switches.

    Please refer to my Bolg Adventures In CANaerospace (the hardware is the same as CANbus).

    All you would do is take msgs off the CAN bus and put them on the display. You can also transmit messages the same way. easy peasy.

    • Cancel
    • Vote Up 0 Vote Down
    • Sign in to reply
    • Cancel
Reply
  • phoenixcomm
    phoenixcomm over 5 years ago in reply to shabaz

    shabaz  ok no matter what you do you will need 2 CPUs.

    • one controlling the probes, etc most likely a PI, I would also have the GPS module there as well, and a CAN Module for talking to the control panel.
    • the control panel could be an Arduino mega, 4x20 LED I2C display, a keyboard, and maybe some switches.

    Please refer to my Bolg Adventures In CANaerospace (the hardware is the same as CANbus).

    All you would do is take msgs off the CAN bus and put them on the display. You can also transmit messages the same way. easy peasy.

    • Cancel
    • Vote Up 0 Vote Down
    • Sign in to reply
    • Cancel
Children
  • michaelkellett
    michaelkellett over 5 years ago in reply to phoenixcomm

    You posted your

    phoenixcomm  wrote:


    shabaz   ok no matter what you do you will need 2 CPUs.

    • one controlling the probes, etc most likely a PI, I would also have the GPS module there as well, and a CAN Module for talking to the control panel.
    • the control panel could be an Arduino mega, 4x20 LED I2C display, a keyboard, and maybe some switches.

    Please refer to my Bolg Adventures In CANaerospace (the hardware is the same as CANbus).

    All you would do is take msgs off the CAN bus and put them on the display. You can also transmit messages the same way. easy peasy.

    while I was writing mine so I didn't see it.


    If by controlling the probes you mean generating the signals and mesuring them I'm not quite sure how a Pi would do that.


    MK

    • Cancel
    • Vote Up +1 Vote Down
    • Sign in to reply
    • Cancel
  • phoenixcomm
    phoenixcomm over 5 years ago in reply to michaelkellett

    michaelkellett

    michaelkellett  wrote:


    You posted your

    phoenixcomm   wrote:


    shabaz    ok no matter what you do you will need 2 CPUs.

    • one controlling the probes, etc most likely a PI, I would also have the GPS module there as well, and a CAN Module for talking to the control panel.
    • the control panel could be an Arduino mega, 4x20 LED I2C display, a keyboard, and maybe some switches.

    Please refer to my Bolg Adventures In CANaerospace (the hardware is the same as CANbus).

    All you would do is take msgs off the CAN bus and put them on the display. You can also transmit messages the same way. easy peasy.

    while I was writing mine so I didn't see it.


    If by controlling the probes you mean generating the signals and mesuring them I'm not quite sure how a Pi would do that.


    MK

    MiK ~~ I assumed you inserting the probes into the ground, as you would do with a Meger.

    which would mean the PI using GPS would tell you when to stop and lower the probes?  after taking the reading, you would then have to raise them. rinse and repeat,  over and over.


    ~~Cris

    • Cancel
    • Vote Up +1 Vote Down
    • Sign in to reply
    • Cancel
  • phoenixcomm
    phoenixcomm over 5 years ago in reply to phoenixcomm

    one more comment if you use standard CAN yes there are 8-byte payloads, BUT there is a way to send "extended" frames which can have a variable payload.

    please refer to https://en.wikipedia.org/wiki/CAN_bus  as It is easy to send longer data payload then 8 -bytes. Please note the yellow DLC field which controls the length of the red data field,


    In CAN FD, the frame/message ID has been increased to 29-bits compared to only 11-bits in the classic CAN. The message payload size has been increased to 64 bytes of data in each CAN-frame / message, compared to only 8-bytes in the classic CAN frame. CAN FD can handle CAN frames/messages with 11-bit ID as well. A frame is a message transmitted as a sequence of binary bit-pattern. In CAN FD, the data rate (i.e. number of bits transmitted per second) is increased to be 5 times faster than the classic CAN. CAN FD protocol specification includes some other enhancements as well, such as better detection of errors in the received CAN message and the executing software flexibility to dynamically select (from a list) and switch to faster or slower data rate transfer, as and when required. Some sensors on the CAN BUS operates at slower data rate and others at faster data rate. CAN BUS is a shared pair of wires onto which electronic sensors, controller units and ECUs are connected. CAN Bus is used for exchanging information between operational units periodically or on demand. The electrical condition and configuration of the CAN Bus, i.e. the total number of units connected, the length of the CAN Bus wires and other electromagnetic factors determines the fastest data transfer rate possible on that CAN Bus. This because when units are connected to a CAN Bus (e.g,  Sensors, Controllers, or ECUs), it changes the electrical condition of the CAN Bus somewhat. The change may result in limiting the CAN FD protocol from achieving the maximum theoretical data transfer rate.

    Field nameLength (bits)Purpose
    Start-of-frame1Denotes the start of frame transmission
    Identifier (green)11A (unique) identifier which also represents the message priority
    Remote transmission request (RTR) (blue)1Must be dominant (0) for data frames and recessive (1) for remote request frames (see Remote Frame, below)
    Identifier extension bit (IDE)1Must be dominant (0) for base frame format with 11-bit identifiers
    Reserved bit (r0)1Reserved bit. Must be dominant (0), but accepted as either dominant or recessive.
    Data length code (DLC) (yellow)4Number of bytes of data (0–8 bytes)[a]
    Data field (red)0–64 (0-8 bytes)Data to be transmitted (length in bytes dictated by DLC field)
    CRC15Cyclic redundancy check
    CRC delimiter1Must be recessive (1)
    ACK slot1Transmitter sends recessive (1) and any receiver can assert a dominant (0)
    ACK delimiter1Must be recessive (1)
    End-of-frame (EOF)7Must be recessive (1)
    • Cancel
    • Vote Up +2 Vote Down
    • Sign in to reply
    • Cancel
  • michaelkellett
    michaelkellett over 5 years ago in reply to phoenixcomm

    I did mention the possibility of CAN FD in my note, I don't think that it is supported by the STM32L4R5xxx processors.

    CAN FD doesn't improve throughput by as much as you might hope, (very few systems actually manage the maximum possible data rate).

    There is still the problem that CAN is a short packet based system and you end up with a complicated multi packet protocol to

    send longer than packet size messages, and no standard PCs have CAN interfaces.

    All these issues can be got over, but I still can't see what advantage would be gained from using CAN.

    The primary reason the instrument needs interfaces is to connect with computers that run Windows or Linux, they all have USB,

    none of them have CAN without add ons.


    MK

    • Cancel
    • Vote Up 0 Vote Down
    • Sign in to reply
    • Cancel
  • phoenixcomm
    phoenixcomm over 5 years ago in reply to michaelkellett

    michaelkellett there is no multi-packet protocol. when a message is received  It looks at the ID to see if is for him he sucks the message (the whole thing) you look at the DLC  fields value if its 8 just take the next 8-bytes,  or for longer values do whatever the DLC requires. There are a bunch of semi makers, TI is one of them and they send samples

    ~~Cris

    • Cancel
    • Vote Up 0 Vote Down
    • Sign in to reply
    • Cancel
  • michaelkellett
    michaelkellett over 5 years ago in reply to phoenixcomm

    It's quite true that if you use CAN in a simple point to point system you could use it as you suggest.


    It isn't usually used like that in automotive or aerospace applications but there is certainly no reason why you shouldn't.


    MK

    • Cancel
    • Vote Up +2 Vote Down
    • Sign in to reply
    • Cancel
  • davemartin
    davemartin over 5 years ago in reply to michaelkellett

    Just jumping in having read through the discussion. This is an exciting project!


    A few thoughts, apologies for a long post and to those who are experienced archaeological geophysicists.


    There is much discussion of implementation, but it doesn’t feel like some of those advancing a particular line of attack necessarily understand the task, so there’s a danger of trying to decide whether an M4 or an M5 screw should be used before knowing what is to be fastened to what and what loads will be.


    The essence of any geophysical survey of this type is a set of readings with exact knowledge of where each set of readings is taken. Most GPS is not suitable for this. Grids are achieved with lines which guide the operator where to place the probe frame. The smallest interval commonly used along the line is every 0.5m. Unless using RTK or synchronised PPK with event interpolation, GPS positions can be perhaps 20 or 30 cm out. Taking an extreme case, if successive epochs were 25cm out at either extreme along the line of advance, instead of readings showing true distance along of 0.5, 1.0, 1.5, 2.0 metres they could be recorded as 0.75, 0.75, 1.75, 1.75. Furthermore, as you walk along using a probe frame, you tend to swing it, drop the probes into the ground, walk forward and by the time it has taken the reading you are at least up to the frame. The idea is to keep a walking gait, not stop&start every half or one metre. What this means is that the frame is not always vertical. To get a good skyview, the GPS antenna would have to be mounted on a pole so the lever arm could be up to two metres. Some of the newest survey kit can correct for that, but it is building more complexity in which is un-necessary and the pole will make the probe frame even more unwieldy.


    Having said all of the above, what could conceivably be of use is storing an approximate GPS position for say the start and end of each line of readings. This is not to provide co-ordinates for the points, but is to assist when collating individual grids, especially if the post-processing is done a little while later. Instead of searching for field notes to try and work out, say, was grid one at the E or W end of the baseline, even a crude GPS position accurate to a couple of metres would be sufficiently diagnostic; and if start and end of each line was logged, even if some were occluded, there should still be sufficient redundancy. Those GPS positions would not though provide co-ordinates for any of the readings. A GPS embedded in the controller could achieve this type of function (but would need extra in the UI to ensure if cold-started that it had acquired almanac and PDOP was sufficiently low).


    Full processing is unlikely to be achievable in real time – there are potentially a whole series of steps which have to be run through, some of which need to take account of multiple grids. Furthermore, the average operator needs to keep their eyes where they are going (most of the time at least). Conceivably you could have a quick peek at the end of a grid – but mid-grid isn’t the time to look at results.


    What is possibly useful is a checkerboard type display if the operator gets confused over which way to go; that could be also very valuable when obstacles are encountered to make sure sufficient dummy readings are entered (and no more). Otherwise, a count of points and lines and/or countdown, and an audible end-of-grid are all that is really needed.


    With a well-designed probe frame and a well-designed UI, the display could rotate at the end of each line so as to prompt the user to optimally traverse (not as so important as with some magnetometers, but ideally the probe frame orientation should remain constant irrespective of whether heading ‘up’ or ‘down’ a line to avoid introducing striping effects). ‘Soft keys’ (membrane buttons, not a touch screen) placed symmetrically either side of the screen with legends that move with the display could mean the full UI remains identical whichever side of the frame the operator was on.


    I recall one comment about the fixed probe position – it needs to remain fixed for the duration of a grid, but when surveying any worthwhile area it can be moved a considerable number of times in a day. When the fixed probes are moved, the absolute readings on the next line will inevitably be different – but the post-processing software should deal with that. Also, I think I recall someone mentioning storing readings in one byte – need more precision plus gain/range, so will need at least several bytes.


    There has been discussion above on how to connect boxes, but from the perspective of a unit to be actually used in the field, I can see lots of disadvantages and no advantages in a multi-box solution. One box, two connectors in normal use – one to the probes on the frame, one to the fixed pair of probes. Those connectors need to be mud, damp etc. proof and the Bulgin ‘Bucanneer’ type used on some commercial kit work well.  If download via serial or USB etc. then need a protected connector for that, and one to charge batteries if to be charged in situ (sufficient battery or robustly field-swapped like on, say survey GPS would be good). The box needs to be easily dismountable so when the frame is chucked in the back of a van or pick-up the box can be taken inside.


    One aspect which I didn’t spot so far in the thread (apologies if I missed it) is that if a suitable probe frame is used, a ‘clever’ instrument could mux the probes and, at one point, take readings with different spacings/combinations or configurations (Wenner, Schlumberger, double-dipole etc.). For that, would need provision for say four on-frame probe connections so make it a four-way connector. Futhermore, would suggest possibly having ability either on that connector (or a dedicated one) to power and control a bigger mux to allow inversion arrays to be used – that could/should legitimately be a second box.


    I can easily see three use cases: the primary users will be the vast majority who will be traversing grids; second would be using an external mux to drive an inversion array – only used occasionally by a few users but a valuable add-on option. The third use case is one which, whilst exciting, I would suggest shouldn't be allowed to distract from the core instrument. The third case is a wheeled instrument (propelled by human or towed by ATV etc.) – that needs different triggering, odometry, postion logging, navigation etc. – would suggest that is kept until a core instrument that can achieve good, reliable results in the field is proven.


    Finally for now, for those who aren’t familiar with archaeological geophysics, could I suggest three works:

    ‘Seeing beneath the soil: prospecting methods in archaeology’ by Tony Clark

    ‘Revealing the buried past: geophysics for archaeologists’ by Chris Gaffney and John Gater

    ‘Looking into the earth: an introduction to geological geophysics’ by Alan Mussett and Aftab Khan

    and in regard to this specific technique:

    ‘Earth resistance for archaeologists’ by Armin Schmidt


    Dave

    • Cancel
    • Vote Up +3 Vote Down
    • Sign in to reply
    • Cancel
  • michaelkellett
    michaelkellett over 5 years ago in reply to davemartin

    Thanks Dave - good stuff !

    I do electronics and didn't start thinkingabout measuring Earth Resistance until Ken started this thread.

    I think the direction of travel is broadly in accord with your suggestions.

    I think it's likely we'll use the camera style batteries  - the biggest ones on offer at Amazon claim 65 Whrs so would cope with any suggested features.

    Totally agree about tough connectors.

    I'm interested that you think a multiplexer might be worthwile from the start - not that hard to do (at 4 ways).

    Single box - for sure.

    We'll have at least 1 Mbyte of on board memory - so good for at least 8192 readings (at a very generous128 bytes per reading)

    We need to think carefully about the ergonomics, I like the idea of using the box either way up - I'd seen the Frobisher box descibed as being left or right handed.

    If we have  a graphics display it can work either way up without too much trouble.


    I'd spotted Schmidt's book but balked at the price !

    I found a useful paper he co-wrote


    eac_guidelines_2_final.pdf,

    EAC Guidelines for the use of Geophysics in

    Archaeology: Questions to Ask and Points to Consider.

    Item Type Report

    Authors Schmidt, Armin R.; Linford, P.; Linford, N.; David, A.; Gaffney,

    Christopher F.; Sarris, A.; Fassbinder, J.


    MK

    • Cancel
    • Vote Up +3 Vote Down
    • Sign in to reply
    • Cancel
  • davemartin
    davemartin over 5 years ago in reply to michaelkellett

    Thanks Michael.


    Firstly, the Frobisher I understand does offer ‘left-handed’ and ‘right-handed’ operation – but doesn’t rotate the display, it just has two sets of five buttons (probably wired in parallel I guess) so it doesn’t really deliver what I described above. From the Frobisher TAR-3 manual “The two sets of buttons have the same functions and are for left or right-handed use”.


    In various posts earlier there is mention of variable oscillators etc. etc. and adverse comment on square wave excitation. I think there may be some misconceptions. The measurements are performed in DC, and it is measuring resistance, not impedance. Whilst technically it is a square wave, a better way to view it is DC with periodically-reversing polarity. If pure DC is used, any electrolyte in the soil (which is a necessary precursor for sufficient current to flow and a potential to be measured) can become polarised around the electrodes. Measurements are made within the steady portion of each DC excursion, be it +ve or –ve going. There’s no need for variable frequency oscillators or synchronous filter or digital or analogue synthesis etc. I’m not actually convinced you even need a D-to-A other than as an easy way to generate controllable square-wave with mild variation in frequency (say 40 – 137 Hz) and voltage up to, say, +/- 60v. These frequencies are really within just bit-flipping scope. Voltage doesn’t change on-the-fly necessarily so very simple requirements.


    The switching frequency can be changed on some kit, but a good default is 137Hz as mentioned earlier, as it doesn’t beat (for long at least) with 50 or 60 Hz mains. There are times though where you may want to pick a lower frequency if there’s no mains interference in the ground (more on that below).


    Sequence of operation at each point is:

    • Operator drops probe frame onto the ground and probes penetrate ground
    • Readings are being taken continuously, but until steady, they are discarded. This means recording auto-starts when good contact is made, irrespective of how long since frame lifted from previous point, and without need to press a trigger as in EPE project.
    • Readings taken and averaged, when sufficiently consistent, reading is accepted, stored and ‘beep’ sounded to tell operator OK to move to next point.


    Within each measurement, there is a hold-off or delay from the leading edge of the ‘square wave’ to allow settling, before starting to take readings. In some isolated conditions, the readings don’t settle within the width of the DC pulse (say a bit over 3ms for 137Hz), so some rigs offer the option to – in electrically quiet areas – select say 40 Hz to give up to 12ms for the signal to settle.


    Dave

    • Cancel
    • Vote Up +4 Vote Down
    • Sign in to reply
    • Cancel
  • shabaz
    shabaz over 5 years ago in reply to davemartin

    Hi Dave,


    The proposed design meets these requirements, the principle of the design is identical to the EPE article (i.e. the block diagram at the top of this post in Ken's discussion), however the proposed design does the majority of it digitally. The waveform can be a square wave, or any waveform, and the end result will come out the same - just more accurate with a sine-wave since there's less to filter. But, if desired, the waveform can be set to a square wave, with no hardware changes, because the FPGA bitfile is encoded with the waveform (Edit: could even be software configurable in theory). By having this arbitrary capability, there's re-use for other projects/purposes too - for instance, scenarios where a deliberate bias may be wanted (i.e. AC riding on DC) - no problem for this new proposed design just by changing the waveform. (I'm not saying anyone would ever do that, but the possibility exists to do it in code.) So, there's nothing to stop it being put into a mode where you cannot tell the difference in the output waveform from this design, or the EPE design, nor anything stopping the algorithm being identical to the EPE one. The archaeology requirements have to drive the design otherwise it would be useless, so your user requirements are critical.

    Similarly, although some of the comments discuss impedance, this is purely a software configuration issue. The hardware can measure and output a value that should match any other meter, but optionally it can be set to measure impedance too. Likewise, at zero cost, the frequency can be changed to one of many values, so 40 Hz square wave is no issue. The impedance could be handy for soil or liquid measurements for home agriculture, but can be totally turned off so that the output from the device via serial will be compatible with Snuffler, and provide the same values that the EPE meter would, since the block diagram and circuit is available for that. As you say, the system will repeatedly take measurements and store when stable.

    The proposed design does everything the EPE design does, but hopefully better and with more relevant features, with these requirements that are coming in from you, Ken, Paul and hopefully others.

    • Cancel
    • Vote Up +3 Vote Down
    • Sign in to reply
    • Cancel
element14 Community

element14 is the first online community specifically for engineers. Connect with your peers and get expert answers to your questions.

  • Members
  • Learn
  • Technologies
  • Challenges & Projects
  • Products
  • Store
  • About Us
  • Feedback & Support
  • FAQs
  • Terms of Use
  • Privacy Policy
  • Legal and Copyright Notices
  • Sitemap
  • Cookies

An Avnet Company © 2025 Premier Farnell Limited. All Rights Reserved.

Premier Farnell Ltd, registered in England and Wales (no 00876412), registered office: Farnell House, Forge Lane, Leeds LS12 2NE.

ICP 备案号 10220084.

Follow element14

  • X
  • Facebook
  • linkedin
  • YouTube