element14 Community
element14 Community
    Register Log In
  • Site
  • Search
  • Log In Register
  • Community Hub
    Community Hub
    • What's New on element14
    • Feedback and Support
    • Benefits of Membership
    • Personal Blogs
    • Members Area
    • Achievement Levels
  • Learn
    Learn
    • Ask an Expert
    • eBooks
    • element14 presents
    • Learning Center
    • Tech Spotlight
    • STEM Academy
    • Webinars, Training and Events
    • Learning Groups
  • Technologies
    Technologies
    • 3D Printing
    • FPGA
    • Industrial Automation
    • Internet of Things
    • Power & Energy
    • Sensors
    • Technology Groups
  • Challenges & Projects
    Challenges & Projects
    • Design Challenges
    • element14 presents Projects
    • Project14
    • Arduino Projects
    • Raspberry Pi Projects
    • Project Groups
  • Products
    Products
    • Arduino
    • Avnet & Tria Boards Community
    • Dev Tools
    • Manufacturers
    • Multicomp Pro
    • Product Groups
    • Raspberry Pi
    • RoadTests & Reviews
  • About Us
  • Store
    Store
    • Visit Your Store
    • Choose another store...
      • Europe
      •  Austria (German)
      •  Belgium (Dutch, French)
      •  Bulgaria (Bulgarian)
      •  Czech Republic (Czech)
      •  Denmark (Danish)
      •  Estonia (Estonian)
      •  Finland (Finnish)
      •  France (French)
      •  Germany (German)
      •  Hungary (Hungarian)
      •  Ireland
      •  Israel
      •  Italy (Italian)
      •  Latvia (Latvian)
      •  
      •  Lithuania (Lithuanian)
      •  Netherlands (Dutch)
      •  Norway (Norwegian)
      •  Poland (Polish)
      •  Portugal (Portuguese)
      •  Romania (Romanian)
      •  Russia (Russian)
      •  Slovakia (Slovak)
      •  Slovenia (Slovenian)
      •  Spain (Spanish)
      •  Sweden (Swedish)
      •  Switzerland(German, French)
      •  Turkey (Turkish)
      •  United Kingdom
      • Asia Pacific
      •  Australia
      •  China
      •  Hong Kong
      •  India
      • Japan
      •  Korea (Korean)
      •  Malaysia
      •  New Zealand
      •  Philippines
      •  Singapore
      •  Taiwan
      •  Thailand (Thai)
      • Vietnam
      • Americas
      •  Brazil (Portuguese)
      •  Canada
      •  Mexico (Spanish)
      •  United States
      Can't find the country/region you're looking for? Visit our export site or find a local distributor.
  • Translate
  • Profile
  • Settings
Wireless
  • Technologies
  • More
Wireless
Blog Tektronix MDO4000 Series Review
  • Blog
  • Forum
  • Documents
  • Polls
  • Quiz
  • Events
  • Mentions
  • Sub-Groups
  • Tags
  • More
  • Cancel
  • New
Join Wireless to participate - click to join for free!
  • Share
  • More
  • Cancel
Group Actions
  • Group RSS
  • More
  • Cancel
Engagement
  • Author Author: gervasi
  • Date Created: 10 Feb 2013 4:56 AM Date Created
  • Views 743 views
  • Likes 1 like
  • Comments 2 comments
  • mixed_domain_oscilloscopes
Related
Recommended

Tektronix MDO4000 Series Review

gervasi
gervasi
10 Feb 2013

Tektronix recently let me test their MDO4000 mixed-domain scope.  I talked to them about it two months ago.  I thought they forgot about it, but after the winter holidays a brand-new-looking MDO4014-3 arrived at my company with no letter or explanation.  image


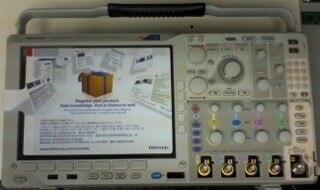
The MDO4000 series is mixed-domain because it has a spectrum analyzer input in addition to the normal time-domain inputs.  You can trigger off any of the inputs or spectrum analyzer.  From a triggering standpoint, the spectrum analyzer is another trace on the scope.


The lack of a zero-span turns out to be the most amazing thing about the spectrum analyzer.  I attempted to enter a span of zero, and it gave me 1kHz.  At first I thought thatu like the VIA Echo it simply lacked zero-span.  It turns it doesn’t need it because you can view amplitude in the time domain and scroll along a window in the time-domain and see the entire spectrum during that window. 


I put an antenna on it and monitored the Wi-Fi signals in my office.  Using an older spectrum analyzer, I would look at it with max hold and resolution bandwidth of around 1 MHz.  Eventually the sweep would cover all segments of the 20-MHz-wide Wi-Fi signal, and I’d get an idea what its spectrum looks like.  To get time-domain info, I would set the analyzer to zero-span and set the resolution bandwidth (RBW) to maximum.  If max RBW is 5 MHz but I know the signal I’m looking for is 20 MHz wide, I’d know my time-domain results will be 6dB down (i.e. 25%) of the actual signal strength.  With the MDO4000, however, I can see the time-domain representation of signal strength in the top window.  I can stop triggering and then scroll the window of time period whose spectrum I want to look at. 


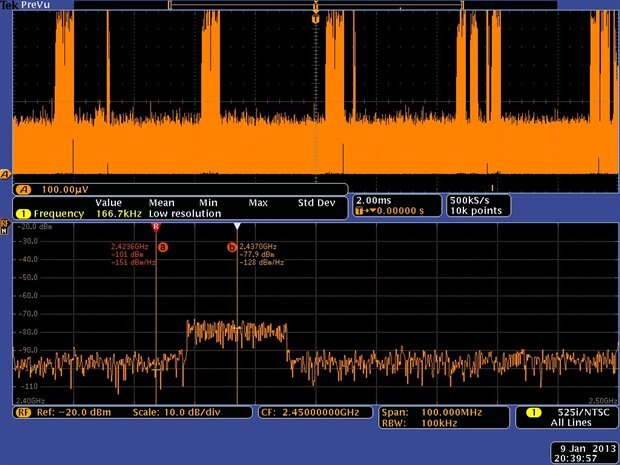
Look at this plot taken during a Wi-Fi packet.  Note the tiny indicator below the time-domain plot showing the time period the spectrum analyzer is analyzing.


image


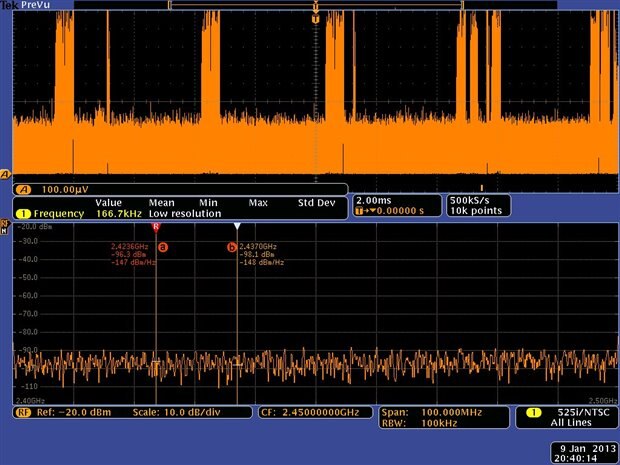
Now look below at that the spectrum when I’ve scrolled the time period to an area between Wi-Fi packets.  (The little dot is under a segment of the time domain with low signal strength.)

image

You can get this info in the spectrogram mode too.  This clearly works in my testing, but I felt like I got a much better feel for the spectrum when I scrolled manually in the time domain and watch the spectrum change.


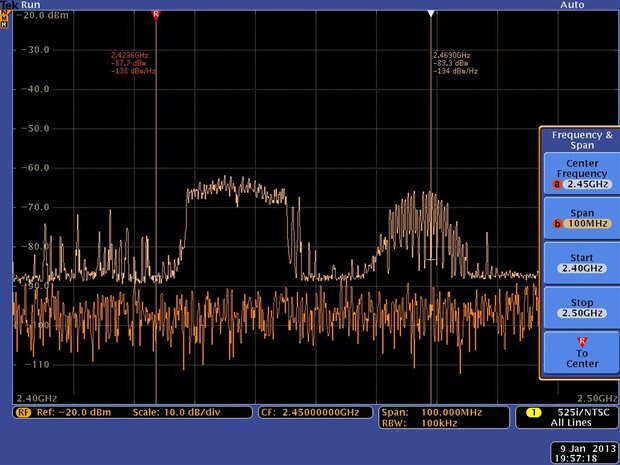
I still found myself using peak hold.  When I had it in free running mode, I could see that it didn’t capture the whole spectrum of brief packets.  The peak hold is a different color, making it easy to distinguish peak from current values. 


image


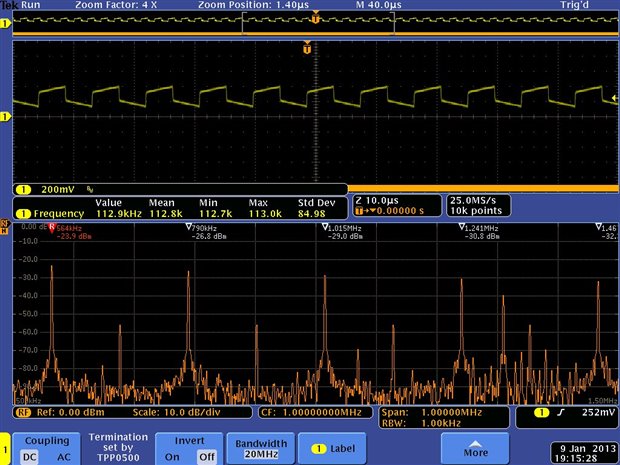
At one point I put the same signal, a sloppy square wave, into a time-domain port and the spectrum analyzer port.  You can see the square wave and its frequency-domain harmonics.


image


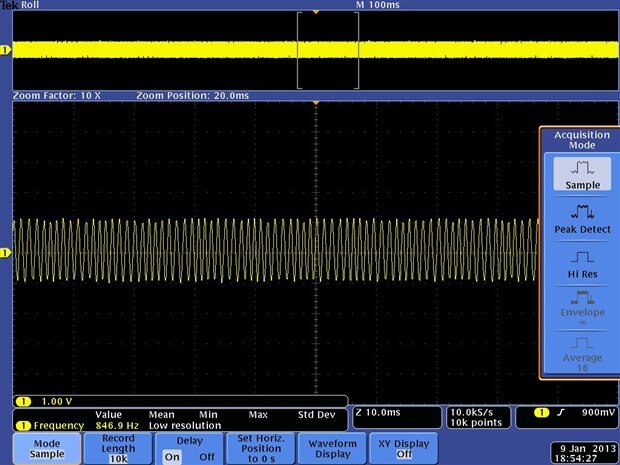
I tired to make it alias on a 1MHz signal by setting the sweep rate way to low.  Only a narrow range of settings, far from the correct sweep rate, resulted in aliasing.  You can see it aliasing below.


image


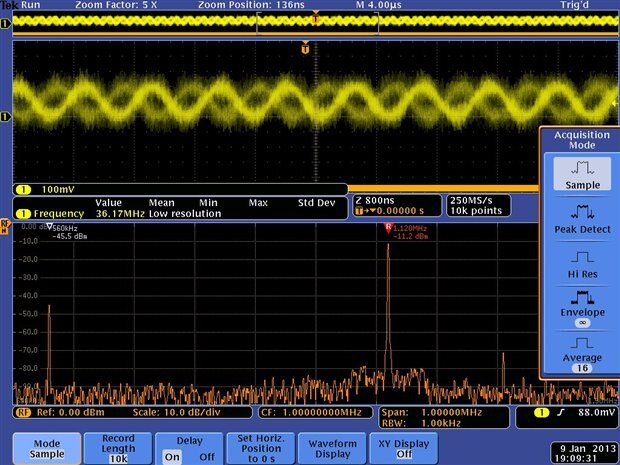
Look at this noisy 1 MHz signal. 


image


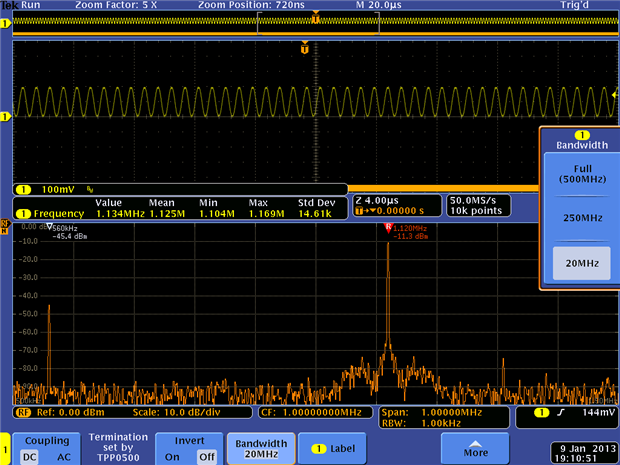
When I turn the band limit feature on, it looks the same as on my old analog scope. 


image


When you’ve stopped triggering, you can zoom in and out on the waveform and scroll left and right using the large Wave Inspector knob.  At first I thought this was a gimmick for people who don’t know to turn the sweep rate and x-position controls.  It turns out to be an easier way to move around.  The only complaint I had is that this control is larger than the sweep rate control. 


It comes with PC software to control the unit and act as a display, but in my brief testing I found it no better than using the UI.  This is in complete contrast to VIA Echo spectrum analyzer, which has a primitive UI on the unit and has PC software that displays much better detail. 


The only negative thing about this scope is sometimes lags behind user actions by what felt like more than a second.  It’s usually not noticeable, but sometimes it was confusing because it felt like turning a knob had no effect until a second later the scope responds to a knob adjustment and two keystrokes. 


Conclusion

Every employer and client working for whom I’ve worked on RF projects has had an HP spectrum analyzer from the 80s.  Using MDO4000 is a completely different experience.  Moderns spectrum analyzers have the features like a different color for peak hold, but this is the only scope I’ve used that lets you trigger on a time domain signal and look at the spectrum. 


The most basic version, 100MHz time-domain / 3GHz spectrum analyzer, sells for under $12,000.  This is not that much more than a decent spectrum analyzer plus a decent scope.  If you need a scope and a spectrum analyzer, it’s definitely worthwhile to get an MDO4000 series scope. 


(Note: I tested the scope and wrote this article before I knew that Newark carried it.  I have only talked to Tektronix about it as described at the beginning of the post.)

  • Sign in to reply
  • gervasi
    gervasi over 12 years ago in reply to DAB

    It did come with a USB cable and computer software.  In my testing, the software simply displayed the same info you could get on the screen.  There may be a way to store to data.  That could be tricky because the scope must collect data very fast. 


    It also has the typical USB port for a BOMS Flash drive.  I only used this to capture screen shots and save settings.  You can save trace data, but I didn't try it. 


    I didn't notice it having a longer run of time when I tested it in single-trigger mode, BUT the waveform analyzer knob makes it very easy to move around the data stored from a trigger.  You can also change the sample rate and get a longer period of time that way. 

    • Cancel
    • Vote Up 0 Vote Down
    • Sign in to reply
    • More
    • Cancel
  • DAB
    DAB over 12 years ago

    Nice review.

    I like the combination of the spectrum analyzer integrated with the scope.  From your description, I am assuming that it comes with a good size memory for storing the collected data.


    Did it come with a USB connection so that you could slave it to a PC?  It sounds like it would be a really useful measurement instrument if you could collect and off load collected data at a reasonable speed.


    Just a thought,

    DAB

    • Cancel
    • Vote Up 0 Vote Down
    • Sign in to reply
    • More
    • Cancel
element14 Community

element14 is the first online community specifically for engineers. Connect with your peers and get expert answers to your questions.

  • Members
  • Learn
  • Technologies
  • Challenges & Projects
  • Products
  • Store
  • About Us
  • Feedback & Support
  • FAQs
  • Terms of Use
  • Privacy Policy
  • Legal and Copyright Notices
  • Sitemap
  • Cookies

An Avnet Company © 2025 Premier Farnell Limited. All Rights Reserved.

Premier Farnell Ltd, registered in England and Wales (no 00876412), registered office: Farnell House, Forge Lane, Leeds LS12 2NE.

ICP 备案号 10220084.

Follow element14

  • X
  • Facebook
  • linkedin
  • YouTube