element14 Community
element14 Community
    Register Log In
  • Site
  • Search
  • Log In Register
  • About Us
  • Community Hub
    Community Hub
    • What's New on element14
    • Feedback and Support
    • Benefits of Membership
    • Personal Blogs
    • Members Area
    • Achievement Levels
  • Learn
    Learn
    • Ask an Expert
    • eBooks
    • element14 presents
    • Learning Center
    • Tech Spotlight
    • STEM Academy
    • Webinars, Training and Events
    • Learning Groups
  • Technologies
    Technologies
    • 3D Printing
    • FPGA
    • Industrial Automation
    • Internet of Things
    • Power & Energy
    • Sensors
    • Technology Groups
  • Challenges & Projects
    Challenges & Projects
    • Design Challenges
    • element14 presents Projects
    • Project14
    • Arduino Projects
    • Raspberry Pi Projects
    • Project Groups
  • Products
    Products
    • Arduino
    • Avnet Boards Community
    • Dev Tools
    • Manufacturers
    • Multicomp Pro
    • Product Groups
    • Raspberry Pi
    • RoadTests & Reviews
  • Store
    Store
    • Visit Your Store
    • Choose another store...
      • Europe
      •  Austria (German)
      •  Belgium (Dutch, French)
      •  Bulgaria (Bulgarian)
      •  Czech Republic (Czech)
      •  Denmark (Danish)
      •  Estonia (Estonian)
      •  Finland (Finnish)
      •  France (French)
      •  Germany (German)
      •  Hungary (Hungarian)
      •  Ireland
      •  Israel
      •  Italy (Italian)
      •  Latvia (Latvian)
      •  
      •  Lithuania (Lithuanian)
      •  Netherlands (Dutch)
      •  Norway (Norwegian)
      •  Poland (Polish)
      •  Portugal (Portuguese)
      •  Romania (Romanian)
      •  Russia (Russian)
      •  Slovakia (Slovak)
      •  Slovenia (Slovenian)
      •  Spain (Spanish)
      •  Sweden (Swedish)
      •  Switzerland(German, French)
      •  Turkey (Turkish)
      •  United Kingdom
      • Asia Pacific
      •  Australia
      •  China
      •  Hong Kong
      •  India
      •  Korea (Korean)
      •  Malaysia
      •  New Zealand
      •  Philippines
      •  Singapore
      •  Taiwan
      •  Thailand (Thai)
      • Americas
      •  Brazil (Portuguese)
      •  Canada
      •  Mexico (Spanish)
      •  United States
      Can't find the country/region you're looking for? Visit our export site or find a local distributor.
  • Translate
  • Profile
  • Settings
Experimenting with Vibration Sensors
  • Challenges & Projects
  • Design Challenges
  • Experimenting with Vibration Sensors
  • More
  • Cancel
Experimenting with Vibration Sensors
Blog Experimenting with Vibration Sensors - Characterize RPM of Spinning Devices #4 (Detect Spinning Fan Obstructions)
  • Blog
  • Forum
  • Documents
  • Polls
  • Files
  • Events
  • Mentions
  • Sub-Groups
  • Tags
  • More
  • Cancel
  • New
  • Share
  • More
  • Cancel
Group Actions
  • Group RSS
  • More
  • Cancel
Engagement
  • Author Author: zst123
  • Date Created: 26 Dec 2020 5:15 AM Date Created
  • Views 1329 views
  • Likes 3 likes
  • Comments 3 comments
Related
Recommended

Experimenting with Vibration Sensors - Characterize RPM of Spinning Devices #4 (Detect Spinning Fan Obstructions)

zst123
zst123
26 Dec 2020

Experiment 2 (Detect Spinning Fan Obstructions)


This is a continuation of Experiment 1

Experimenting with Vibration Sensors - Characterize RPM of Spinning Devices #3 (Initial Setup & Tapping Experiment)


Please read my other blog posts too if you haven't

Experimenting with Vibration Sensors - zst123's Blog Posts


Objective


This experiment is of intermediate difficulty.

Previously I faced speed limitations when using the Arduino Graph Plotter and today I will create my own using Python PyQt.

After which, it is possible to do detailed analysis.

I will demonstrate an example use-case application to detect obstructions in spinning fans.


Setup (A faster PyQt Graph Plotter)


Using a faster graph will make it possible to do some detailed analysis.


I have written instructions on my GitHub page on how to set it up. You will need to install some dependencies like Python 3, PyQt, PySerial.

image


I have documented it all on my GitHub page. You can download my graph plotter program here

  • https://github.com/zst123/Element14_Vibration-Sensor-Experiments/tree/master/Experiment2


I have also updated the Mbed code for the microcontroller, the main changes are in red. The changes are necessary because I have removed the 100ms delay, and also increased the serial port baud rate so that the data can transfer to the PC faster.


#include "mbed.h"


static UnbufferedSerial serial_port(USBTX, USBRX, 57600);


AnalogIn sensor(A0);

DigitalOut green_led(LED1);

DigitalOut red_led(LED3);


int main() {

    char buffer[50];

    const uint16_t lower_threshold = 32768 - 7000;

    const uint16_t upper_threshold = 32768 + 7000;


    while(1) {

        uint16_t reading = sensor.read_u16();


        if (lower_threshold < reading && reading < upper_threshold) {

            green_led = true;

            red_led = false;

        } else {

            green_led = false;

            red_led = true;

        }

        int length = snprintf(buffer, 50, "%d\n", reading);

        serial_port.write((uint8_t *) buffer, length);

   }

}


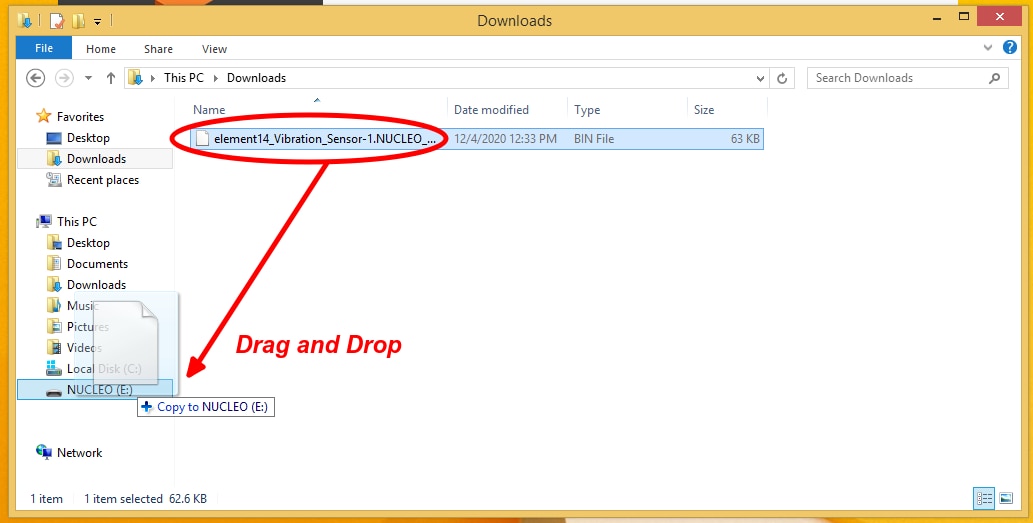
Compile and drag & drop to program your board again.

image


Connect the board and run the Python 3 program in a Terminal.

image


The graph will appear instantly on the PC.

image


Test Results


Here’s a video of me testing the vibration sensor on a PyQT graph plot. It is extremely smooth!

You don't have permission to edit metadata of this video.
Edit media
x
image
Upload Preview
image


Tapping on the sensor, it is now very easy to distinguish the profile of the tap waveform, between harder taps and softer taps.

image


From here we can realise how powerful the vibration sensor is if you can sample with a fast enough microcontroller.


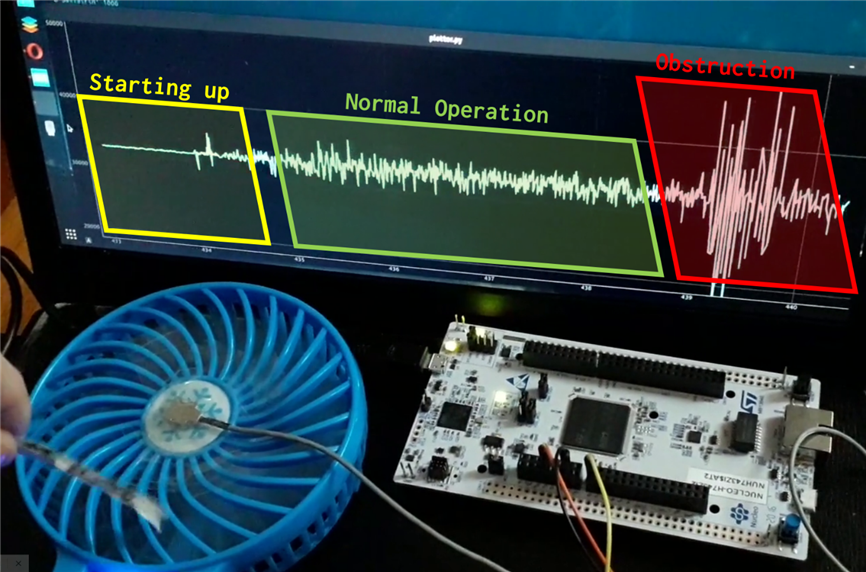
Application – Detect Fan Obstructions

The idea for this application comes from the fact that an ideal fan will produce little vibrations when running smoothly. When there is an obstruction to the fan blades, more vibrations and sound will be produced.

image

I will use this handheld fan I found at home. I simply attached the sensor to the middle of the fan.

image


Here is a video of it in normal operation. There are 3 fan speeds and the amplitude of vibrations also increases slightly.

You don't have permission to edit metadata of this video.
Edit media
x
image
Upload Preview
image


When there is an obstruction, we observe a large amplitude on the graph. The red LED turns on due to the threshold.

You don't have permission to edit metadata of this video.
Edit media
x
image
Upload Preview
image


Continuous moments can be seen when a fan is spinning. And obstructions can cause a big spike in vibrations.

image


Conclusion


Today, I learnt that indeed this vibration sensor by Kemet is very sensitive even to small vibrations. There is a consistent pattern of vibration in normal operation that can be observed.

When there is an obstruction, the fan blades rub against the paper which amplifies the effects of the vibration. Hence, by detecting the amplitude, an obstruction detector application is possible.


The hardware setup is pretty much done and I will focus on collecting different data sets next time.

In the next post, I will experiment towards my goal of characterizing RPMs of spinning devices.


If you have any issues following through, please let me know and I will elaborate more next time. Leave your suggestions in the comments for what I should try out next!

  • Sign in to reply

Top Comments

  • neuromodulator
    neuromodulator over 4 years ago +1
    What sampling rate are you getting?
  • zst123
    zst123 over 4 years ago in reply to neuromodulator +1
    Good question. I decided to add some code to calculate for me the sampling rate. I added this line inside the receive callback. I'm actually seeing around 980 Hz quite consistently. print("Frequency",…
  • neuromodulator
    neuromodulator over 4 years ago in reply to zst123

    From the video I had the feeling that you were getting aliasing, but 980 Hz should be good as long as its regular.

    • Cancel
    • Vote Up 0 Vote Down
    • Sign in to reply
    • More
    • Cancel
  • zst123
    zst123 over 4 years ago in reply to neuromodulator

    Good question. I decided to add some code to calculate for me the sampling rate.

    I added this line inside the receive callback. I'm actually seeing around 980 Hz quite consistently.


    print("Frequency", (len(axis_time)-1) / (axis_time[-1]-axis_time[0]))


    Which means in theory I can do a Fourier transform analysis of up to 490 Hz. I understand that this microcontroller can go a lot faster. Right now I'm using Mbed to program it which is quite a heavy library. Probably I can optimise it by coding bare metal and changing from UART serial to USB communication instead. But it's a lot of work and 490 Hz should be more than sufficient for my tests around my home for now. What do you think?

    • Cancel
    • Vote Up +1 Vote Down
    • Sign in to reply
    • More
    • Cancel
  • neuromodulator
    neuromodulator over 4 years ago

    What sampling rate are you getting?

    • Cancel
    • Vote Up +1 Vote Down
    • Sign in to reply
    • More
    • Cancel
element14 Community

element14 is the first online community specifically for engineers. Connect with your peers and get expert answers to your questions.

  • Members
  • Learn
  • Technologies
  • Challenges & Projects
  • Products
  • Store
  • About Us
  • Feedback & Support
  • FAQs
  • Terms of Use
  • Privacy Policy
  • Legal and Copyright Notices
  • Sitemap
  • Cookies

An Avnet Company © 2025 Premier Farnell Limited. All Rights Reserved.

Premier Farnell Ltd, registered in England and Wales (no 00876412), registered office: Farnell House, Forge Lane, Leeds LS12 2NE.

ICP 备案号 10220084.

Follow element14

  • X
  • Facebook
  • linkedin
  • YouTube