Representing data on the map
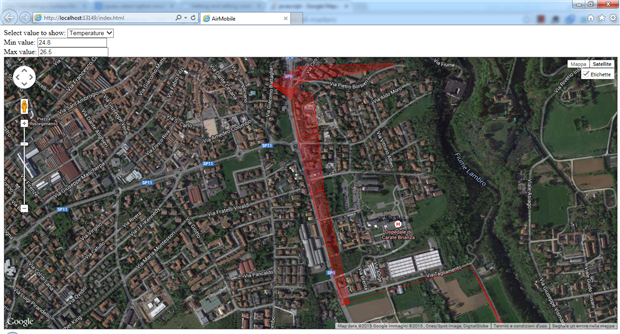
In this post I will talk about the representation of data collected by AirMobile on a map. Representing data o the map is the easiest way to understand the locations to avoid when doing outdoor activities. The solution I was thinking of is to draw a vertical line on the map at the position where the sample was taken. The height of the line is proportional to the sample value.
To implement this feature, some technical background about Google Maps is required
Overlay
In order to determine the screen coordinate of a given location (expressed in terms of latitude and longitude), an overlay is required. To create an overlay,
overlay = new google.maps.OverlayView();
 overlay.draw = function () { };
              overlay.setMap(map);
Map projection
After the overlay is created, a projection object is required in order to perform the conversion. The projection can be obtained by calling the projection.getProjection() method. However, the getProjection() method returns undefined when the map is not ready on the screen. For this reason, a event listener is installed waiting for the map entering the 'idle' state. When the map is in the 'idle' state, we are sure that the getProjection() method returns a valid projection.
After the projection is available, values can be drawn
// Wait for idle map
 google.maps.event.addListener(map, 'idle', function () {
 // Get projection
 projection = overlay.getProjection();
 setTimeout(loadData, 100);
 });
Getting data values
To get data values from the AirVantage cloud, I leveraged the jQuery's ajax object
loadData = function () {
 var dataIds = "airmobile_" + measure + ".value," +
                            "airmobile_" + measure + ".latitude," +
                            "airmobile_" + measure + ".longitude";
 $.ajax({
 url: "https://na.airvantage.net/api/v1/systems/data/raw" +
 "?access_token=" + accessToken +
 "&dataIds=" + dataIds +
 "&targetIds=" + systemUid,
 success: function (data, status, jqXhr) {
                    // data returned successfully
 }
 });
Scaling sample values
Raw values should be scaled to get the height (in pixels) of the polygon to draw. I found out 50 pixels in height to give good readability to the graph. In order to make evident changes in the values, I first find the minimum and maximum values in the array of samples returned by the AirVantage cloud, and I show these limits in the upper left corner of the page in order for the user to understand the graph scale. Minimum and maximum values are then used to calculated the height of the polygon by means of the following function
mapPixels= function(value, min, max) {
      var delta = max - min;
      var deltaPixels = 50;

      var pixels = deltaPixels / delta * value;
      return pixels;
};
Converting latitude and longitude to screen coordinates
The projection object has a convenient method to convert the latitude and longitude into screen coordinates. So it's easy to implement an helper function
convertCoords = function (lat, lon) {
      return projection.fromLatLngToContainerPixel(new google.maps.LatLng(lat, lon));
};
Drawing the polygon
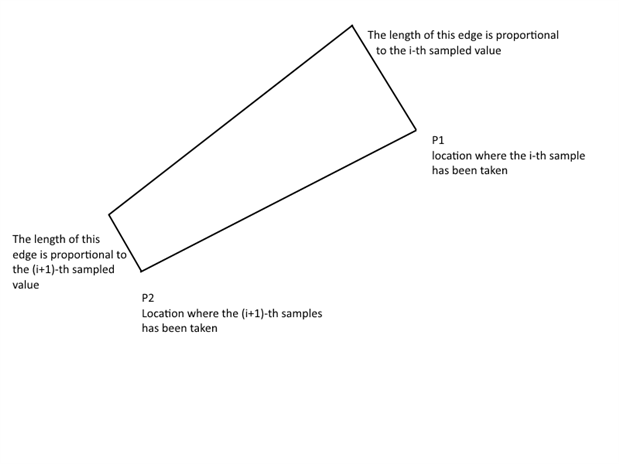
To draw the polygon, some geometry is required. The polygon I want to draw has four vertexes: two are included in the AirVantage's response. The other two points are on the perpendicular line passing through each of these two points, as shown in picture
Line between two points equation
The equation for the line between two points (in explicit form) is
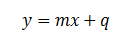
Being p1 and p2 two points, we can determine m and q using the code below
var value1 = values[i];
var value2 = values[i + 1];
var p1 = convertCoords(value1.latitude, value1.longitude);
var p2 = convertCoords(value2.latitude, value2.longitude);

var m = (p1.y - p2.y) / (p1.x - p2.x);
var q = p1.y - (m * p1.x);
Perpendicular
The equation of the perpendicular line is
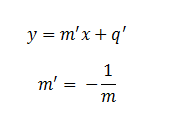
(where m is the value calculated in previous section)
So, the parameters of the two perpendicular lines can be calculated using the following code
var pm = -1 / m;
var pq1 = p1.y - (pm * p1.x);
var pq2 = p2.y - (pm * p2.x);
To compute the other point, I need to use the formula of the distance between a line and a point
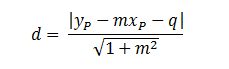
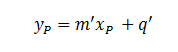
The coordinates of the point (YP, Xp) lays on the perpendicular line, so YP can also be written as
The distance from the line is given by
var d1 = mapPixels(value1.value, min, max);
Because I already have the distance, I can calculate the point coordinate using the previous formulas. The code is as follow
var x1 = (d1 * Math.sqrt(1 + (m * m)) - pq1 + q) / (pm - m);
var y1 = (pm * x1) + pq1;
Here is comes a small problem: hot to draw the polygon on the same side? The equation of the distance between a line and a point has an absolute value, which leads to two possible solutions. Which one do I have to choose? I experimented with the normal of the polygon...
Surface normal
The normal vector to a surface is a vector which is perpendicular to the tangent plane to the surface. A surface normal for a polygon can be calculated by taking the vector cross product of all edges of that polygon. The order of the vertices used in the calculation will affect the direction of the normal (in or out of the face). This latter property of the surface normal is the one I want to use to try to draw all the polygons on the same side of the path determined by the samples positions
Because the polygon lies on the X-Y plane, I can just compute the Z component of the normal vector
computeNormal = function(p1, p2, p3, p4) {
      var nz = 0;

      var vertexes = [p1, p2, p3, p4];
      for (var i=0; i<vertexes.length-1; i++) {
            var curr = vertexes[i];
            var next = vertexes[i + 1];

            nz += (curr.x * next.x) * (curr.y * next.y);
      }

      return nz;
};
If the Z component is positive, I will select the other solution of the equation and re-calculate the polygon points using the new formula
var x1 = (d1 * Math.sqrt(1 + (m * m)) - (-pq1 + q)) / (- (pm - m));
var y1 = (pm * x1) + pq1;
Screenshot
This is the first version of the AirMobile data visualization page. To be improved, but the foundations are there...