Multi-day garden measurement
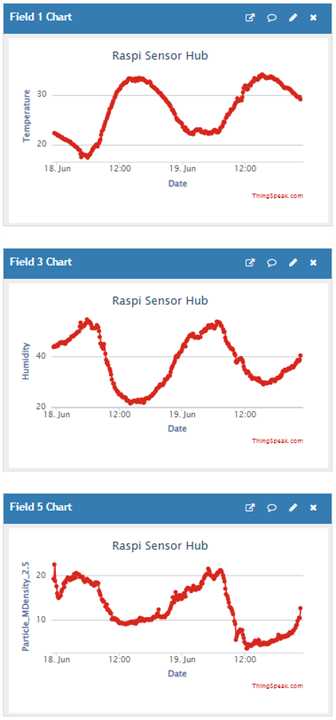
I ran the sensor in continuous operation in the garden last weekend including the following Monday. Unfortunately, I did not set the graph in Thingspeak to show more than 2 days.

Interestingly, we have a wavy pattern throughout the day for both humidity (measured by the BME680 Bosch sensor) and the fine dust sensor. There is a correlation here between moisture and the measured particles. For this, I inquired the manufacturer Sensirion and also immediately received an answer:
"This is a known phenomenon. In professional PM2.5 measuring stations based on the optical measuring principle, the air drawn in is therefore heated to prevent dew. Above a certain humidity, clumping of very small particles also occurs, which then affects the measurement."
So we have to remember that the SPS30 sensor value data is sensitive to humidity.
How about some spray with deodorant, how bad can it be?
In the evening I did a measurement in the bathroom. I was interested in how high the fine dust load can become with a deodorant spray and how fast this load is reduced again.
The particle density value spikes very fast to over 125 µg/m³, and plateaus to around 100 µg/m³. Since the value did not decrease at all, I activated a ventilation system 35min later - at 23:05 which significantly reduces the particles, to around 25 µg/m³.

It's very easy to exceed the WHO limits multiple times with sprays that you will find in one's household. Proper ventilation helps to reduce the fine particles.
<Update 30.06.23>
How about some toast sandwiches?
Today (the last day of the competition) we toasted some sandwiches with our sandwich toaster. The fine dust sensor quickly found unpleasant values here as well:

<End Update 30.06.23>
Data Filtering
Another point that I want to mention, is the data filtering within Thingspeak:
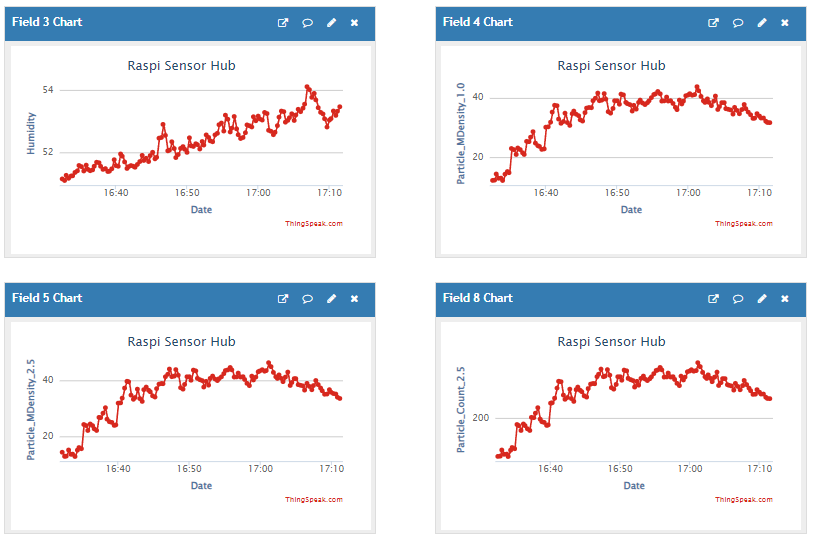
The sensor data can be a little bit noisy (with high temporal resolution):

and with a broader time scale:

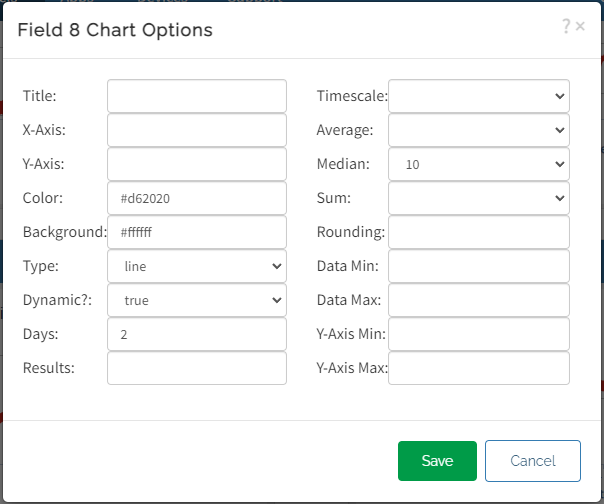
In these graphs, I have set a value smoothing, about the value Median: 10.

You can change the filtering by clicking the pencil symbol in the graph:

In the next article, I will summarize my projects: Link

-

DAB
-
Cancel
-
Vote Up
0
Vote Down
-
-
Sign in to reply
-
More
-
Cancel
Comment-

DAB
-
Cancel
-
Vote Up
0
Vote Down
-
-
Sign in to reply
-
More
-
Cancel
Children