


Title: Total Player Monitoring
By: Md. Kamrul Hussain
Project Category: Design Challenge
Project Name: Sudden Impact Wearables Design Challenge
Blog post: 07
Intro:
In my 3rd blog post [Part2.1 - Muscle activity [Calf Muscle]] I have proposed to use the AFE AD8232 to monitor EMG of calf muscles. From the EMG, if continuous strong contraction is detected then that can be identified as potential threat for muscle cramp. For that I need to use "wavelet analysis" [which is completely new to me] to develop an algorithm for detecting the criteria of myopathy, which follows Brief Small Amplitude Polyphasic Potentials [BSAP].
But I don't have much time to implement the algorithm as the design challenge is coming to its end. However, in this post, I am presenting the circuit design for monitoring the calf muscle EMG. This time it will act as only a muscle activity monitor. But, I can implement the algorithm with wavelet analysis later on, without changing the hardware.
Hardware:
AFE --> AD8232 with 7.2Hz to 2.28KHz bandwidth.
Gain --> 1100 [inamp = 100, filterout gain = 11]
RLD --> R7 has been used to limit the loop gain for DC or low frequencies.
Shield --> Electrode cables are shielded with RLD output. Bottom layer of the PCB on the AFE side is copper
filled with GND to reduce the noise
MCU --> a dsPIC33EP256 microcontroller is used to process the output signal from the AFE and to extract the amplitude variation of the compound action potential from the muscle, which will give us the magnitude of activity. It also controls the Bluetooth communication.
BLE --> RN4020 from microchip
PCB dimension --> 5.4cm x 3cm double layer
Circuit Diagram:
Analog Front End -->

MCU and BLE -->

Filter Design -->
- Two pole low pass filter
- With gain
- Sallen-Key topology
The high pass filter is kept unchanged from ECG AFE design [7.2Hz], as EMG signals has lower frequency components of about 10Hz.
For ECG, the low pass filter cut-off was designed at about 25 Hz. But EMG from surface electrodes can have higher frequency components of about 1KHz. We can get upto 10KHz from needle electrodes, but here we are using surface electrodes. That's why the filter cut-off is set to about 2.28KHz.

Transfer Function - G(s) = 2272727272.73 / (s2+20661.1570248s+206611570.248)
fC = 1/(2π√(R1 C1 R2 C2))
Gain = 1 + R3/R4

However, I have found that there is a mistake in the user guide of the AD8232 about the equation of 'Q'. It made me confused at first, but I have got the original one in the datasheet.
now for different value of R2 we get different fc and Q -
R2 = 2.2K
Cut-off frequency fc = 2287.69145929[Hz]
Quality factor Q = 0.695701085237
Damping ratio ζ = 0.71869946822
R2 = 1.5k
Cut-off frequency fc = 2770.53194272[Hz]
Quality factor Q = 1.91485421551
Damping ratio ζ = 0.261116483934
R2 = 1.8K
Cut-off frequency fc = 2529.13806886[Hz]
Quality factor Q = 1.04880884817
Damping ratio ζ = 0.476731294623
R2 = 1.8K matches the best with the Q of the original filter of AD8232 evaluation board for ECG [Q=1.43]. But I don't have the SMD 0805 version of 1.8K, so I have tried with 2.2K.
PCB:
The PCB design is the same as the ECG module, where only the passive component's values will be changed.

EMG Output:
As this design is intended for monitoring only the muscle activity [for the time being], the processing of the signal is kept pretty simple. The goal is to get rid of common 50Hz noise and emphasize the compound muscle action potential [MAP]. The amplitude of the compound MAPs represents the activity rate of the calf muscle.
The second order low pass filter [sallen key], implemented in the hardware, has a cut-off frequency of about 2.28KHz. But this will be needed when we'll work with wavelet analysis where the wide range of signal information will be needed for pattern recognition.
But for general activity monitor, we can get enough information far below 100Hz region. So, we'll implement filter with lower cutoff within firmware. After the Pre processing and conditioning part, we need to rectify the signal and apply a smoothing average filter which will significantly emphasize the MAP peaks. At the end different threshold limit can be implemented to differentiate between activity level depending on the amplitude of the processed MAP peaks.

Steps-->
- Pre processing [50Hz Bandstop]
- Conditioning [12Hz - 80Hz Bandpass]
- Rectify and emphasize [Differentiate + Square up]
- Smoothing [moving average with a certain time limit, which emphasize mainly MAP peaks]
- Amplitude threshold
** this experiment was performed placing the electrodes on my forearm. It helped me to easily demonstrate the output. But in real life, electrodes will be placed around calf muscle.


STEP01 [Pre processing]:
Filter -> FIR Bandstop [50Hz]
Order -> 32
Stopband1 -> 40Hz
Stopband2 -> 60Hz
Window -> Bartlett [triangle]


At first the input channel was kept open [floating with a wire attached] to check the performance of the filter against 50Hz. The RED plot represents input signal and the GREEN plot represents output signal.
Floating input Input wire touched by hand to get large 50Hz signal


It seems that the FIR filter successfully reduce the common 50Hz noise. Now the input is connected with the output of the EMG AFE and compared the signal output of the Notch filter for both resting and active condition.
Resting condition Muscle contraction


It slightly improves the signal by filtering out the 50Hz noise, but the high frequency components dominates the signal. For detecting the compound MAP peaks we don't need the higher frequency components. So, a Bandpass filter can do the job.
STEP02 [Condition]:
Filter -> FIR Bandpass
Order -> 32
PassBand1 -> 12Hz
Passband2 -> 80Hz
Window -> Bartlett [triangle]
Filter response -

Filter output at resting condition At contraction At strong contraction


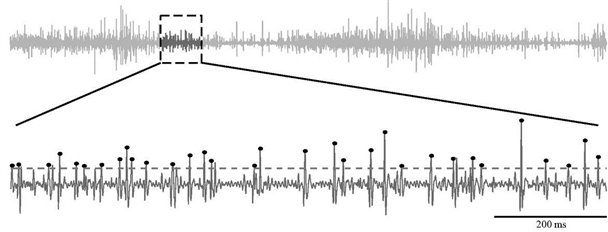
STEP03 [Rectify and Emphasize]:
After conditioning the signal, the compound MAP peaks are visible. By differentiating and squaring up, we can rectify the signal so that all the changes in amplitude stays in positive zone. It also emphasize the peaks to be significantly extracted.
At resting condition At contraction


STEP04 [Smoothing]:
The rectified and emphasized output actually differentiate between lower and higher muscle activity. But it gives too much variation and several peaks stays in an active region where the overall intensity or strength of the activity depends upon the consecutive no. of peaks too. So, its better if we can apply a moving average filter with a certain time period, that can implies all the peaks in a certain activity zone. It will also help us to implement the amplitude threshold.
At resting condition At contraction


Close view -


But for calf muscle I have got large peaks which get out of the range easily when I have tried to make some jumps and stretching to put some load on my calf muscle.. This is because the raw EMG captured for calf muscle have higher amplitude than forearm. Therefore, I may need to reduce the gain of the Lowpass filter in hardware, so that the final output of the system stays in between the dynamic range.


STEP06 [Amplitude threshold]:
just for experiment, an LED was turned on only when the detected peaks crossed the 80% of the highest limit.

Mounting:
The small form factor of the designed PCB gives the advantage of placing the module into a 'shin guard' for soccer / football players or 'knee pad' for basketball and other sports.

