


Hello Everyone, this is another update on my "Wearable Sudden Impact and Health Monitor" project.
In my previous update I showed how I connected the Analog Devices EVAL-ADXL375Z module to an Arduino nano and how I measured a physical impact using a small app that I wrote in Android Studio. This app received the acceleration x, y, and z axis recordings of the ADXL375 accelerometer and it converts them into G units and displays them the screen.
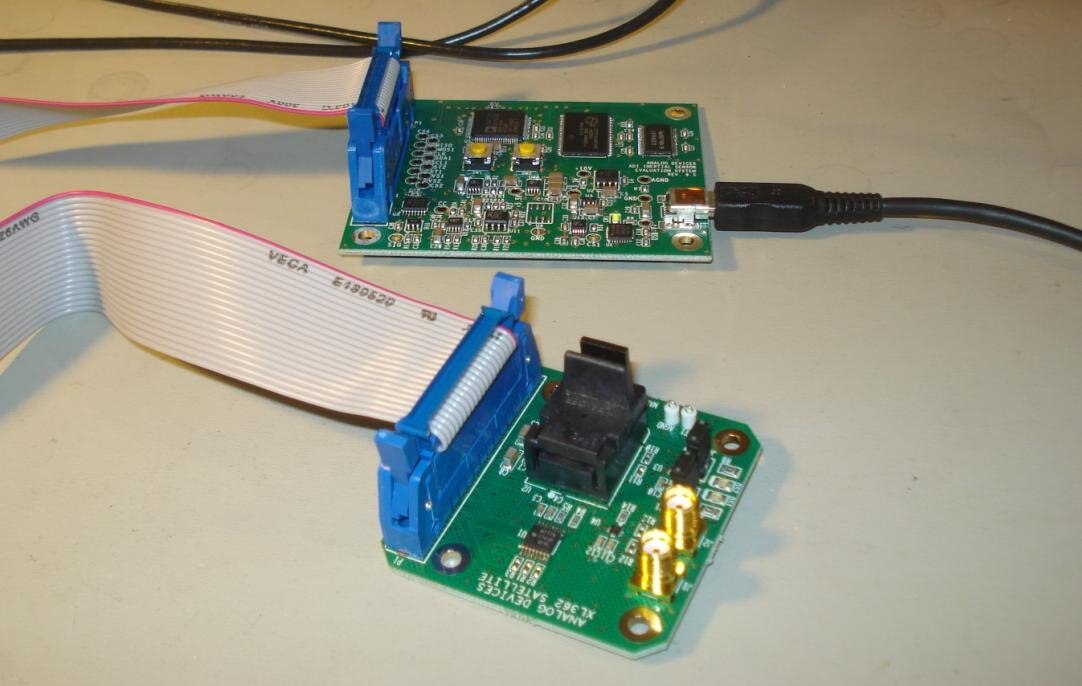
Interestingly, as it has been mentioned by hlipka in the comments, my measured values exceeded the ADXL375 spec of maximum 200g. So I have spent some time to verify how I converted the raw data into g units, and I came to the conclusion that my calculations are correct. So I came to the hypothesis that maybe my ADXL-375 measures more than 200g. To test my hypothesis I plugged in the other evaluation kit for ADXL-375 that I have, EVAL-ADXL3745Z-M, which runs trough a GUI provided by Analog Devices, so I exclude any potential calculation errors that I could make. Also, this kit uses a different ADXL-375 sensor chip than I used in my previous experiments. Here is a picture of that setup:
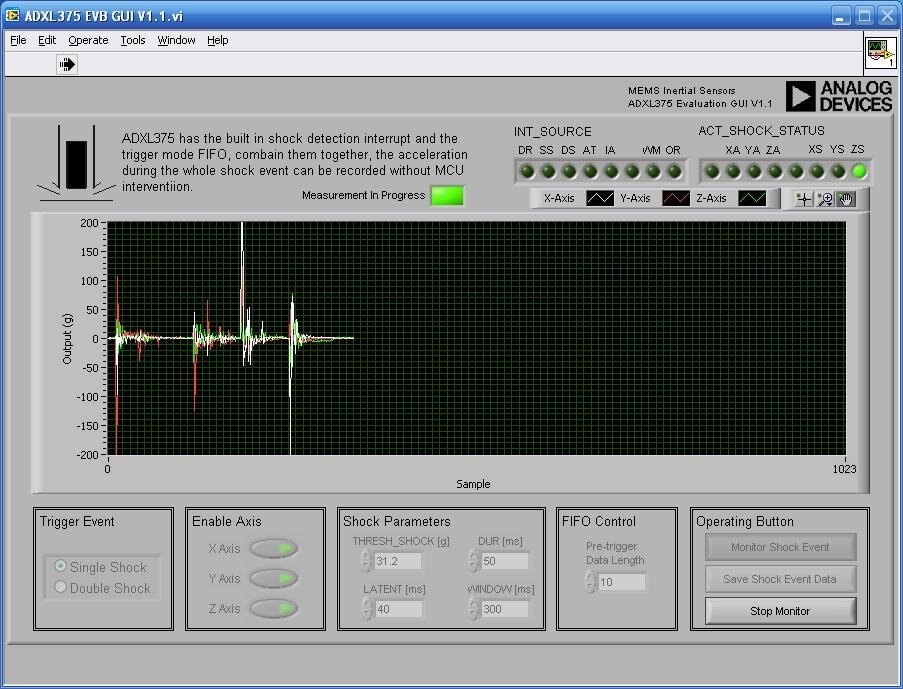
On this experimental setup I then applied the same impact force that I applied on my previous experiment. I then looked at the impact recording on the GUI and indeed it looks like the measured value exceeds the maximum range of 200g on the y-axix of the GUI graph. Here is a screenshot of this measurement.
I then looked at the datasheet; here is a screenshot of the section describing the maximum range:
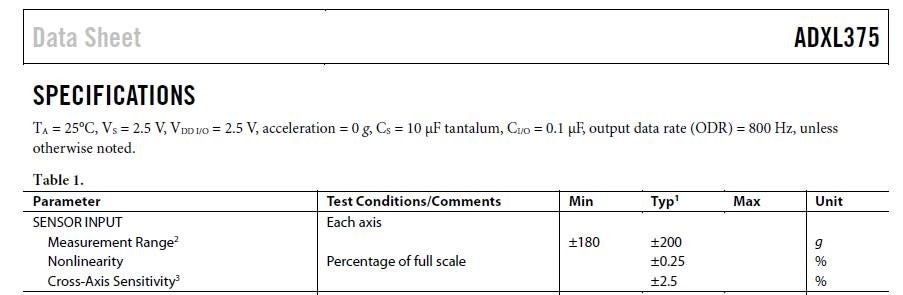
So the typical range is +/-200g, there is a minimum range shown there of +/-180g, but there is no maximum range value, so the specifications allow the possibility that the ADXL-375 sensor may be able to measure accelerations larger then 200g.
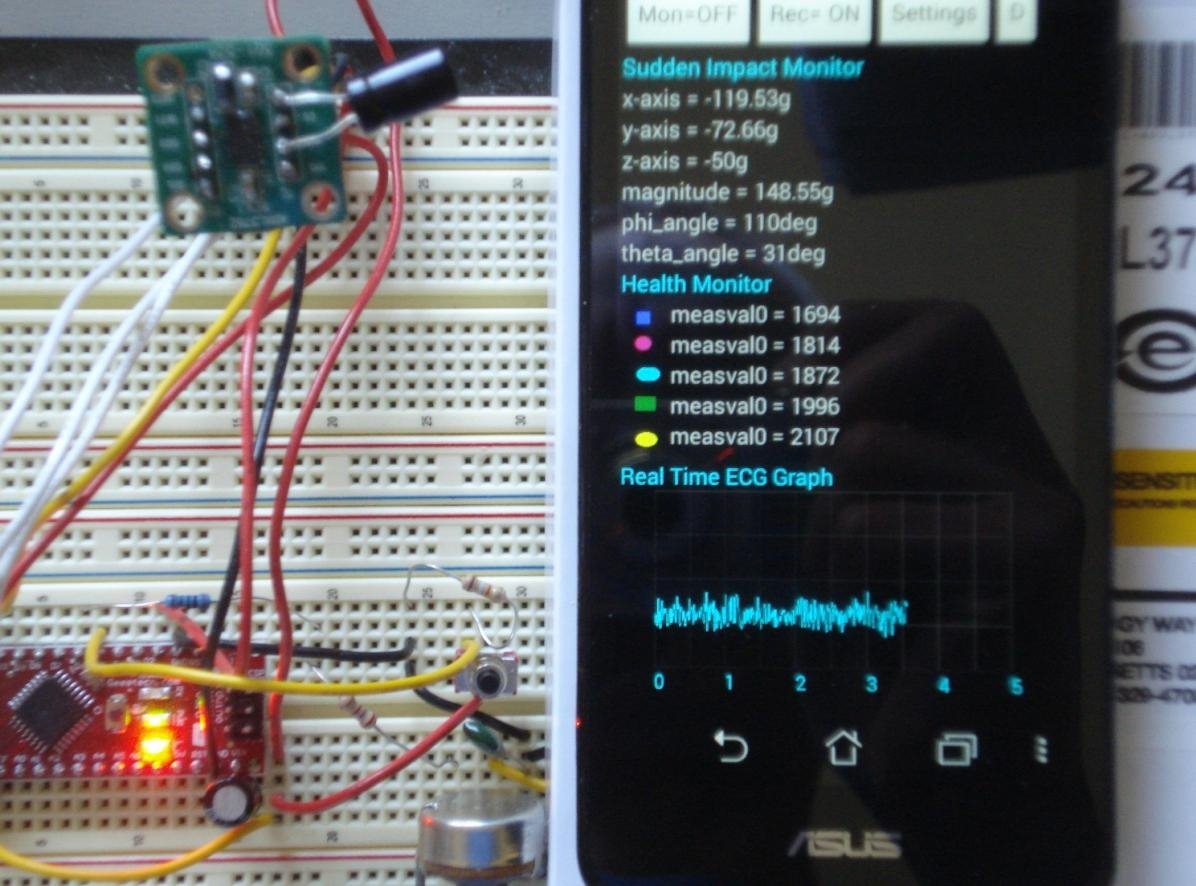
After clarifying that I did not make any error in converting the measured data into g values, I continued with improving my Android app by adding a graph that will display the real time ECG measurement. This was not an easy task, so I spend quite a significant time to get it to work. Here is a picture of the app running on my phone, which has the graph displayed at the bottom.
And here is a video (I don’t know why the resolution is so bad; I need to look for a different camera for future videos). The video shows a square wave signal plotted on the graph, since so far I haven’t connected yet the AD8232 ECG eval kit.
This is where I got so far with my wearable impact and health monitor system. I will come back with other updates as I get more work done.
Best Wishes,
Cosmin


