In the Bode Plots episode, I used The Intern to measure multiple frequency points. The process is not only time-consuming, but it is also very error-prone.
Originally, I wanted to show a Python script that automates the entire measurement in that video. But, talking about IVI, VISA, SCPI, GPIB, PB&J, USB, and whatever else got overwhelming. Instead, started working on a video specifically on how to get started automating instruments with Python.
I was trying to think of how to simplify the getting started aspect when I had an idea. What if I used a Raspberry Pi as the controller? Most of us have one (or something like it) and it runs Linux. The pyvisa module works very well in Linux. THEN it hit me, I have a Pi 400 sitting on the shelf!

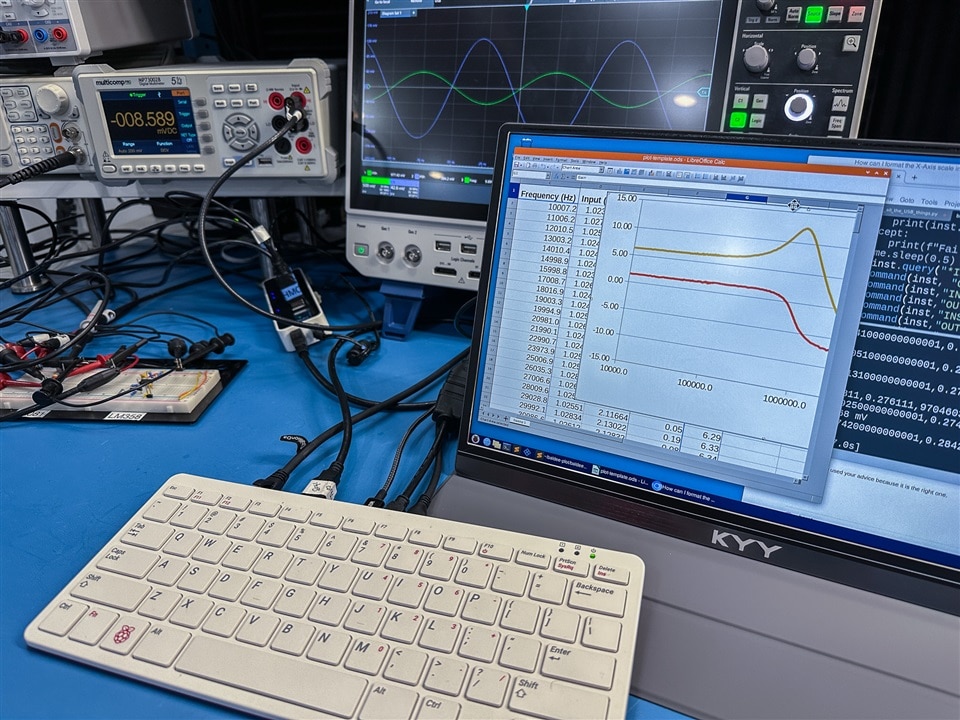
So, still very much a work in progress, but here is a Pi 400 remote controlling a function generator, power supply, bench DMM, and oscilloscope. The instruments are connected by Serial (FTDI cable), USB (USBTMC), and Ethernet. During the run, the Python script writes each measurement step to a CSV file. And then I am using LibreCalc (or Google Sheets) to generate the bode plot.
Originally, I did a sweep that changes the VCC. However, I found that did not have much effect on the op amp's performance. Now, the script is set up to sweep through frequencies in a configurable step size while applying different input voltage swings.
Long term, I have somewhere bigger I am trying to go with all of this. But for now, it makes me giggle to think about a $100 computer controlling a couple of thousand dollars worth of test equipment with Python.
Anyway, I have to get back to writing (words, not code). I just had to share.
If you want to follow on, here's the repo I'm working through.


Top Comments
-

strb
-
Cancel
-
Vote Up
+1
Vote Down
-
-
Sign in to reply
-
More
-
Cancel
-

baldengineer
in reply to strb
-
Cancel
-
Vote Up
0
Vote Down
-
-
Sign in to reply
-
More
-
Cancel
Comment-

baldengineer
in reply to strb
-
Cancel
-
Vote Up
0
Vote Down
-
-
Sign in to reply
-
More
-
Cancel
Children