


We present a new camera board, firmware, software, and spectroscope of our own design using the ESPROS epc901 CCD line image sensor.

Background
In a recent Element14 blog The Planck Constant and the Relationship of Frequency to Photon Energy I estimated the peak emission wavelength of LEDs with an inexpensive spectroscope. The instrument resolution was poor and relied on subjective measurements made by eye. This resulted in an interest to develop an improved instrument. After seeing the post my friend Adrian told me of his desire to develop a camera and asked if I wanted to collaborate on an improved design. Of course I did!
Over the past two months we have developed a comprehensive design based on the ESPROS epc901 CCD line image sensor with the following features:
- Relatively inexpensive $24 sensor and low overall cost
- 1024 monochrome pixel resolution
- High sensitivity
- High frame rate
- Easily programmed ARM Cortex-M4 STM32L496ZG-P Evaluation Board
- Full featured firmware with Python user interface
- Optional Arduino form factor shield
- Multiple applications, including spectrometry
- Resolution of 1 nm or better in visible and infrared spectrum
- Hardware License: CERN Open Hardware License V2 – Permissive
- Software License: MIT License
Assembly of the camera board does involve reflow of the 2x16 0.5 mm pitch BGA image sensor which appears quite fragile. With care, several boards were assembled using a stainless steel solder stencil and an unmodified toaster oven. The spectroscope is a straight forward design but does require a 3D printer.
Below we give additional information on the hardware, software, and various experiments done to date.
Camera Breakout Board

The KiCad project for the epc901 breakout board can be found here.
In addition to the image sensor and related passives, the breakout board also integrates an ADC. The footprint and firmware are compatible with the Texas Instruments ADCS7476 and Analog Devices AD7476 which are 1 MSPS 12-bit ADCs with SPI-like interface.
Connection to the board is through a DIL 0.1 header.
The breakout board has space and mounting holes for a lens holder. The spacing between the mounting holes is 20mm. For full coverage, the lens should support 1/2.3" or larger sensors.
For our prototypes, we chose a M12 metal lens holder w/ 20mm hole spacing and a 25mm M12 lens for 1/2" sensors. In the US, a wide selection of lens holders and lenses can be found at M12 Lenses Inc.
Camera Adapter Board
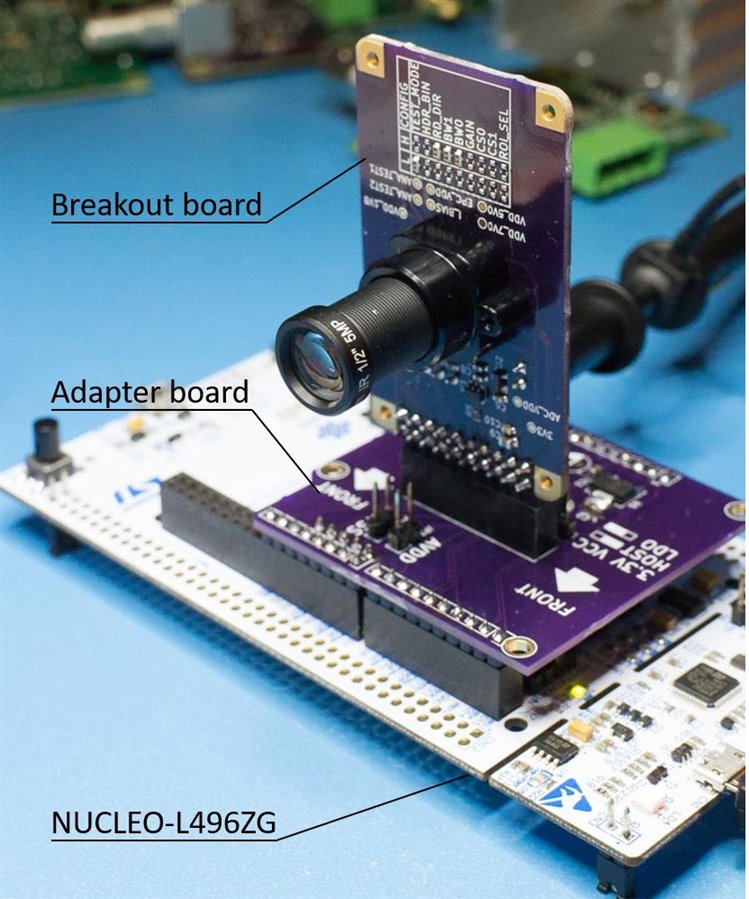
The adapter board was designed in KiCad and the files can be found here. It follows the Arduino Shield standard and could be mounted on any compatible microcontroller. The firmware was developed for the ST Microelectronics NUCLEO-L496ZGNUCLEO-L496ZG development board and would have to be adapted to other microcontrollers.
ST NUCLEO-L496ZG Firmware
The firmware for the NUCLEO-L496ZG used to control the epc901 breakout board is located here. The firmware was developed and built with the latest version of STM32CubeIDE (version 1.4.2 as of October 2020).
The firmware exposes a command shell over serial. The parameters of the serial connection are 115200 8N1.
A partial list of command capabilities include…
- Help for all the commands
- Direct register reads and writes
- Reset of microcontroller, camera settings, and sensor
- Set exposure time
- Start and abort capture
- Read from frame buffer
- Configure burst captures
- Enable / disable and control triggers
The complete list of commands and detailed capabilities can be found in the Github README.md file for the project and is not repeated here in order to avoid multiple locations that might require maintenance.
Python Library
There is a comprehensive and easy to use Python library that wraps the shell of the firmware into an easy to use API.
from epc901camera import Camera
camera = Camera()
camera.open("my serial port")
camera.setExposure(1000)
camera.capture()

pixels = camera.getPixels()
camera.close()
Three example scripts are provided for demonstrating interaction with the breakout board:
- live.py displays output of the image sensor in real time
- snap.py captures one image
- burst.py captures a series of images in a burst
See the documentation for additional information on the command line arguments used in the Python examples.
Spectroscope
The prototype spectroscope has five major components: tube, diffraction grating, entrance slits, camera with lens, and base.

The spectrometer tube shown in Slide 1 has an internal baffle to block incoming light and slots on the ends to hold the diffraction grating and the sliding stainless steel plate with the optical slits. We have experimented with length and the tube shown is well suited to observations in the visible spectrum. It is approximately 180 mm in length from the diffraction grating to the slits. A shorter tube allows a wider spectral field of view with the lens we are using.
The tubes were designed in Fusion 360 and printed on an Anycubic I3 Mega printer using black PLA filament. The STL files are available here for those who would like to print their own.

We used a 1000 lines/mm linear diffraction grating in a 35 mm photographic slide type mount which are widely available on Amazon, eBay, and from educational vendors. A package of ten can be bought for $10 USD. Higher quality glass slides are also available.
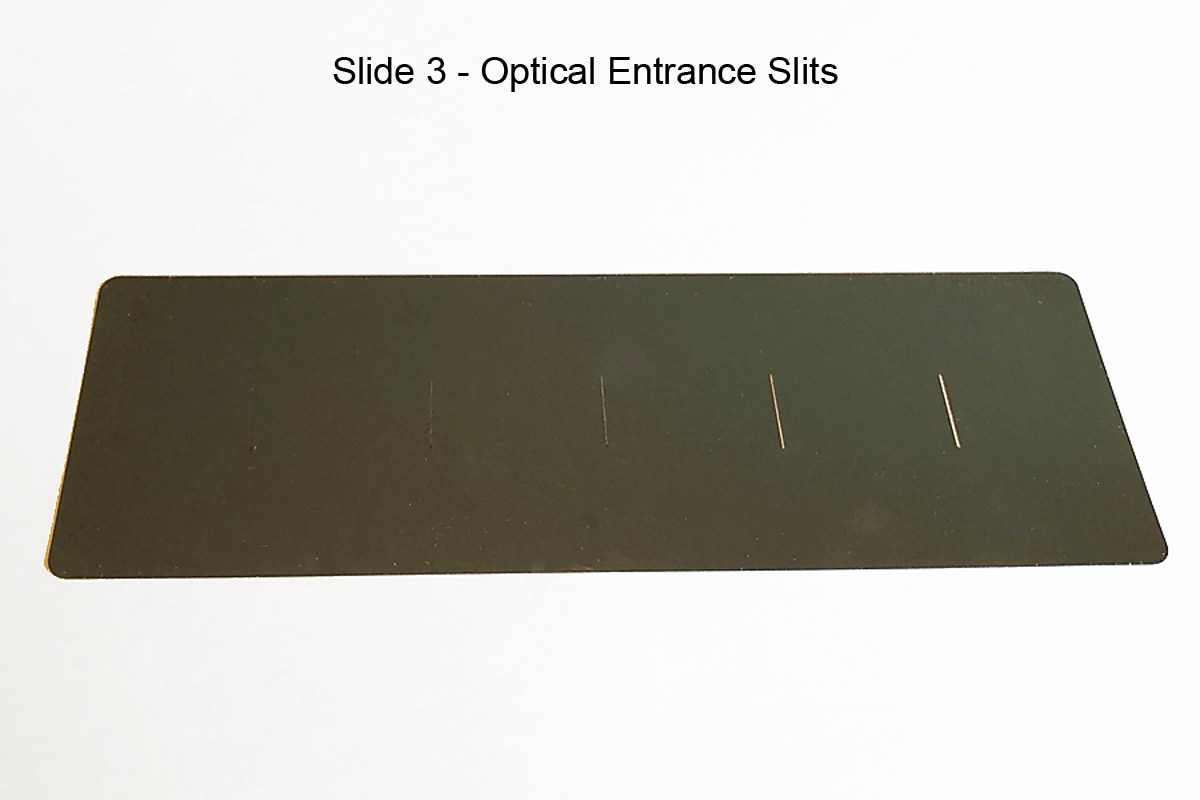
Our design for the optical slits as shown on Slide 3 was laser cut into a stainless steel slide by OSH Stencils, a US based company that fabricates stencils for applying solder to PCB boards. The slits are 0.5, 0.25, 0.1, 0.05, and 0.0254 millimeters in width.

The camera is shown above mounted on the breakout board which is then attached to the adapter board and the microcontroller. As previously mentioned we are using 25mm M12 fens for 1/2" sensors that has worked well for capturing images in the visible and near visible spectrum.

The wooden base in Slide 5 was constructed for easy camera alignment and to hold the components securely. The camera and diffraction grating can be further shielded from extraneous light with cloth or paper during use.
Usage: Setting up the Spectroscope
The following video demonstrates how to align the camera with the spectroscope, focus, and expose frames.
Usage: Calibrating the Spectroscope
In this video the method for calibrating the x axis of the spectroscope in the visible range with a compact fluorescent lamp (CFL) is demonstrated.
Usage: Determining Peak LED Wavelength
The following video demonstrates how to measure the peak wavelength of a LED and compares it to the manufacturer’s datasheet.
Usage: LED Wavelength with Varied Forward Voltage
This experiment illustrates how the wavelength of a blue LED varies with the forward current through the LED. In a previous element14 Blog that used LEDs to estimate the value of Planck’s constant this behavior was identified as an issue but the apparatus to do an evaluation was not available.
Below we determine how a blue Lite-On LTL2V3TBS3KS behaves as the current is increased. For this experiment we used a Tenma 72-2685Tenma 72-2685 bench power supply to supply a constant voltage, a Tenma 72-1020Tenma 72-1020 bench multimeter to measure current, and the epc901 spectroscope.
Before beginning the experiment the spectroscope is calibrated and the LED arranged so that it is axially aligned with the slit in the spectroscope. As measurements are taken the exposure is adjusted for the peak brightness to land at approximately 2000 – this allows the resulting spectrograms to be aligned and compared easily. We started the measurements at 2.6V which resulted in a forward current of 2.5 mA. The following procedure was then used:
- Save the spectrogram and record the forward voltage, forward current, and peak wavelength
- Adjust the forward voltage up by 50 mV
- Adjust the exposure to give 2000 counts
- Return to step 1 if the forward current is less than the LED max current (or the LED burns out)
The results are shown in the graph below.

The range shown in the graph is 2.5 mA (Vf = 2.6 V) to 28.4 mA (Vf = 3.1 V) at 100 mV intervals. The peak wavelength shifted from 474 nm to 471 nm over this range, a 3 nm shift. As a comparison, Maxim shows a 472 nm to 469.7 nm shift (2.3 nm) in the plot of an unspecified blue LED in their application note 3070.
Usage: High Speed Analysis of a CFL Lamp
In this experiment the high-speed capabilities of the epc901 are demonstrated by examining the flicker and changing emissions from the phosphor of a compact fluorescent lamp (CFL). The experiment was inspired by a YouTube video from the commercial spectrometer manufacturer Ocean Insight.
A CFL works by driving an electric current through Argon with a small amount of Mercury inside the tube. The resultant ultraviolet light excites the coating on the tube (called phosphor) and emits visible light. There are numerous variations in the CFLs manufactured over the years. Some newer ones may have ballast refresh rates on the order of 10 kHz or greater and depending on the ballast the experiment described here would not work show the same effect with them.
Our lamp has a very discernible 120 Hz frequency as a result of the 60 Hz frequency of AC mains in the United States as shown in the short video below. This animation was created by capturing a burst of 100 images in 150 milliseconds, resulting in approximately 5.5 spectrograms per 120 Hz cycle.
Three of the stronger emission lines visible in the spectrogram of a CFL come from Mercury and Europium and that is what is examined in the plot below.

There is a delay in the emissions of Europium compared to the two emission lines from Mercury. If the strength of the emissions as recorded by the camera for Europium 611.6 nm are plotted against that of Mercury 546.5 nm we see that the two are “out of phase” or stated differently the Europium lags behind Mercury:

We theorize that the phosphor continues to glow for some period after the peak Mercury ultraviolet emission drops and then lags behind as the Mercury emissions increases.
Summary
We have demonstrated a camera board complete with firmware and easy to use software that performs comparably to instruments costing in the $1000 range and can be built for less than $100. The camera features a high frame rate in the hundreds of frames per second. Resolution is sufficient to achieve 1 nm detail in our spectroscope with calibration. The instrument is easy to calibrate and the software allows powerful analysis. While our demonstrations were specific to spectroscopy the camera might also be used for reading bar codes, scanning, determining linear position, and so on.
The design, fabrication, firmware, and software files are linked below and have lenient licenses.
This was a joint project with the largest contribution coming from my friend Adrian. He did the real work in hardware design and assembly, and completed the software development in just a few weeks. Incredible! We have enjoyed the project and believe the camera has enthusiast, educational, and practical product application.
Do you have ideas for other uses? All comments appreciated!
Links
epc901, ESPROS Photonics Corporation: https://www.espros.com/photonics/epc901/
Hardware and software repository of our project: https://github.com/astuder/epc901
Top Comments