


The Planck Constant and the Relationship of Frequency to Photon Energy
by Frank Milburn
I have revisited a subject I first explored in 2017 using LEDs to determine the value of the Planck constant. The method used is one that seems to be in wide use among undergraduate physics students these days. In this post it is explored further and this time the light frequency will be measured experimentally as well as the energy of the LEDs in the calculation of the Planck constant. Last time I achieved a result that differed from the accepted value by 11%. Can I do better this time?
Introduction
The Planck constant is the quantum amount that relates a photon's energy to its frequency and is a fundamental physical constant of quantum mechanics. The origin of the constant was a formulation by Max Planck as a mathematical expression to predict the spectral distribution of thermal radiation from a black body. Albert Einstein formally described the effect of light quanta in a 1905 paper on the photoelectric effect which would eventually win the 1921 Nobel Prize. The relationship of photon energy E, photon frequency f, and the Planck constant, h is known as the Einstein Planck equation and is shown below:
E = hf (1)
This can also be written as E = h c/λ where c is the speed of light and λ is the wavelength.
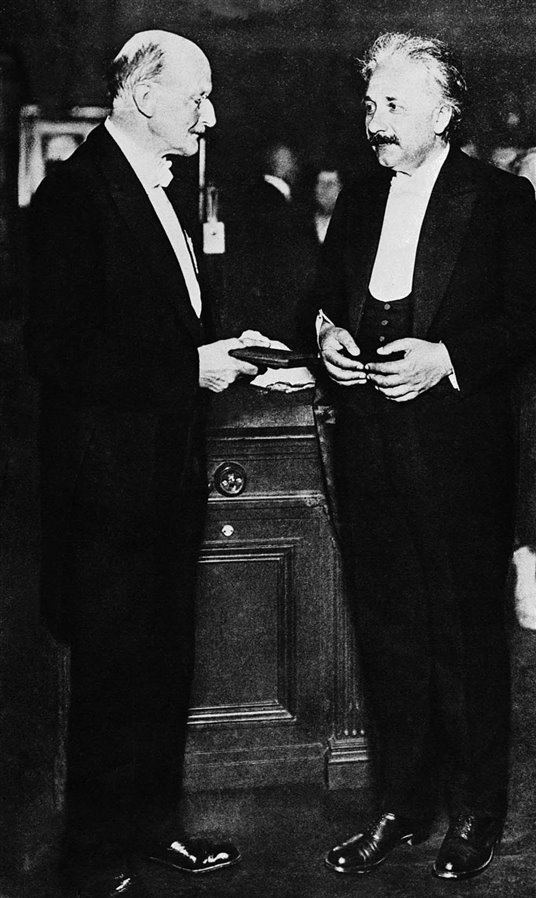
Max Planck and Albert Einstein - Undated photo without credit on Wikipedia
From Wikipedia (italics mine):
In a light emitting diode, the recombination of electrons and electron holes in a semiconductor produces light (be it infrared, visible or UV), a process called "electroluminescence". The wavelength of the light depends on the energy band gap of the semiconductors used. Since these materials have a high index of refraction, design features of the devices such as special optical coatings and die shape are required to efficiently emit light. By selection of different semiconductor materials, single-color LEDs can be made that emit light in a narrow band of wavelengths from near-infrared through the visible spectrum and into the ultraviolet range. As the wavelengths become shorter, because of the larger band gap of these semiconductors, the operating voltage of the LED increases.
So the Einstein Planck equation is demonstrated whenever you turn on an LED. By measuring the frequency of the light output by the LED and the voltage required to turn on the LED the value of the Planck constant can be estimated as will be done here.
The Planck constant turns up in many other areas of quantum physics including the de Broglie relationship for the wavelength of matter waves, Schrödinger’s Wave Equation, and Heisenberg's Uncertainty Principle. Fundamental constants such as the Planck constant are used to define measurement units in everyday use. For example, the Kibble balance measures the force from an electric current and voltage needed to offset a test mass. For this purpose the value of Planck's constant is specified exactly and used to set the value of the kilogram.
CODATA set a final value for h of 6.62607015 × 10⁻³⁴ kg⋅m2/s as described here, with an uncertainty of 10 parts per billion. When the SI units were redefined this was set as the exact value of Planck’s constant, which in turn defines other SI units including the kilogram.
Measuring the Frequency of Light
Spectrometry is the measurement of electromagnetic radiation. Here we are most interested in the dominant frequency of LEDs emitting visible light. Sparing no expense an Eisco spectroscope cat no. PH 0100QA was purchased from Amazon for $8.29 USD including shipping. The marketing blurb states that the measurement range is 400 to 700 nm and the accuracy is +/- 5 nm. More on that later.
The instrument passes light through a slit with a 500 lines/mm diffraction grating on the viewing end. There is a scale lit by an opening which shows the frequency of the light in nanometers that can be seen when looking through the view finder. Knowing the distance from the slit to the diffraction grating and the spacing of the grating it is possible to calculate the wavelength of the spectra when viewed. According to the Experiment Guide provided with the instrument:
y = λL/d (2)
where: y is the distance from the center to the spectral line being measured in meters (m) on the scale
λ is the wavelength (m)
L is the distance from the diffraction grating to the slit in meters (0.19 m)
d is the distance between gratings in meters (2 x 10⁻⁶ m)
This calculation does not appear to properly account for the variable distance from the view finder of the ends of the scale. The scale is marked in nanometers rather than meters.
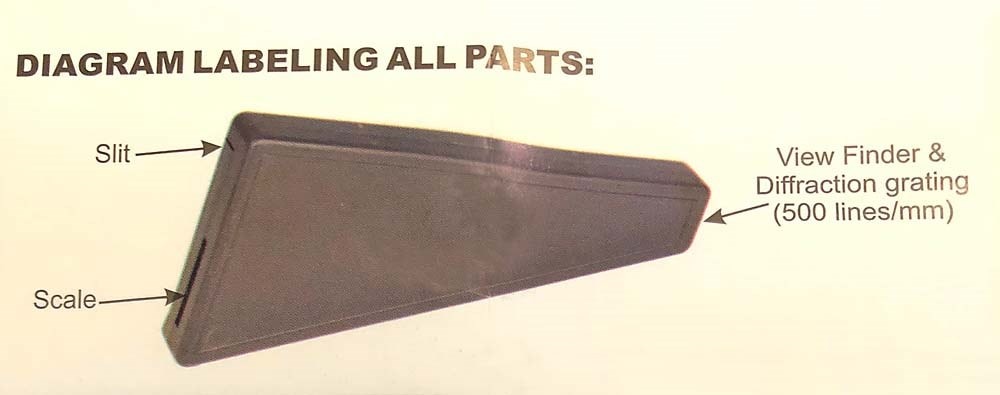
credit: Experiment Guide, EISCO SCIENTIFIC www.eiscolabs.com
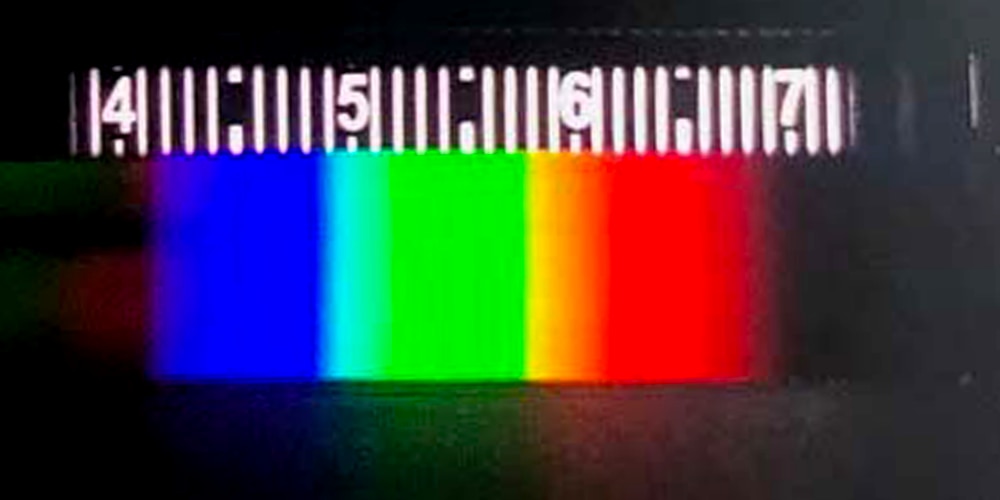
Although not the most precise of instruments it performed better than I thought it would and I had a lot of fun with it. It succeeded in making me more interested in spectrometry and I am considering making a more sophisticated instrument with a Raspberry Pi to record data and examine other ways spectrometry is used. The spectrometer was mounted on a tripod with rubber bands to hold it steady and using an iPhone the spectrograph of sunlight was captured. It is difficult to get a good photo but here is one that has been cropped and straightened in Photoshop with the contrast tweaked but otherwise unaltered.
To improve the instrument for my purposes a couple of modifications were made:
- created a cardboard mount to hold the iPhone camera in alignment with the spectroscope
- used rubber bands to attach the mount to a tripod
- applied electrical tape to reduce the size of the slit and straighten the edges
- placed paper over the scale to reduce contrast between it and the spectral display and get exposures inside the dynamic range of the camera
The following video demonstrates the setup while viewing a compact fluorescent light (CFL).
The direct emissions from the mercury vapor in a common CFL gives several bright lines and there is also fluorescence from rare earth phosphors. A representative spectrograph from the internet will be used for calibration and is shown here superimposed above the spectroscope.
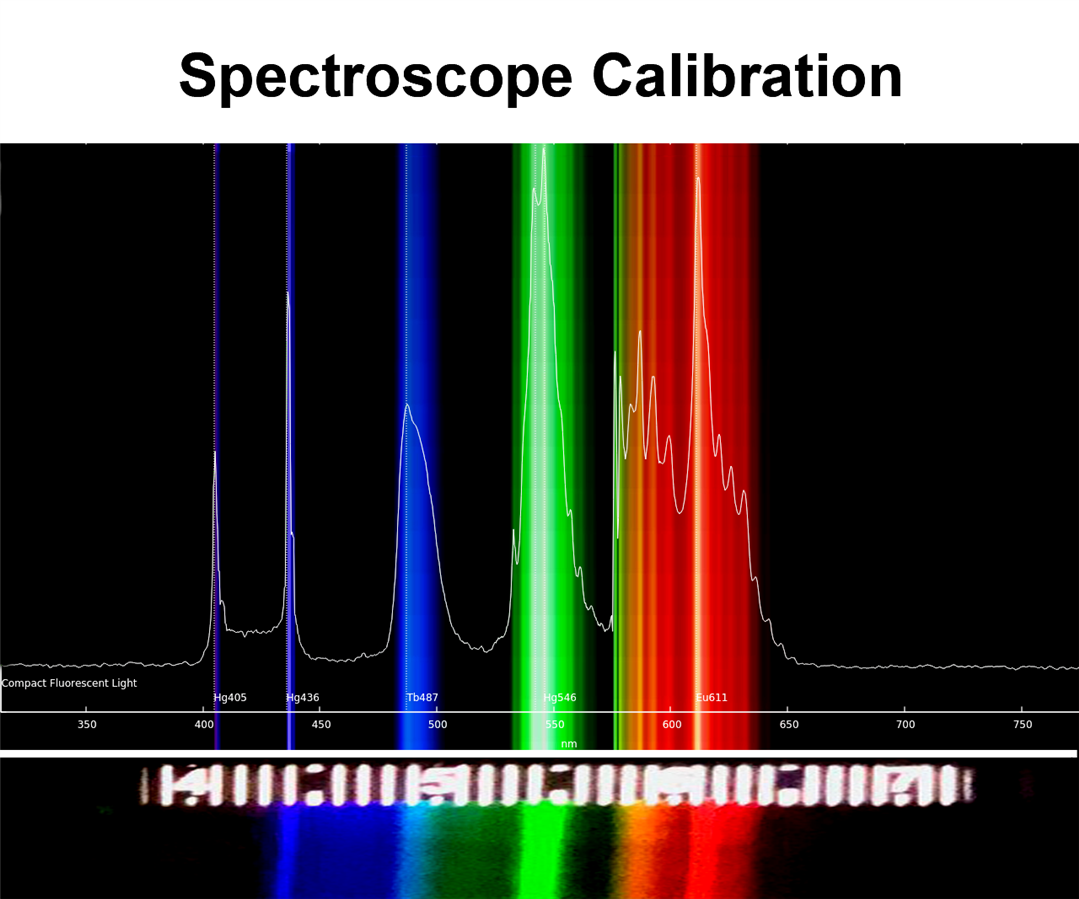
credits: top spectrograph uncredited image on Pinterest. bottom spectrograph, the author.
The bottom spectrograph from the spectroscope has been "stretched" in Photoshop so as to line up with the image being used for calibration. The CFL light has several bright lines including the following:
| Element |
Calibration Spectrograph λ (nm) |
Spectroscope Spectrograph λ (nm) |
|---|---|---|
| Hg | 436 | 440 |
| Tb | 487 | 487 |
| Hg | 546 | 545 |
| Eu | 611 | 611 |
The problem here is that the spectroscope does not give particularly sharp lines and it is difficult to visually discern the brightest part of the line. The comparison does however indicate that the blue side of the spectrum seems a bit off for the spectroscope by maybe 4 nm or so.
The spectroscope was then used to measure several Lite-On brand LEDs in my possession where datasheets were available and one unknow red LED. The resulting spectrographs were photographed and shown below.

Credit: the author
The arrows with wavelength records my estimate of the brightest part of that line in the spectra. If my attempts at calibration are to be believed, the blue LED is about 4 nm off high and might be corrected to 464 nm.
The intensity of the LEDs as a function of the wavelength when fully turned on are given in the datasheet by Lite-On in the following graphs.
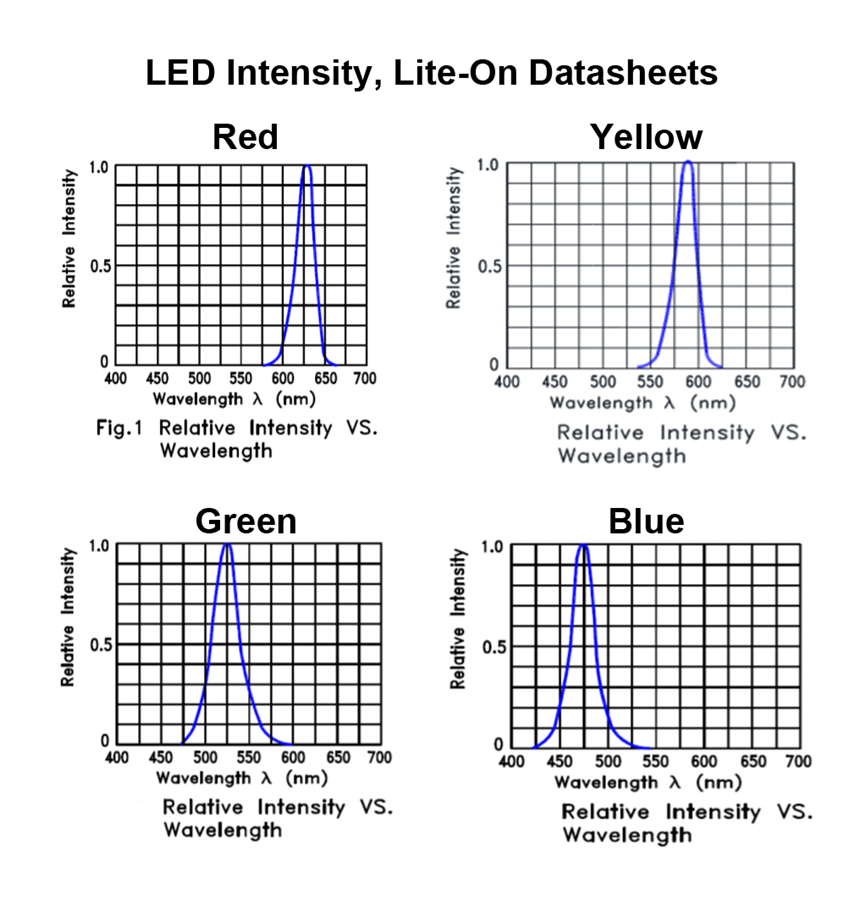
Credit: Lite-On Datasheets
Note that at half the peak relative intensity the breadth of the wavelength can be 25 nm or more. And while the Lite-On datasheet does not give minimum, typical, and maximum wavelengths for their LEDs the Vishay TLHF5400TLHF5400 gives the following:
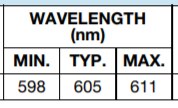
Credit: Vishay TLHF5400TLHF5400 datasheet
So there is uncertainty in all the sources of data. The spectroscope results have been tabulated below along with the datasheet values from Lite-On.
| LED Color | Lite-On Model |
Datasheet λ (nm) |
Spectroscope λ (nm) |
Corrected λ (nm) |
|---|---|---|---|---|
| Red | Unknown | 625 | ||
| Yellow | LTL2V3YX3KS | 596 | 592 | |
| Green | LTL2V3TGX3KS | 522 | 525 | |
| Blue | LTL2V3TBS3KS | 472 | 468 | 464 |
There is potential for greater than 5 nm difference from the typical datasheet value and the "corrected" value from the observations differs more from the datasheet than the raw value.
Determining the Planck Constant
The Planck constant is an exceedingly tiny number and it is interesting that we might be able to measure it with some accuracy without a sophisticated laboratory. In addition to the LEDs and a knowledge of their wavelength we need the following equipment:
- A power supply that allows voltage to be varied
- A means of measuring voltage
- A means of measuring current
LEDs are made by doping the junction of two semiconductor materials, one of which has an excess of electrons (n-type) and the other a lack of electrons or holes (p-type). When a voltage sufficient to allow current to flow through the p-n junction a recombination of the electrons and holes occurs that releases energy in the form of photons. We are going to to determine the energy at which the LED just begins to emit photons through measurement of voltage. The energy E in electron-volts (eV) is equal to the voltage V in volts (V), times the electron charge e. For a LED:
V = E/e + φ/c (3)
The term φ/c is the work function and accounts for energy losses inside the p-n junction. For simplification it will be assumed that it is constant for all the LEDs. Now substitute the Einstein Planck equation for E in equation (3).
V = hc/e(1/λ) + φ/c (4)
The value of V is measured experimentally while the value of λ was determined for the LEDs both experimentally and by the datasheets. The values for the speed of light, c and the electron charge, e will be accepted as knowns. The term φ/c is unknown but notice the form of equation (4) will plot as a straight line for V vs. (1/λ) where the slope is hc/e and there is the intercept is φ/c. By testing multiple LEDs it will be possible to plot V = f(1/λ) and do a least squares fit for the slope. With this known, the equation to calculate Planck's constant has been derived.
h = em/c (5)
where m is the slope determined from the plot described above.
Test Procedure
A PicoLog ADC-20ADC-20 High Resolution Data Logger was used to record the voltage and current but multimeters would also work. Current was measured by recording the voltage across an inline resistor and applying Ohm's Law in the PicoLog data recorder. A Tenma 72-268572-2685 Bench Power Supply supplied power but something as modest as batteries and a potentiometer would also work. A block diagram for the test setup is shown below.
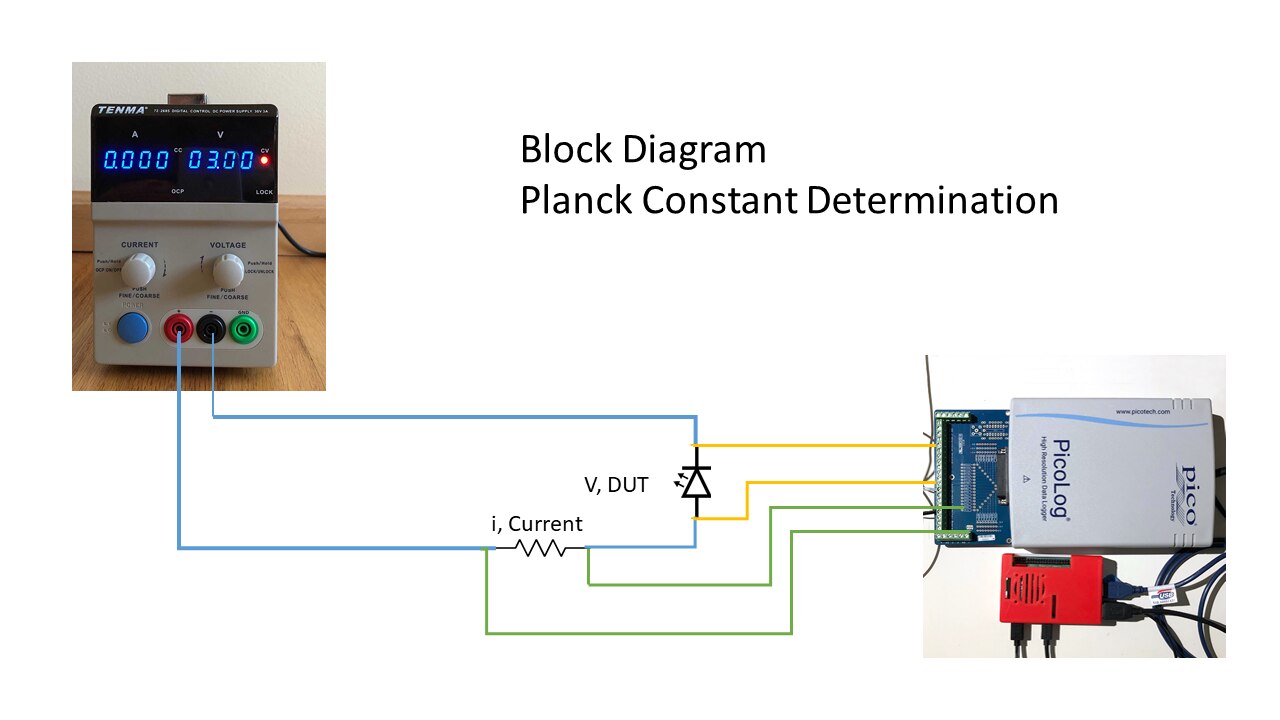
credit: the author
Again, all that is needed is a source of power, a way to vary the voltage, a means to measure the current, and a means to measure the voltage across the LEDs being tested.
The data recording steps were:
- Set up PicoLog ADC-20ADC-20 to record current and voltage
- Set maximum current on the power supply to 10 mA to protect the LEDs
- Set voltage on the power supply to approximately 1 V
- Turn off room lights so that the LED can be seen when it just lights
- Insert the LED to be tested into the breadboard
- Slowly turn the voltage up until the LED just lights by eye. Record the voltage
- Continue turning up the voltage to something less than 2.5 V
- Repeat until all LEDs are measured
In the following video the data recording step is demonstrated for the green LED:
The plots with voltage and current as a function of time and taken directly from the PicoLog onscreen graphical output are shown below.
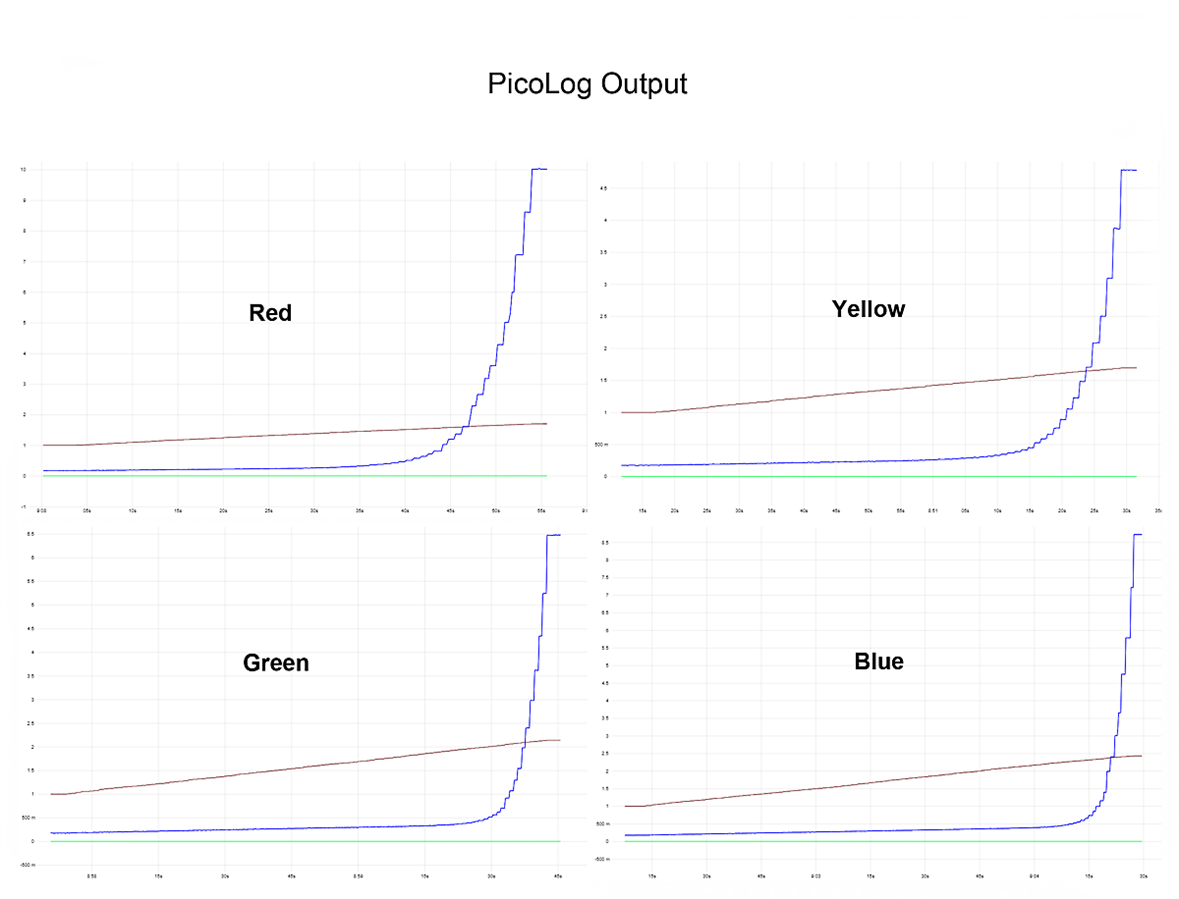
The blue lines are the current and the brown lines are voltage plotted against time. The minimum voltage increment on the bench power supply is 0.01 V which explains the current steps once the forward voltage exceeds a forward voltage sufficient for the exponential current increase to become apparent. Since there isn't a sharp transition there is bound to be some error in the voltage used to calculate the Planck constant by this method. The following three methods were considered:
- the point that light is just visible to the eye which is subjective and dependent on the eye
- the voltage where V-I obtains a specified slope - i.e. the first derivative
- the voltage where the slope change doubles over a specified voltage range - i.e. the second derivative
When the data in the table was examined the problems with a manual sweep of voltage became apparent in that the rate of voltage change was not consistent and there were pauses and jumps backwards and forwards to clean up. Multiple sweeps or slower sweeps with averaging would have helped smooth the data. The approach using the second derivative was dropped because it didn't seem to provide additional insight given the crudity of the data. Below is an annotated extract from the green data.

The slope was calculated in a somewhat odd manner by arbitrarily getting slope from the current to 3 entries back due to the way data was captured. The methodology for slope determination where photons are first emitted could stand improvement.
The massaged data from all LEDs is shown in the table below.
| Color | Vf (V), eye method | Vf (V), slope method |
|---|---|---|
| Red | 1.31 | 1.34 |
| Yellow | 1.49 | 1.48 |
| Green | 1.92 | 1.88 |
| Blue | 2.18 | 2.10 |
Interesting... Sometimes my eye sees the LED light sooner than the slope method might indicate and sometimes later. The eye method was repeated with the same result. Not too surprising perhaps - the eye will vary by individual and is sensitive to some colors more than others.
The forward voltage as a function of 1/λ was plotted and the slope calculated using least squares. Here slope is referring to voltage and 1/λ for multiple LEDs - not the V-I curve discussed above. From there the Planck constant was determined. Four cases were evaluated using the datasheet and spectroscope to get frequency and the eye method and slope method to get the forward voltage when the LED turned on.
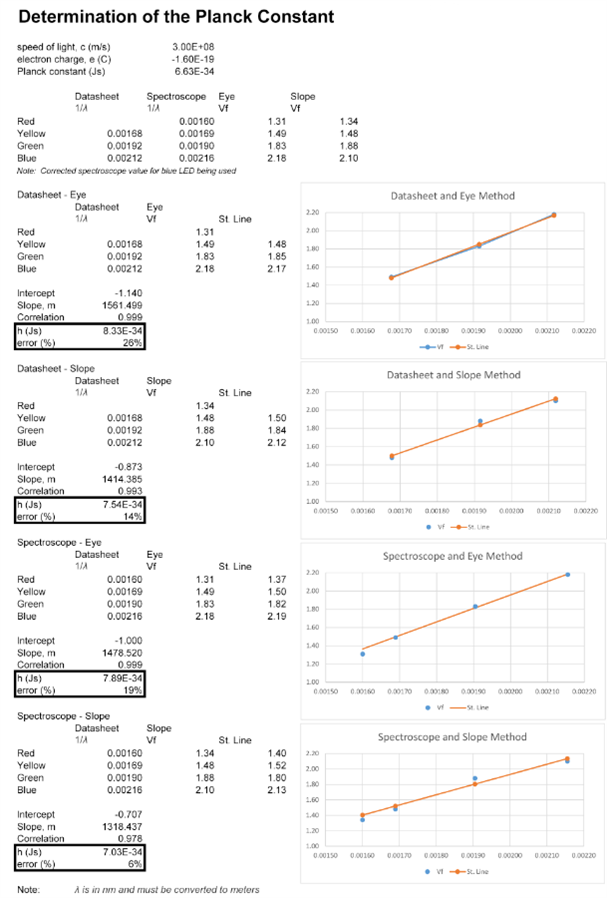
The deviation from the accepted value using the 4 different methods varied from 6% to 26%. The best results were obtained using the spectroscope to determine frequency and slope for voltage.
Thoughts on Reducing Error
The original determination by Planck was accurate to within 1.2% of the currently accepted value and as noted above mine vary from 6% to 26%. My experiment several years back was off by 11%. It has been many years since I last analyzed experimental data in a rigorous quantitative manner and won't attempt it here. In the text above a number of potential sources of error were identified though so here are thoughts on what it might take to achieve a determination of the Planck constant to within say 1%.
A review of inexpensive DIY spectroscopes leads me to believe it should be possible to achieve accuracy of 1% or better from a brightly lit LED. However the first emission occurs from a dim LED with very little current. The difference between frequency of a brightly lit LED and the first photon emission is unknown to me. There may be also be temperature impacts. But I speculate that most of the error is in the determination of energy rather than frequency.
While the eye is a wonderful and sensitive instrument it is more sensitive to some frequencies more than others even in persons who are not color blind. The voltage slope method as implemented here could be improved by:
- sourcing clear LEDs with datasheets showing narrow peak intensity
- sampling more LEDs of different wavelength
- using a power supply with finer voltage increments
- minimizing voltage measurement errors
- maintaining constant temperature across LEDs during experiment
- averaging and repeating the current readings at each voltage setting
- refining the method for determining first photon emission from the V-I curve.
How much improvement this might achieve is unknown but given that the Planck constant is now thought to be known to within 10 parts per billion this is never going to be more than an interesting demonstration from a scientific viewpoint. Very accurate readings from this method may well just be coincidence due to lack of precision.
There is one more source of error that was only discussed in passing. The work constant in equation (4) was assumed to be the same for all LEDs. Presumably it varies for different chemical make-up of the LED and probably with temperature as well.
Summary
The best result was about 6% different than the accepted value for the Planck constant but that may well be coincidence and the uncertainty is fairly high. The method demonstrated doesn't lend itself to high accuracy. Nonetheless it is an interesting and educational experiment and it has heightened my interest in spectrometry. If you made it this far, then thanks for reading!
Useful Links
There are many useful videos and posts on this topic on the internet. The following are a few you might find interesting.
https://www.scienceinschool.org/2014/issue28/planck
https://www.nist.gov/si-redefinition/kilogram/kilogram-mass-and-plancks-constant
Corrections and Edits
9 September 2020: Corrected typo in section deriving equations for determining the Planck constant
14 September 2020: Corrected misleading statement on “eye method”
6 October 2020: Corrected Excel Calculation Spreadsheet
Top Comments