What tools and techniques do community members use to document their data captures over those longer term projects ?
I've been working on a project on and off over the past couple years but I haven't yet found a good way to document data captures in such a way that they can be annotated and then the annotations updated at a later point in time as more information is found. It is getting to the point where we are now talking 100's of captures so looking for better ways of doing things to tidy up the existing documentation process.
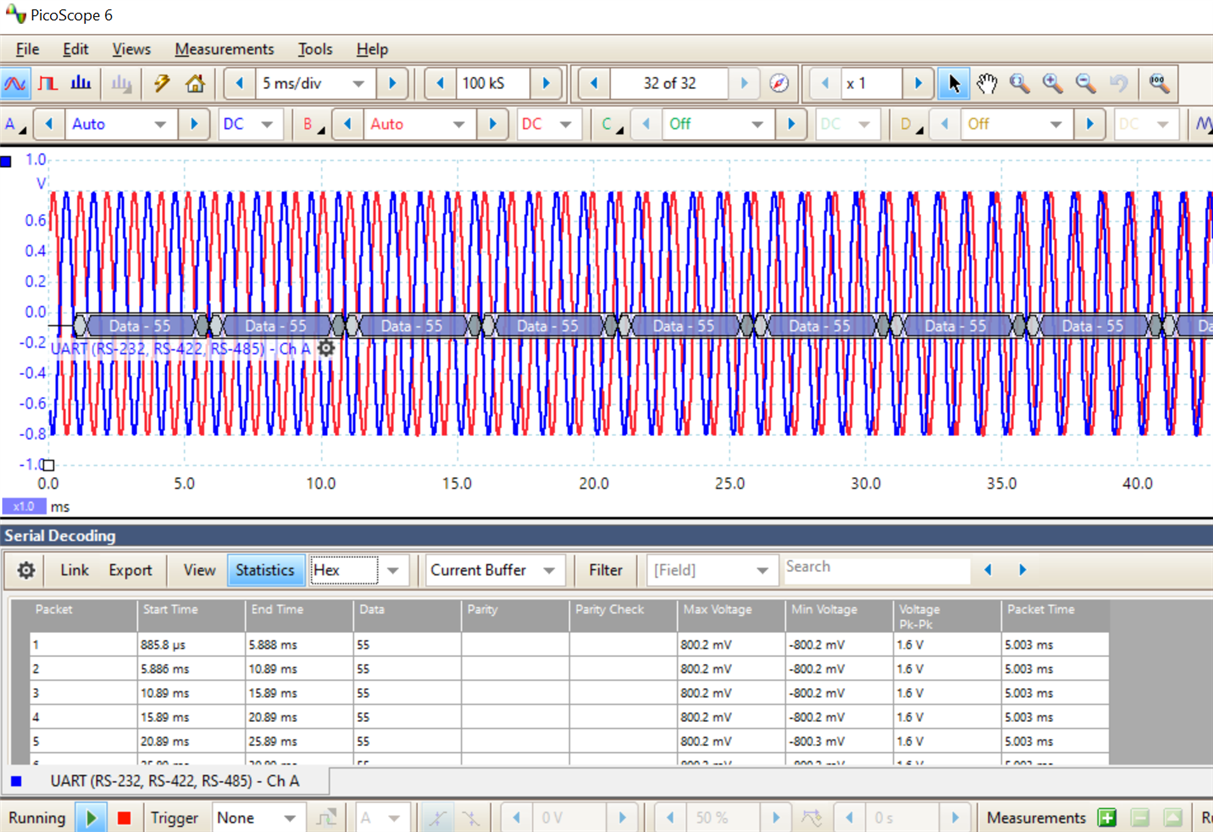
For this specific project, most of the data has been captured in the field on a PicoScope USB scope and forwarded onto me, however I have found similar issues with other scopes. In this case the data being captured is mostly bidirectional serial data with Tx and Rx being captured on separate scope channels. The PicoScope software is currently decoding the serial data and displaying it under each trace. However in order to be able to read the decoded data, you have to 'zoom in' sufficiently with the timebase which then quickly results in a very small active window sliding back and forth over a much larger data capture.
For documentation however it would be more convenient to be able to take a screen shot of the full capture at a sufficient resolution such that you could quickly look at it outside of the scope software and compare it to previous captures, but the print options provided appear to limit you to printing a single page of the current view and even then it removes the serial decoding in the process.
Currently to get a 'quick' overview for documentation it is a case of taking multiple screenshots and then stitching them together back into one wide image to view in a bitmap viewer. Even for relatively small captures this is quite time consuming.
Another approach might be to export the individual scope traces and serial decodes as CSV data then write some code to import and parse the 4 CSV files and combine them back into a single two channel waveform with decoded serial data and save it as something like SVG format to replicate what the scope display does. The advantage of this route is that it allows for additional processing of the serial decoded data and thus additional data annotations can be added automatically e.g. decoding the captured value and then displaying it as text for the human readable stuff, or using colours to highlight specific values of interest.
In either case, additional annotation tends to have to be done in packages which can work with the bitmap or vector graphics files, either editing them directly or by importing and overlaying on top of them on a separate layer.
Getting hardcopy out is another issue, especially if you find it easier to scribble notes on paper, so printing to a till roll type printer might be useful. I have seen some scopes that appear to be able to do that directly.
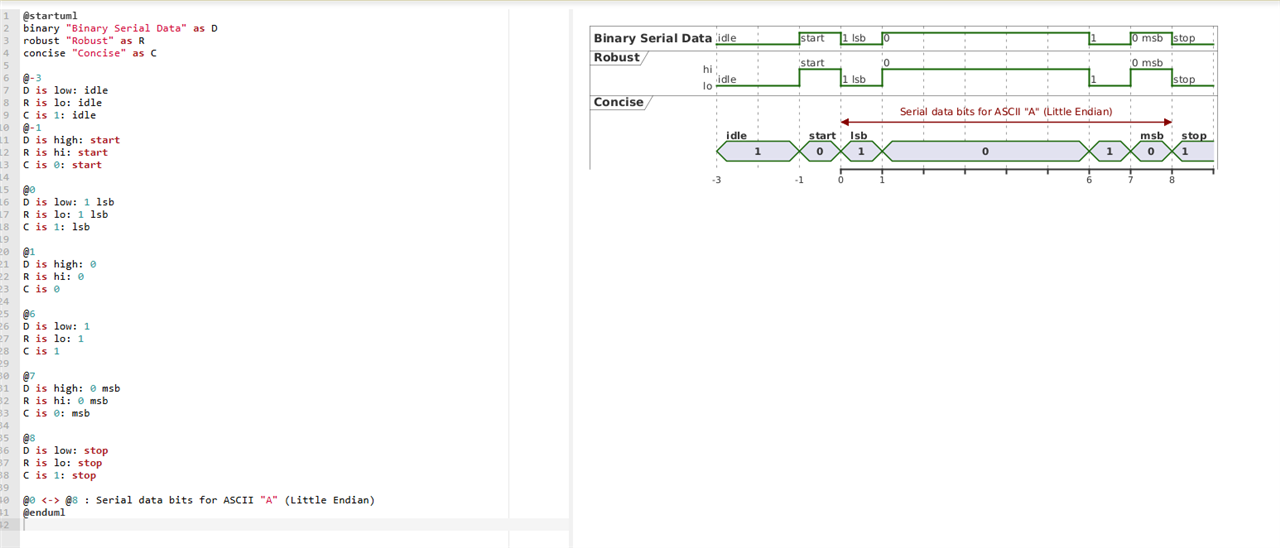
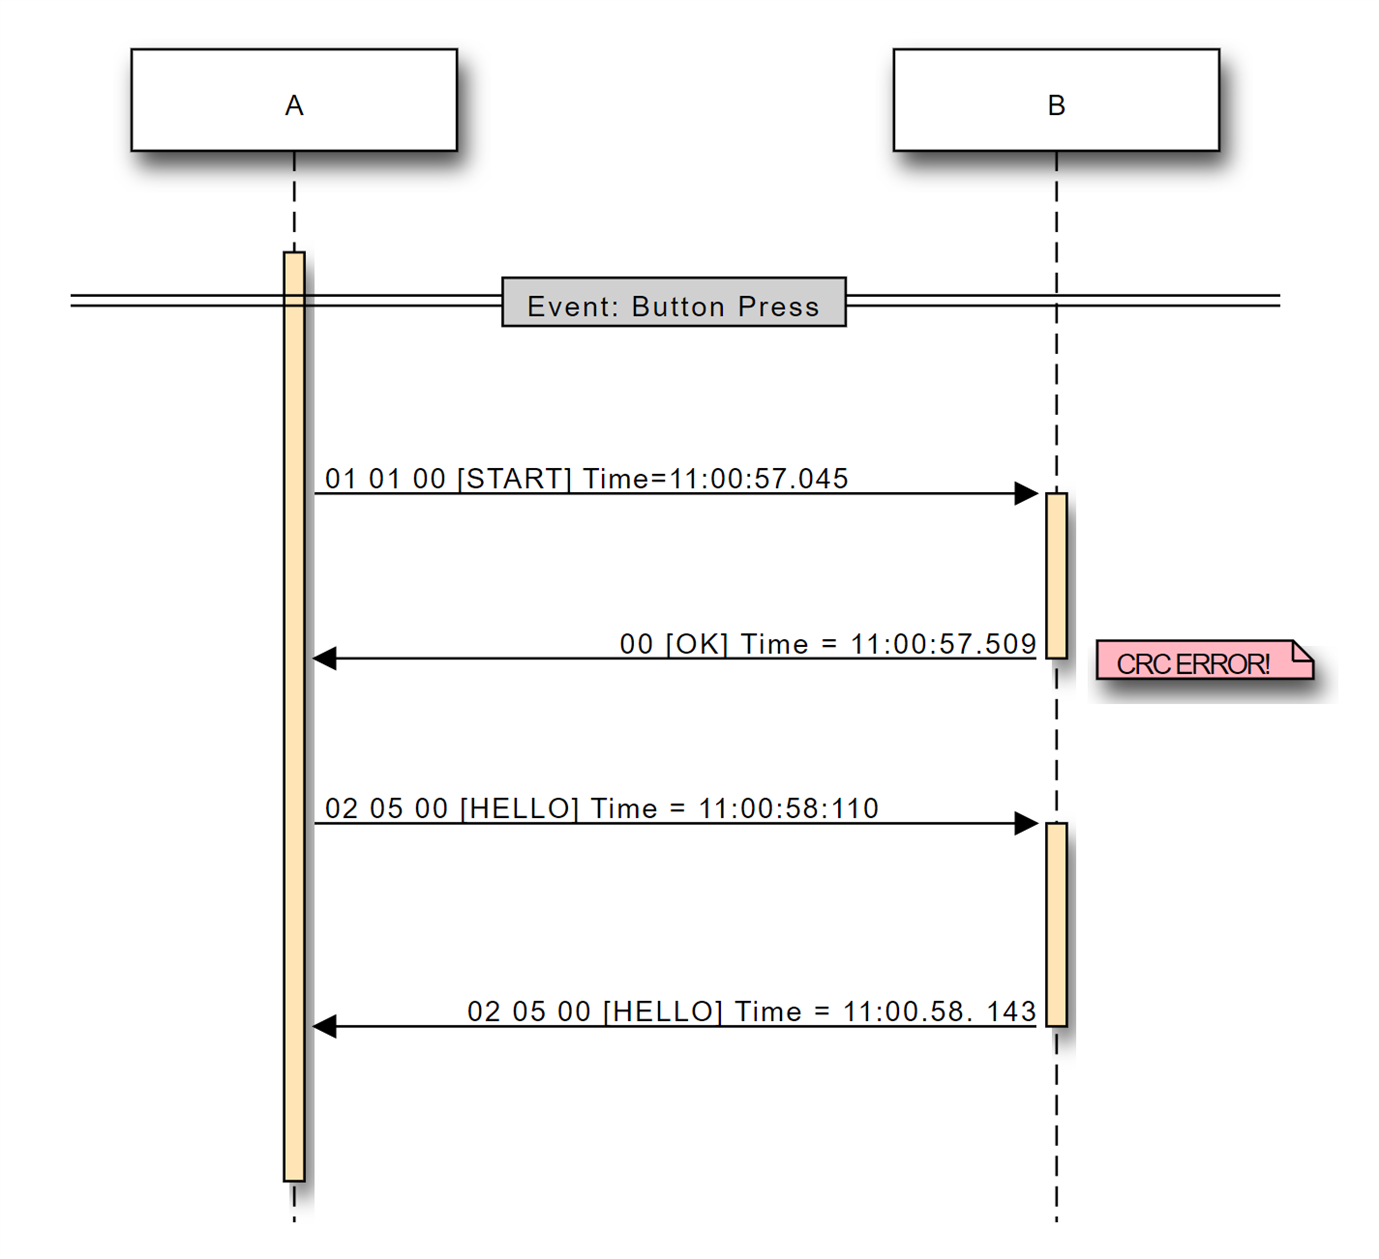
That sort of documents the general overview of the data where you get to see the activity, the timings between send and receive activity and the actual data transferred. But once you start to dig deeper into the data you ideally need to be able to work on the captured data in other ways. Some of it I've switched to WaveDrom where the exact timing is of less interest but it can be time consuming to extract the captured data and then create the mark-up and even then getting printouts can sometimes be problematic if not viewing on-line. It's also yet another application.
I guess it pays to choose your scope carefully and making sure that it can export captures in a wide range of formats from the outset.
However I'm interested generally in what other tools and techniques have been used in this area.