element14 Community
element14 Community
    Register Log In
  • Site
  • Search
  • Log In Register
  • Community Hub
    Community Hub
    • What's New on element14
    • Feedback and Support
    • Benefits of Membership
    • Personal Blogs
    • Members Area
    • Achievement Levels
  • Learn
    Learn
    • Ask an Expert
    • eBooks
    • element14 presents
    • Learning Center
    • Tech Spotlight
    • STEM Academy
    • Webinars, Training and Events
    • Learning Groups
  • Technologies
    Technologies
    • 3D Printing
    • FPGA
    • Industrial Automation
    • Internet of Things
    • Power & Energy
    • Sensors
    • Technology Groups
  • Challenges & Projects
    Challenges & Projects
    • Design Challenges
    • element14 presents Projects
    • Project14
    • Arduino Projects
    • Raspberry Pi Projects
    • Project Groups
  • Products
    Products
    • Arduino
    • Avnet & Tria Boards Community
    • Dev Tools
    • Manufacturers
    • Multicomp Pro
    • Product Groups
    • Raspberry Pi
    • RoadTests & Reviews
  • About Us
  • Store
    Store
    • Visit Your Store
    • Choose another store...
      • Europe
      •  Austria (German)
      •  Belgium (Dutch, French)
      •  Bulgaria (Bulgarian)
      •  Czech Republic (Czech)
      •  Denmark (Danish)
      •  Estonia (Estonian)
      •  Finland (Finnish)
      •  France (French)
      •  Germany (German)
      •  Hungary (Hungarian)
      •  Ireland
      •  Israel
      •  Italy (Italian)
      •  Latvia (Latvian)
      •  
      •  Lithuania (Lithuanian)
      •  Netherlands (Dutch)
      •  Norway (Norwegian)
      •  Poland (Polish)
      •  Portugal (Portuguese)
      •  Romania (Romanian)
      •  Russia (Russian)
      •  Slovakia (Slovak)
      •  Slovenia (Slovenian)
      •  Spain (Spanish)
      •  Sweden (Swedish)
      •  Switzerland(German, French)
      •  Turkey (Turkish)
      •  United Kingdom
      • Asia Pacific
      •  Australia
      •  China
      •  Hong Kong
      •  India
      •  Korea (Korean)
      •  Malaysia
      •  New Zealand
      •  Philippines
      •  Singapore
      •  Taiwan
      •  Thailand (Thai)
      • Americas
      •  Brazil (Portuguese)
      •  Canada
      •  Mexico (Spanish)
      •  United States
      Can't find the country/region you're looking for? Visit our export site or find a local distributor.
  • Translate
  • Profile
  • Settings
Community Hub
Community Hub
Member's Forum Text-based schematics?
  • Blog
  • Forum
  • Documents
  • Quiz
  • Events
  • Leaderboard
  • Polls
  • Files
  • Members
  • Mentions
  • Sub-Groups
  • Tags
  • More
  • Cancel
  • New
Join Community Hub to participate - click to join for free!
Actions
  • Share
  • More
  • Cancel
Forum Thread Details
  • Replies 13 replies
  • Subscribers 551 subscribers
  • Views 2154 views
  • Users 0 members are here
Related

Text-based schematics?

neuromodulator
neuromodulator over 1 year ago

I frequently end up spending a lot of time trying to make my schematics look nice. There's the whole dilemma of when to wire pins and when to just label them. Then of course, you must also figure out the best way to organize everything, where to position the components and when to hierarchize parts. Also, creating new symbols many times requires much more than drawing a box with pins, and can also consume a fair amount of time. This kinda reminds me of LABview, where lot of time is spent on rearranging nodes and wires, when ideally you would want to focus on the logic itself. It feels like there should be a more efficient way to do all this. Maybe using some standardized language? What do you think?

  • Sign in to reply
  • Cancel

Top Replies

  • dougw
    dougw over 1 year ago +4
    I think of E-CAD as "word processors" for electronic design and I have my own conventions to make schematics "readable". I can't imagine a text base description language that would be as clear or readable…
  • shabaz
    shabaz over 1 year ago +2
    That's a natural desire to make diagramming more efficient : ) (I guess you don't mean HDLs, since the output from them usually you wouldn't want to convert down to a schematic more detailed than a block…
  • michaelkellett
    michaelkellett over 1 year ago in reply to dang74 +1
    I find the interconnect in HDLs completely incomprehensible. So I use a block diagram editor at the top level to hang all the blocks together but I find the HDL much better at describing the logic. …
Parents
  • shabaz
    shabaz over 1 year ago

    That's a natural desire to make diagramming more efficient : )

    (I guess you don't mean HDLs, since the output from them usually you wouldn't want to convert down to a schematic more detailed than a block diagram, i.e. not at the level of say discrete components in an analogue circuit for instance).

    Over the years, I've tried automating diagramming many times, with varying results.

    For instance, there was a period where I wanted nice message sequence diagrams, so I automated that, not using SVG at the time, but some other graphical language or format which I can't recall.

    Simple block diagrams are fairly feasible directly typing SVG, with no higher-level language. I wanted a resistor color code, I did that in raw SVG, it was simpler than manually drawing it.

    image

    The SVG looked like this:

    image


    Another time, I wanted to sketch out some sort of timeline of activity, and that was quite successful, it was quite elaborate, using a mySQL database to store lots of timestamps and event names, and then plotting from that, and having the ability to click on the graphic and identifying the full entry in the database. This sort of stuff is great when there are thousands or tens of thousands of events.

    I think there's a lot of potential nowadays with languages such as Python so that diagrams could be programmatically created (and it would be possible to write higher-level functions to (say) place a specific component etc), but I've often found I prefer to tweak things myself, and for the high-quality diagrams, I stick with PowerPoint. For instance, I won't always center everything, because some things just visually look better eyeballed, even though they are not technically aligned (same reason old classic cars look nice with their french-curved metalwork rather than perfect computer-made curves. That's the sort of thing that would get awkward to do programmatically without many iterations in code, until it looked visually right. I think you hint at the same problem when you mention the problem of labeling things, because although there's a desire to just focus on logic, there's also another desire, to make it visually pleasing too, and that will still need the human input to nudge things one or two pixels, or move a node a fraction to the left more than a computer may have done, and so on. I actually do the same thing even with computer-drawn charts. If I'm using Matlab, then I'll edit the graphic output, because I like nudging the values on the axis a little bit different to what the computer did! I don't think anyone has ever noticed that though, but nevertheless it makes me feel better knowing a chart has been tweaked to what I feel at the time is just right!

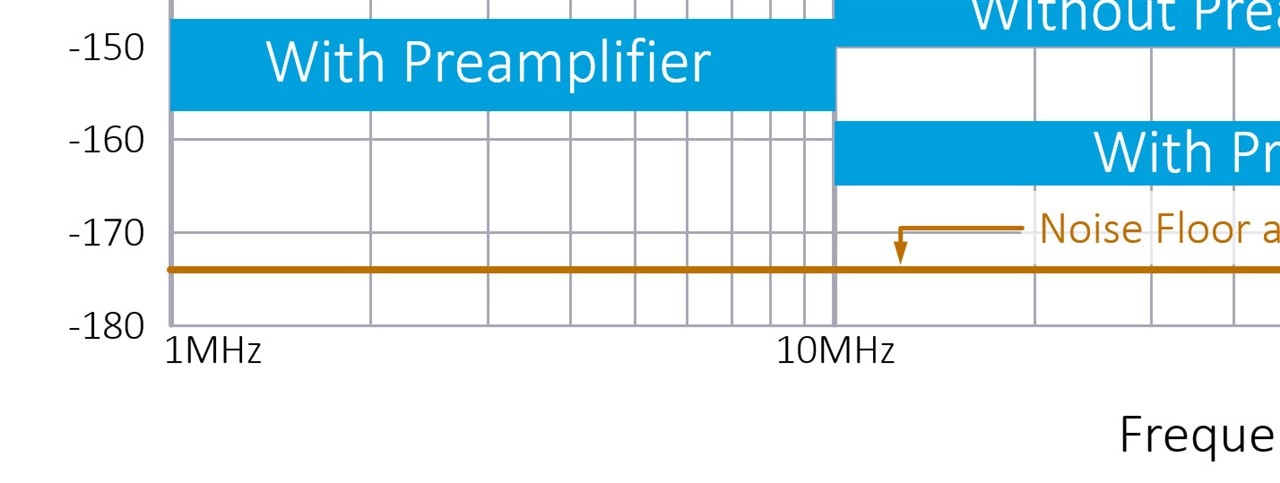
    Example below; the text "1MHz" has been nudged to the right compared to what Matlab would have done by default, i.e. rightly or wrongly, I preferred to trust my sense of what looks visually better, more than the software.

    image

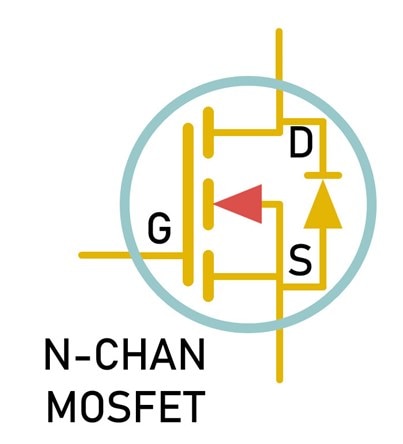
    If it's a simple schematic, then I like using PowerPoint (since I've got shapes for most of the basic components already drawn over the years), otherwise I'll draw in KiCad.Over the years I have plenty of basic shapes drawn in PowerPoint, e.g. MOSFET example below. For sure I could construct that in a programming language, but I bet I'd still want to tweak manually.

    image

    Anyway, back to Python; one method I've used on occasion, is to use it to create the desired diagram, and then edit the generated SVG output in (say) Inkscape. However, it's a one-way thing, i.e. if any changes need to be made, you'd have to either start from the Python code again and then again modify using Inkscape, or, just make further changes to the output, and accept that the Python code wont be used again, it has served its purpose for originating that particular diagram.

    Also, KiCad supports Python, so technically it may be possible to use that to directly create a schematic, but I've never tried that. I've done a few basic things with Python with KiCad, it's for sure powerful, but I'd be speculating if I suggested it's possible today to entirely build a schematic using it. I think it could be a lot more effort than just manually drawing the schematic though.

    • Cancel
    • Vote Up +2 Vote Down
    • Sign in to reply
    • Cancel
Reply
  • shabaz
    shabaz over 1 year ago

    That's a natural desire to make diagramming more efficient : )

    (I guess you don't mean HDLs, since the output from them usually you wouldn't want to convert down to a schematic more detailed than a block diagram, i.e. not at the level of say discrete components in an analogue circuit for instance).

    Over the years, I've tried automating diagramming many times, with varying results.

    For instance, there was a period where I wanted nice message sequence diagrams, so I automated that, not using SVG at the time, but some other graphical language or format which I can't recall.

    Simple block diagrams are fairly feasible directly typing SVG, with no higher-level language. I wanted a resistor color code, I did that in raw SVG, it was simpler than manually drawing it.

    image

    The SVG looked like this:

    image


    Another time, I wanted to sketch out some sort of timeline of activity, and that was quite successful, it was quite elaborate, using a mySQL database to store lots of timestamps and event names, and then plotting from that, and having the ability to click on the graphic and identifying the full entry in the database. This sort of stuff is great when there are thousands or tens of thousands of events.

    I think there's a lot of potential nowadays with languages such as Python so that diagrams could be programmatically created (and it would be possible to write higher-level functions to (say) place a specific component etc), but I've often found I prefer to tweak things myself, and for the high-quality diagrams, I stick with PowerPoint. For instance, I won't always center everything, because some things just visually look better eyeballed, even though they are not technically aligned (same reason old classic cars look nice with their french-curved metalwork rather than perfect computer-made curves. That's the sort of thing that would get awkward to do programmatically without many iterations in code, until it looked visually right. I think you hint at the same problem when you mention the problem of labeling things, because although there's a desire to just focus on logic, there's also another desire, to make it visually pleasing too, and that will still need the human input to nudge things one or two pixels, or move a node a fraction to the left more than a computer may have done, and so on. I actually do the same thing even with computer-drawn charts. If I'm using Matlab, then I'll edit the graphic output, because I like nudging the values on the axis a little bit different to what the computer did! I don't think anyone has ever noticed that though, but nevertheless it makes me feel better knowing a chart has been tweaked to what I feel at the time is just right!

    Example below; the text "1MHz" has been nudged to the right compared to what Matlab would have done by default, i.e. rightly or wrongly, I preferred to trust my sense of what looks visually better, more than the software.

    image

    If it's a simple schematic, then I like using PowerPoint (since I've got shapes for most of the basic components already drawn over the years), otherwise I'll draw in KiCad.Over the years I have plenty of basic shapes drawn in PowerPoint, e.g. MOSFET example below. For sure I could construct that in a programming language, but I bet I'd still want to tweak manually.

    image

    Anyway, back to Python; one method I've used on occasion, is to use it to create the desired diagram, and then edit the generated SVG output in (say) Inkscape. However, it's a one-way thing, i.e. if any changes need to be made, you'd have to either start from the Python code again and then again modify using Inkscape, or, just make further changes to the output, and accept that the Python code wont be used again, it has served its purpose for originating that particular diagram.

    Also, KiCad supports Python, so technically it may be possible to use that to directly create a schematic, but I've never tried that. I've done a few basic things with Python with KiCad, it's for sure powerful, but I'd be speculating if I suggested it's possible today to entirely build a schematic using it. I think it could be a lot more effort than just manually drawing the schematic though.

    • Cancel
    • Vote Up +2 Vote Down
    • Sign in to reply
    • Cancel
Children
No Data
element14 Community

element14 is the first online community specifically for engineers. Connect with your peers and get expert answers to your questions.

  • Members
  • Learn
  • Technologies
  • Challenges & Projects
  • Products
  • Store
  • About Us
  • Feedback & Support
  • FAQs
  • Terms of Use
  • Privacy Policy
  • Legal and Copyright Notices
  • Sitemap
  • Cookies

An Avnet Company © 2025 Premier Farnell Limited. All Rights Reserved.

Premier Farnell Ltd, registered in England and Wales (no 00876412), registered office: Farnell House, Forge Lane, Leeds LS12 2NE.

ICP 备案号 10220084.

Follow element14

  • X
  • Facebook
  • linkedin
  • YouTube