


I wrote a quick overview of how the hrmshield sketch works in my last post, so in this post I'd like explain what I do with the data it produces. All the code along with sample data are in the hrmshield github repo.
Parse
After doing a test run with the hrmshield recording, the SD card contains a text file with timestamped BPM readings. I have one script, parse.pl, which reads the text file (HRM23.CSV for example) and reformats it so that there is one BPM reading per line along with timestamp. This makes the data easier to then filter and graph.
Filter
Filtering is needed to toss out invalid BPM readings. Eric Boyd uses Asymptote to filter and graph HeartSpark data (see his Heart Plot repo). However, the Asymptote script expects data to come in a different format than my hrmshield. The HeartSpark logs data to EEPROM and then depends on a Processing sketch to download the data from it via the serial port.
I initially tried to adapt the Asymptote script but ran into difficulty. I decided to just go with my old standby Perl and copy the filtering logic from Eric's Asymptote script. This is resulted in filter.pl in the hrmshield repo. It is run with the output of parse.pl.
Graph
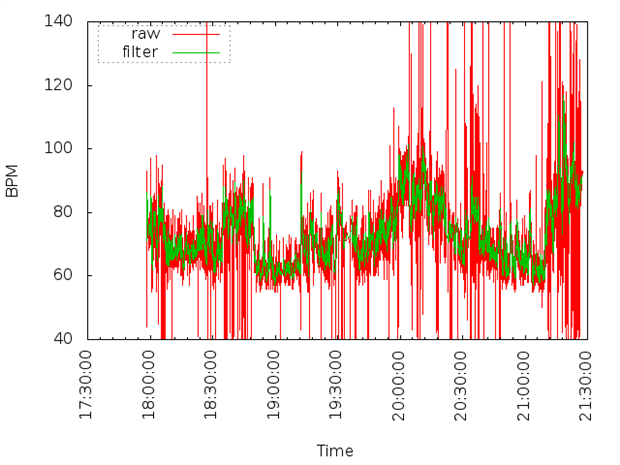
The output of parse.pl and filter.pl are both joined into one file so that raw versus filtered BPM data can be graphed. This is done by graph.sh which runs end-to-end needing only the raw CSV filename as a parameter to produce an image of the graph. For example, running ./graph.sh data/HRM23.CSV creates ./graph/hrm.png.
I use gnuplot for graphing with two different configuration files: hrmshield-png.plot & hrmshield.plot. The first is utilized by graph.sh, as describe above, to generate a PNG of the graph:
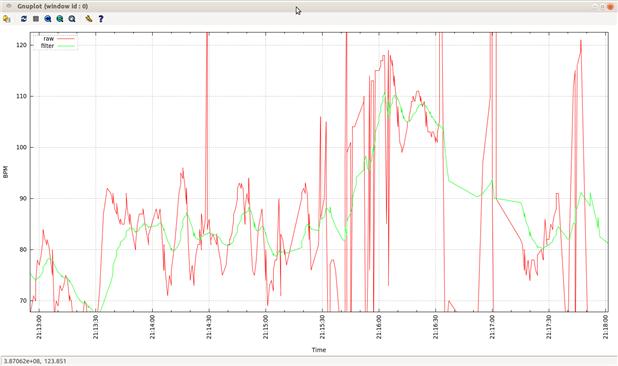
The second is opened in a GUI frontend to gnuplot called qgfe. qgfe is very useful for exploring data as I can freely zoom in on any area of the graph:
So that is a brief run through of how I filter and graph the data from the hrmshield. Looking forward, I want to further explore how I can improve the filter script to better normalize the BPM data so that the graph doesn't fluctuate as much.
Cheers,
Drew
Top Comments