


I created this blog post from the information I originally posted in this thread: If I Had a Hammer made by jack.chaney56 .
1) Using Excel (or other spreadsheets) to compute/visualize the data.
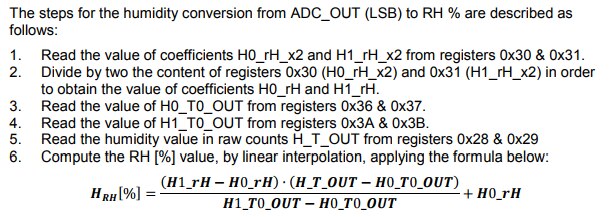
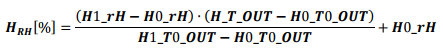
I will consider the STMicroelectronics HTS221HTS221 as an example. The sensor outputs temperature and humidity in 16-bit registers in 2nd complement format I will now focus only on relative humidity measurement (the temperature is the same. The datasheet states that the output should be linear (related to the humidity) and two reference values are provided (stored in the sensor by STM) - two output registers values at obviously two relative humidity values at which the registers values have been recorded.
In order to make sense of the values, you need to open another application note.
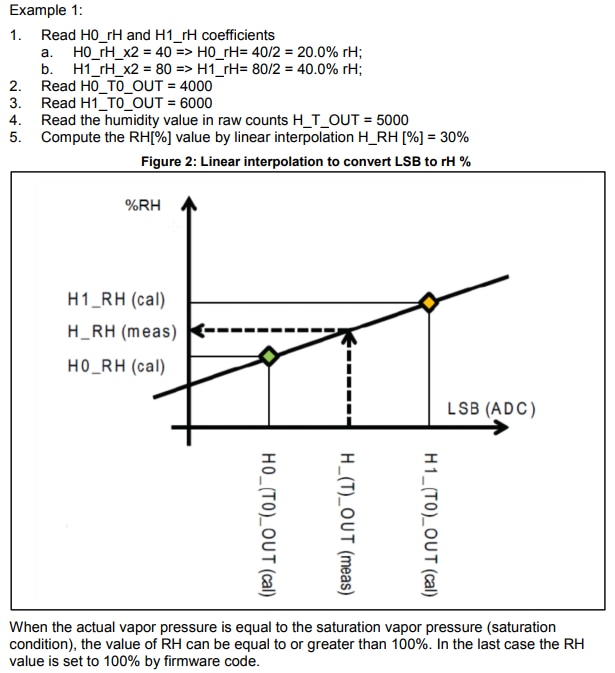
The following pictures are taken from the application note:
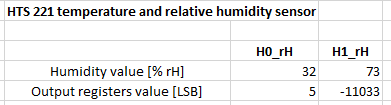
So I have read the calibration values over I2C and entered them into an Excel spreadsheet:
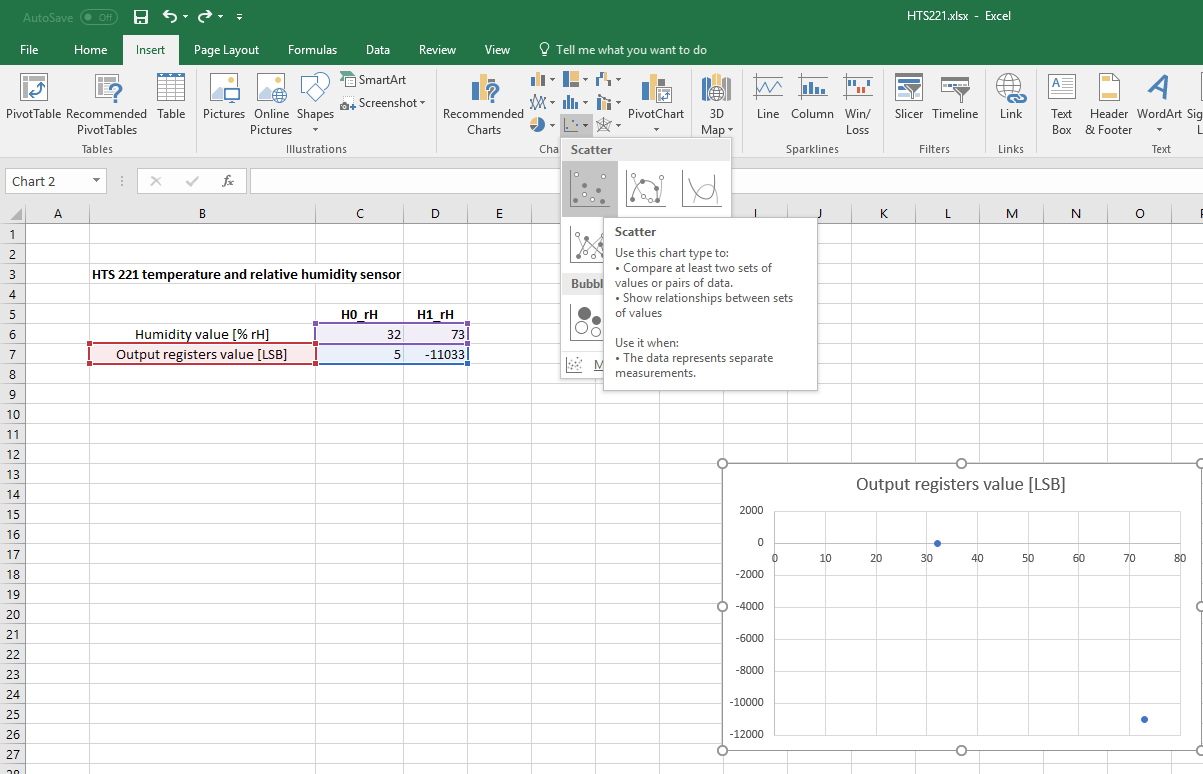
Here comes the first surprise, but let's visualize it. I selected the data and notes (B6:D7) and inserted a scatter plot:
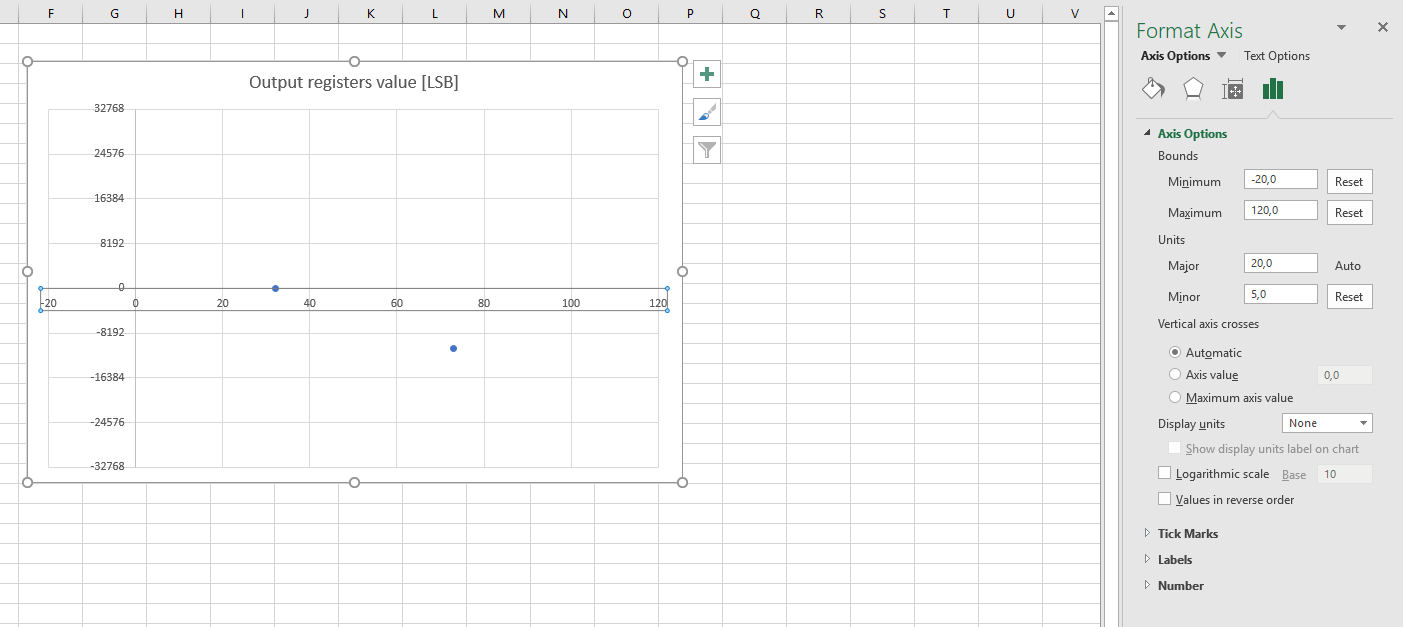
Then I made a few minor changes to correspond the plot with possible output values. Double clicking on the X and Y axis show a dialogue where it's possible to set axis bounds (among other thing). Minimum for a 16-bit signed number is −32 768 and maximum is 32 767. I also adjusted the X axis to see -20 to + 120 % values.
You might say we should only adjust the X axis for 0 to 100 value, but this gives us a bit better idea of what values could appear in the output register. Later I found out that one of the sensor outputs about 117 % rH, which is nonsense; while another sensor, SHT21 said it's just about 91 % rH.
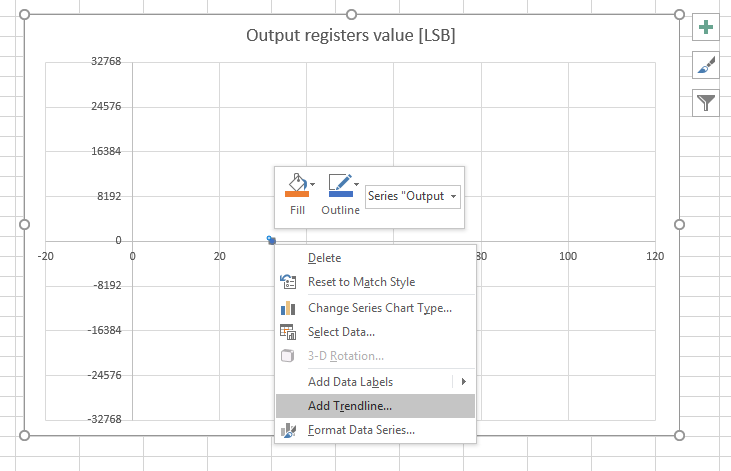
Then I added a trend line (right click on one of the values - the blue dot in my case - and selecting Add Trendline...).
Additional dialog is shown with various options. Since we know that out sensor output has linear characteristic, let's stick with linear. We know our values at 32 % and 73 % rH and we would like to see the values through the whole possible spectrum (plus the 20 % surroundings). I edited the forecast values, forward to 47 ( 73 % + 47 % = 120 %) and backward to 52 (32 % - 52 % = -20 %). I also checked Display Equation on chart and display R-squared value on chart.
The result is shown immediately:
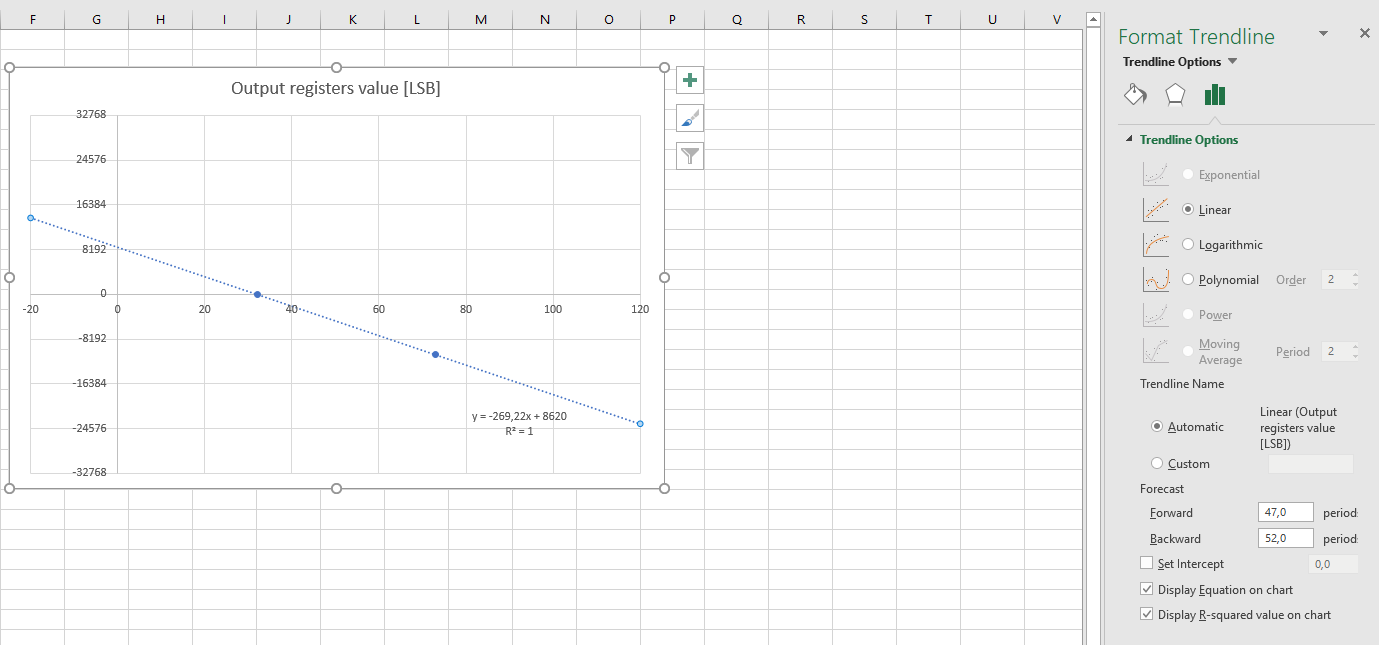
As you can see, the output value has different slope than in the datasheet and the application note. However, the math remains the same.
More interesting is the equation and the R-sqared value:
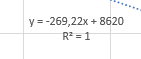
This is another way to compute the sensor output value than using the computation from the application note. (Try it yourself with an calculator.) This makes no sense in this case, of course, since the equation suggested by STM satisfies with integer values. The power of computing and showing the trend line and the R-squared value is in all unknown characteristics. (For example if more values are measured and you are not sure, whether the sensor provides a linear / logarithmic output.) The R-squared value here is 1, which would normally mean a perfect match of the suggested function to the values provided, but we got that because we provided only 2 values. The more values, the better idea of the relation you get.
More about trend lines can be found in this Microsoft Office support article: https://support.office.com/en-us/article/Add-change-or-remove-a-trendline-in-a-chart-fa59f86c-5852-4b68-a6d4-901a745842a…
More about R-squared value can be found here: https://people.duke.edu/~rnau/rsquared.htm
2) Using Excel (or other spreadsheets) to find the missing data.
Now let's say you can read the humidity register values and compute the relative humidity. What if you wanted to answer the opposite question, what register value will be valid for a specific relative humidity (for example to set some threshold or interrupt directly in the sensor) ?
I created one more column to the table and typed the equation for relative humidity computation:
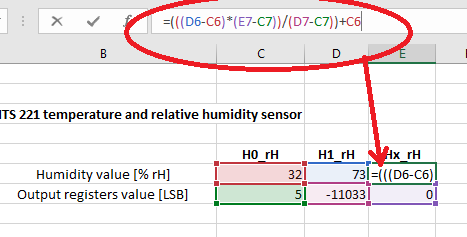
If I enter my output registers value, I get the relative humidity value.
To do the opposite, we will use a Goal Seek function (Data > What-If Analysis > Goal Seek...)
(In previous Office editions, there was an extension called a Solver (it might not be present in some editions or you might need to enable it. More information on solver can be found in this support article: https://support.office.com/en-us/article/Define-and-solve-a-problem-by-using-Solver-9ed03c9f-7caf-4d99-bb6d-078f96d1652c .)

For example, I would like to know what value will be present in the registers if the humidity is 62,5 %.
So I will enter the following values to the dialog:
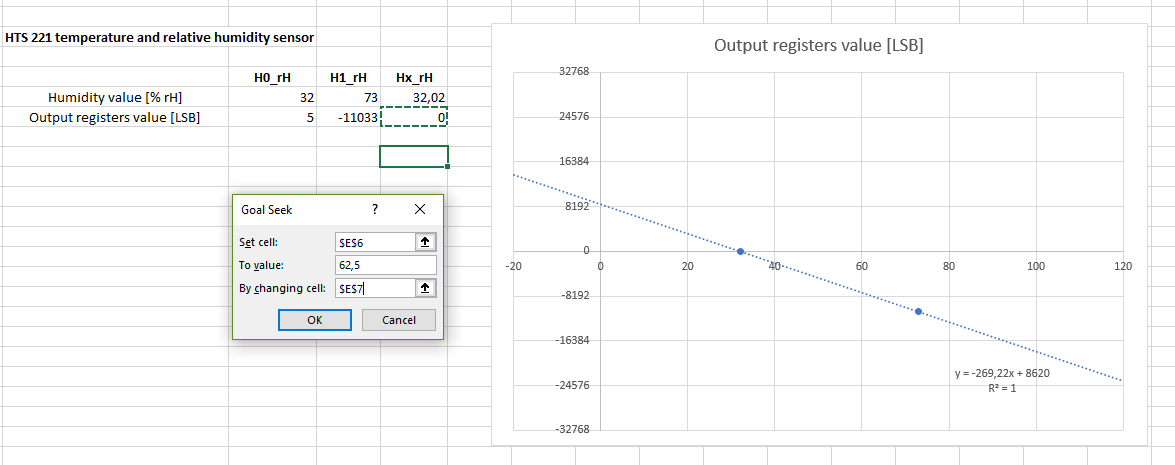
We want to set the cell with the humidity value to 62,5 by changing cell with the output register.
After clicking OK, the computation takes a while and shows us the result.
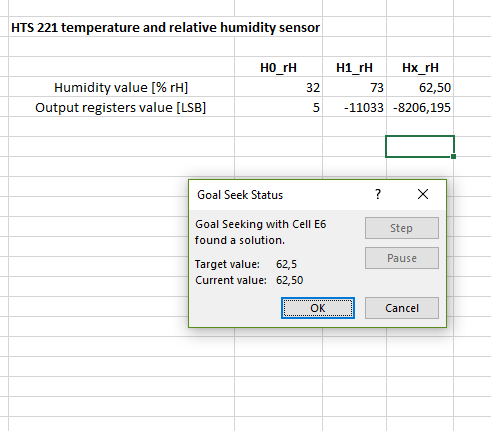
And we have a solution! Well, sort of  The output register value is not round, which means we can adjust it to -8206 and/or -8207 and see whether this humidity value difference is OK for our application. (In this case is the sensor noise bigger than the difference between these two values, so I would say it fits.)
Final thoughts
I hope this helps someone
There are also more tools for advanced analysis etc. but I don't feel the confidence in talking about them.
Please note that I am aware that real-life applications are not always that simple as in the examples, but spreadsheets are a huge help for almost everything I do.
TIP: I used Microsoft Office 2016 Professional Plus edition (the full-featured edition, not available for resale). Microsoft has a Home Use Program (HUP) that entitles employees to buy software for which your company has a subscription contract with Microsoft (typically Microsoft Office, Project, Visio), for about 25 $.
Top Comments