


In December of 2017 I had a solar system installed at my house. This is my first experience using solar technology. I thought that since I've had the system running for a full year that it useful to review how well it has performed relative to my expectations. I had previously posted the system description as part of the Heat is On Solar Project contest on Project14: https://www.element14.com/community/community/project14/solarpowerdevices/blog/2018/07/31/solar-spec-intro, https://www.element14.com/community/community/project14/solarpowerdevices/blog/2018/08/02/solar-system-description.
I monitor my system performance on a daily basis using two sources:
1) The Web Portal of the inverter manufacturer (SMA https://www.sunnyportal.com/)
2) The Netmeter on my electrical service from Portland General Electric
Unfortunately, I cannot get any daily online data from PGE and they do not allow customers any remote access to the meter. I do get monthly data with my bill but that does not allow me visibility of my daily energy usage. So, part of my daily routine is to go out and visually read the meter. The meter provides two numbers, the amount of power that is taken from the grid and the amount of power that is put back to the grid. Both numbers are running totals (aggregates) in kWhrs.
.
Power consumption = [power from grid] - [power to grid] + [power generated by the system].
Our annual electric power consumption averages between 5.2 to 5.4 MWhrs. During the system design phase I wanted to optimize system cost but also provide a 10% margin on power generation to allow for performance degradation over the life of the system and also for weather variations. The solar company used historical average monthly irradiance values for our area to come up with a predicted annual solar production of 5.9 MWhrs for my system. That number did not account for the shadowing I get from my neighbor's house and trees. My neighbor's house is directly to the south and he has tall trees to the southeast and southwest. From late fall through early spring I get shadowing from his chimney and trees primarily on my lower string of panels. Based on data that I collected from January through May, I readjusted my annual production estimate down to 5.46 MWhrs to account for the shadowing effect. Therefore, I may not have the margin that I wanted.
Here is a graph of my yearly production that I got from the SMA website. The yield expectation was my best guess at how the estimated power would be distributed.
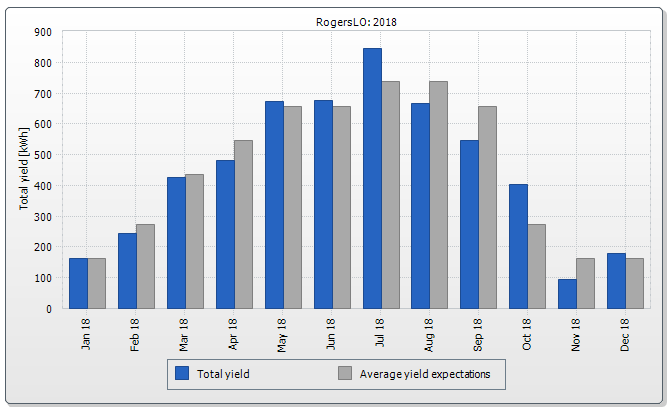
The total power generated was 5.38 MWhrs. My total power consumption was 5.20 MWhrs. So, I ended the year with a surplus of 180 kWhrs. It's too bad the power company doesn't pay you for that excess energy that gets put back on the grid. It turns out that I should have gotten another 100-150 kWhrs of power but the inverter shutdown in November due to an "electric arc fault". And, of course, Murphy's Law says that would happen while I was on vacation in New Zealand so the system was down for 11 days. Have not determined what caused that fault; the system restarted cleanly.
The shadowing was a lot larger effect than I expected. I could have requested a more extensive simulation to model that effect but it didn't seem to be worth the time and effort. Since I have a south facing system the effect only occurs from October through April when the sun's inclination is much lower. The other five months the sun's path is high enough that I don't get any shadowing. Since I am currently exceeding my power consumption, it probably would not have been worth the extra cost of using micro-inverters rather than the string inverter to provide additional margin.
Here's a set of graphs that illustrate the shadowing effect. The plots are of clear sunny days in January, April, July, and October to compare the system seasonal performance.
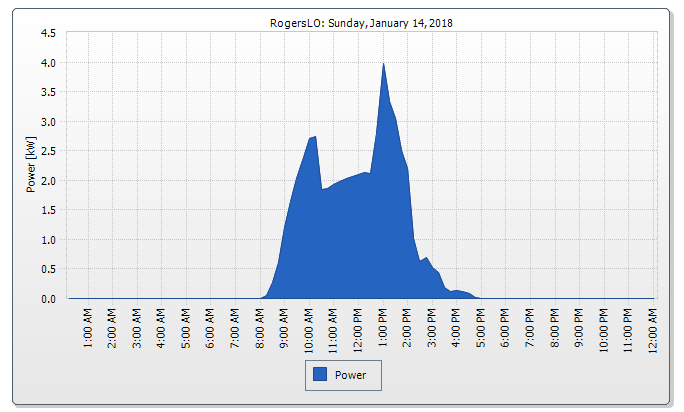
Yield on January 14 was 13.38 kWhrs. The steep slope at 9am and 2pm are due to the trees and the notch is due to the chimney. The sun angle is so low that I only get a brief period at 1pm when I get full sun on all the panels.
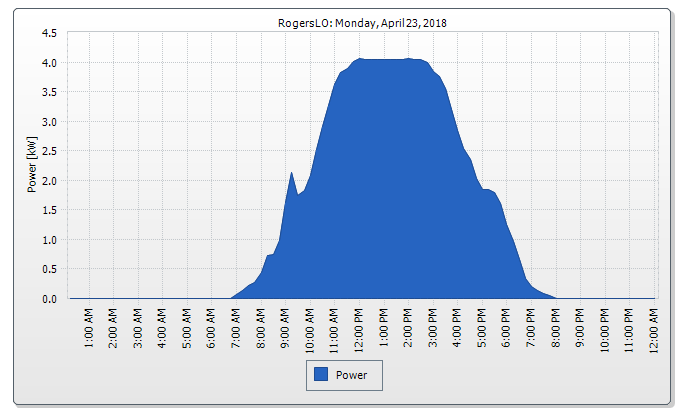
Yield on April 23 was 30.11 kWhrs. The shadowing from the trees is reduced and there is no shadowing from the chimney. You can see that the inverter is clipping as the panels are operating close to maximum efficiency. The ambient temperature was about 20C.
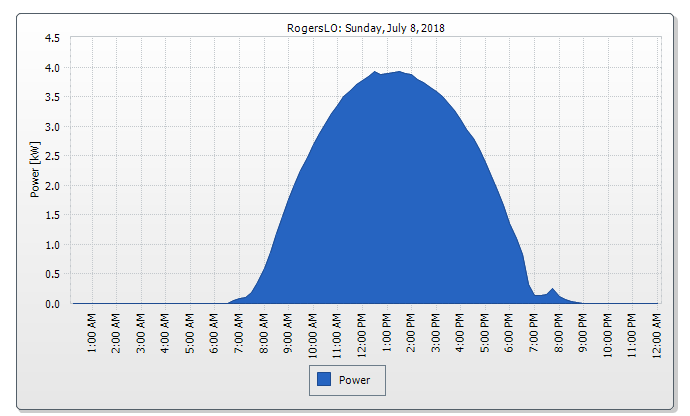
Yield on July 8 was 30.83 kWhrs. There is no shadowing during the summer due to the high sun angle. One thing that I did not anticipate was the reduction in panel efficiency due to heat. You'll notice compared to April's graph that the inverter is not clipping because the panels are producing less than optimal power. The ambient temperature was about 35C and I'm sure it was much hotter on the roof. So, it turns out that a good day in the summer is not much better than a good day in the spring (although there are many more good days in the summer).
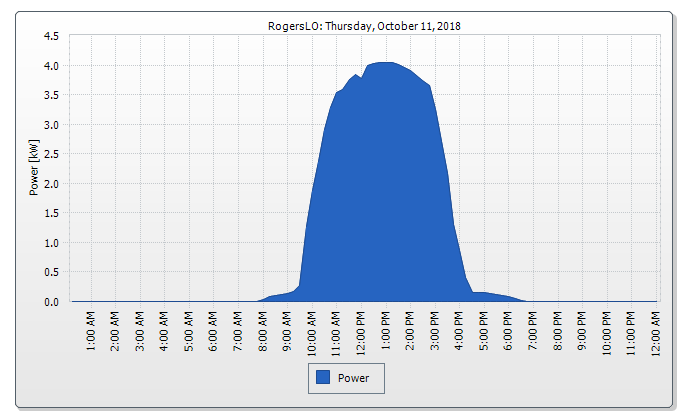
Yield on October 11 was 21.52 kWhrs. You can see the shadowing from the trees is back and the shadow from the chimney is just starting to fall on the lower string.
Summary:
I've learned a lot about solar power over the past year. I can pretty much guess how much power my system is producing by looking at quality of the shadows the sun is creating. Overall it's been a satisfying experience and I wish I had installed the system earlier. The system is currently meeting our consumption needs although with not much margin. And I'm not sure how they calculate it, but the SMA website reports that we have avoided generating 3.8 tons of CO2 so far.
A bonus has been that I've had the incentive to build remote monitoring capability (my Solar SPEC project). I'd love to add remote restart capability to the inverter, but I'm sure that would violate all kinds of safety standards.....
Top Comments
-

jw0752
-
Cancel
-
Vote Up
+2
Vote Down
-
-
Sign in to reply
-
More
-
Cancel
Comment-

jw0752
-
Cancel
-
Vote Up
+2
Vote Down
-
-
Sign in to reply
-
More
-
Cancel
Children