element14 Community
element14 Community
    Register Log In
  • Site
  • Search
  • Log In Register
  • About Us
  • Community Hub
    Community Hub
    • What's New on element14
    • Feedback and Support
    • Benefits of Membership
    • Personal Blogs
    • Members Area
    • Achievement Levels
  • Learn
    Learn
    • Ask an Expert
    • eBooks
    • element14 presents
    • Learning Center
    • Tech Spotlight
    • STEM Academy
    • Webinars, Training and Events
    • Learning Groups
  • Technologies
    Technologies
    • 3D Printing
    • FPGA
    • Industrial Automation
    • Internet of Things
    • Power & Energy
    • Sensors
    • Technology Groups
  • Challenges & Projects
    Challenges & Projects
    • Design Challenges
    • element14 presents Projects
    • Project14
    • Arduino Projects
    • Raspberry Pi Projects
    • Project Groups
  • Products
    Products
    • Arduino
    • Avnet Boards Community
    • Dev Tools
    • Manufacturers
    • Multicomp Pro
    • Product Groups
    • Raspberry Pi
    • RoadTests & Reviews
  • Store
    Store
    • Visit Your Store
    • Choose another store...
      • Europe
      •  Austria (German)
      •  Belgium (Dutch, French)
      •  Bulgaria (Bulgarian)
      •  Czech Republic (Czech)
      •  Denmark (Danish)
      •  Estonia (Estonian)
      •  Finland (Finnish)
      •  France (French)
      •  Germany (German)
      •  Hungary (Hungarian)
      •  Ireland
      •  Israel
      •  Italy (Italian)
      •  Latvia (Latvian)
      •  
      •  Lithuania (Lithuanian)
      •  Netherlands (Dutch)
      •  Norway (Norwegian)
      •  Poland (Polish)
      •  Portugal (Portuguese)
      •  Romania (Romanian)
      •  Russia (Russian)
      •  Slovakia (Slovak)
      •  Slovenia (Slovenian)
      •  Spain (Spanish)
      •  Sweden (Swedish)
      •  Switzerland(German, French)
      •  Turkey (Turkish)
      •  United Kingdom
      • Asia Pacific
      •  Australia
      •  China
      •  Hong Kong
      •  India
      •  Korea (Korean)
      •  Malaysia
      •  New Zealand
      •  Philippines
      •  Singapore
      •  Taiwan
      •  Thailand (Thai)
      • Americas
      •  Brazil (Portuguese)
      •  Canada
      •  Mexico (Spanish)
      •  United States
      Can't find the country/region you're looking for? Visit our export site or find a local distributor.
  • Translate
  • Profile
  • Settings
Arduino
  • Products
  • More
Arduino
Arduino Forum Fischertechnik and arduino
  • Blog
  • Forum
  • Documents
  • Quiz
  • Events
  • Polls
  • Files
  • Members
  • Mentions
  • Sub-Groups
  • Tags
  • More
  • Cancel
  • New
Join Arduino to participate - click to join for free!
Actions
  • Share
  • More
  • Cancel
Forum Thread Details
  • State Suggested Answer
  • Replies 16 replies
  • Answers 8 answers
  • Subscribers 392 subscribers
  • Views 1996 views
  • Users 0 members are here
  • arduino mega 2560
  • fischertechnik
  • electronics
  • arduino
Related

Fischertechnik and arduino

brv64
brv64 over 7 years ago

Hello!


I'm having a bit of trouble interfacing the Arduino with the Ultrasonic Sensor from Fichertechnik
https://content.ugfischer.com/cbfiles/fischer/Zulassungen/ft/133009-Ultrasonic-distance-sensor.pdf

Does anyone have any idea of how I could make it work?
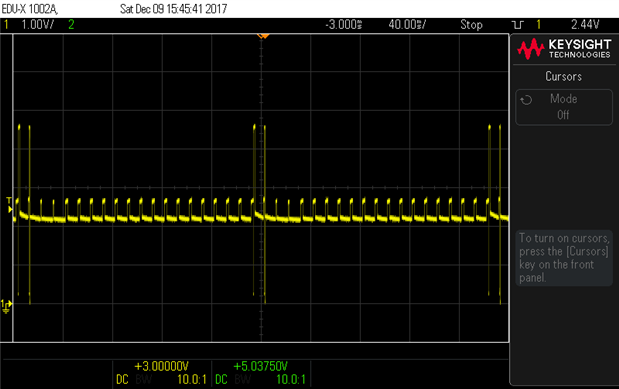
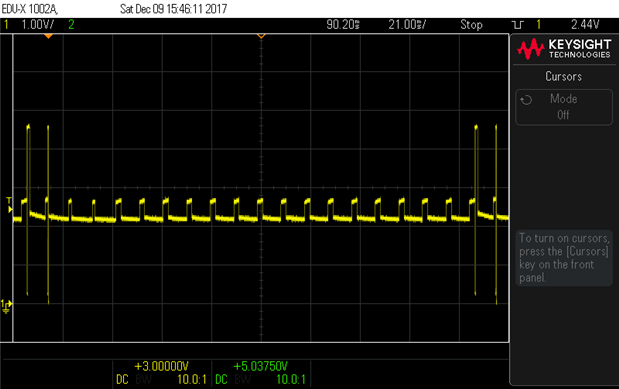
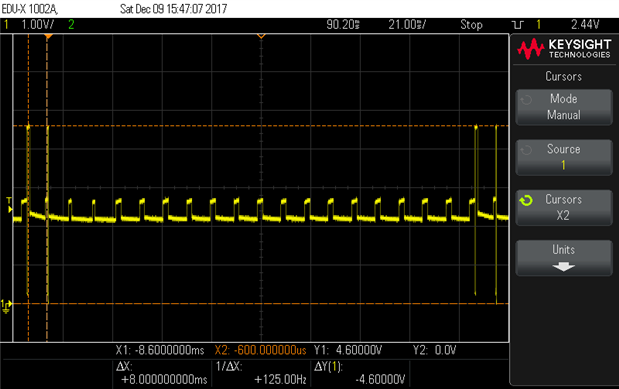
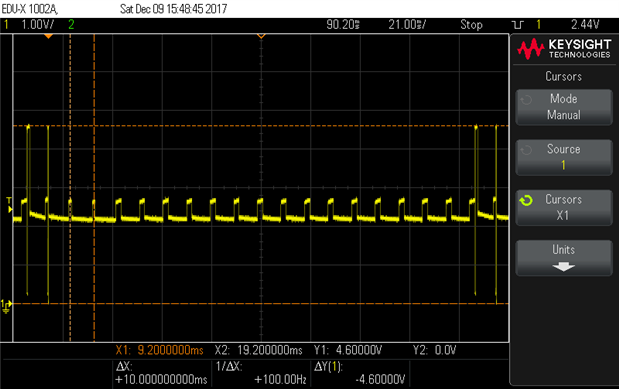
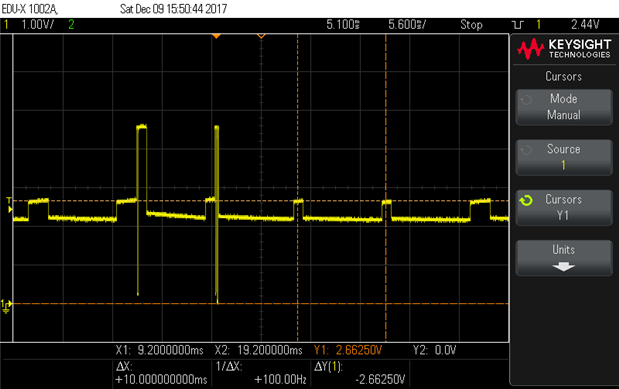
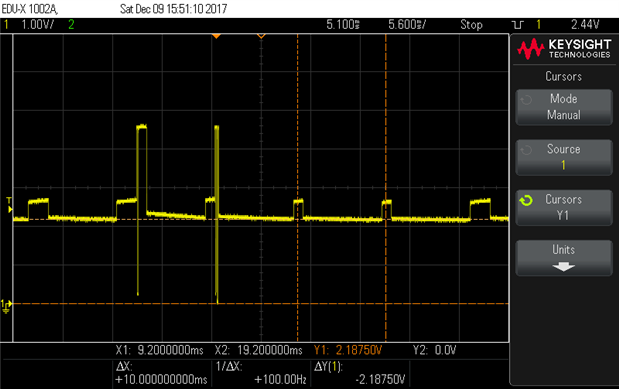
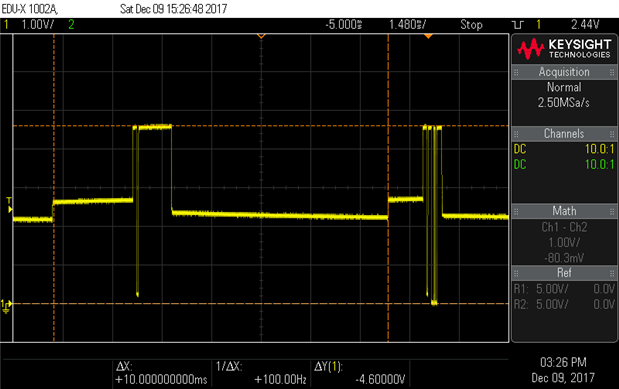
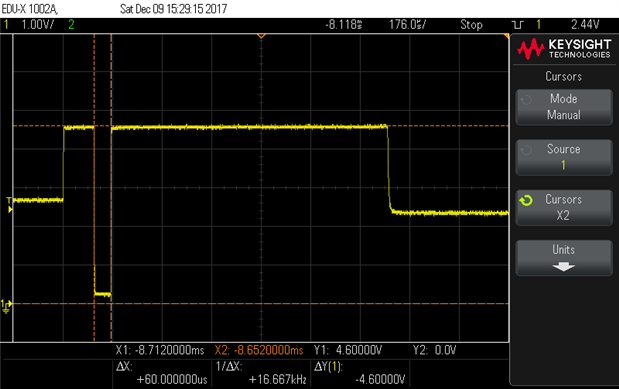
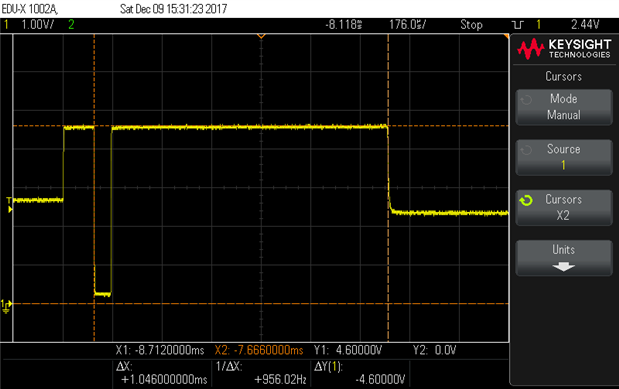
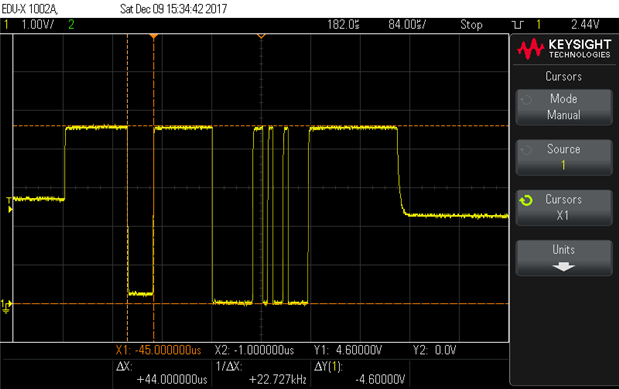
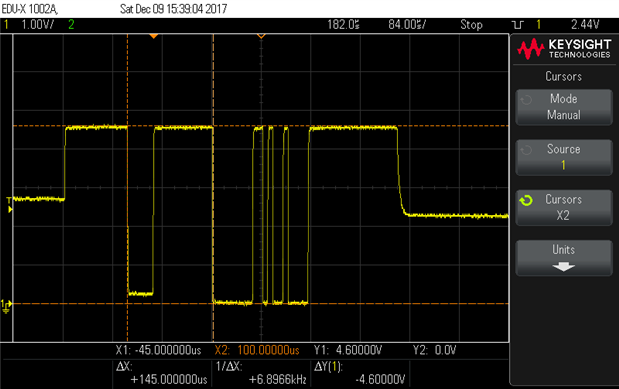
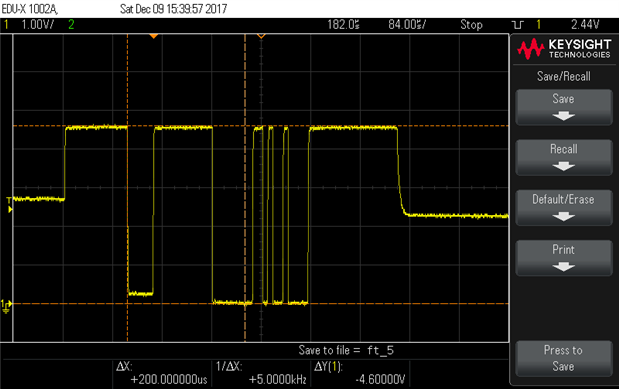
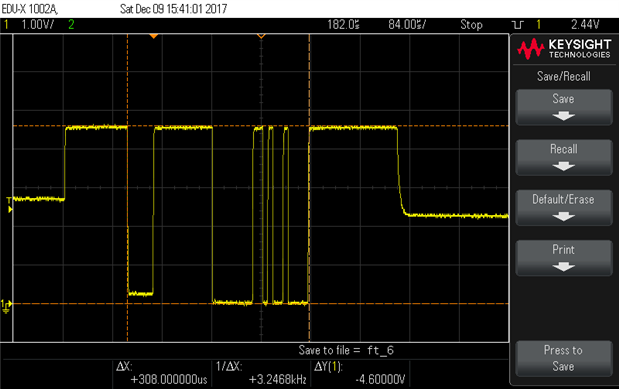
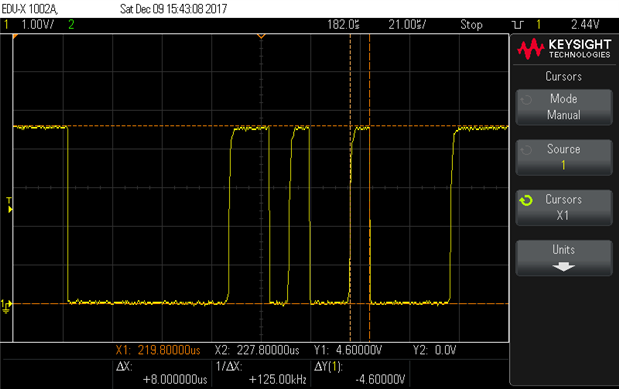
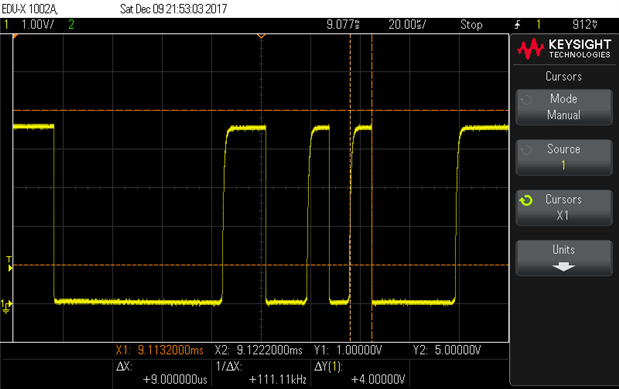
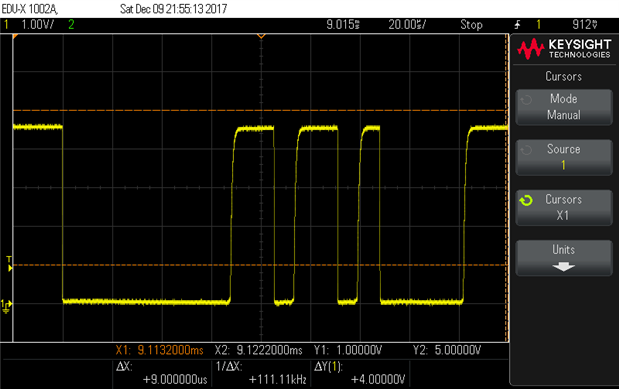
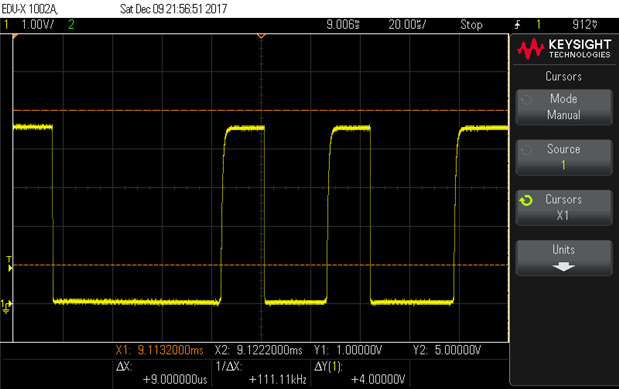
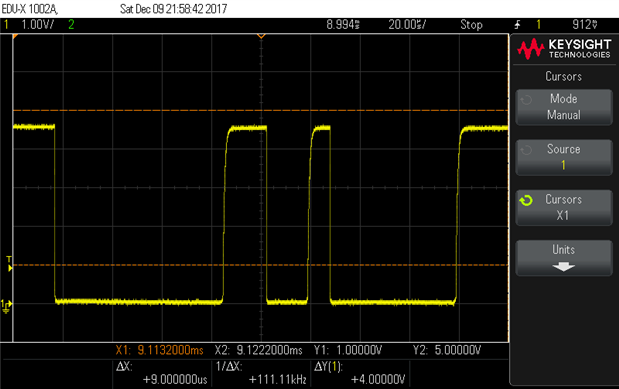
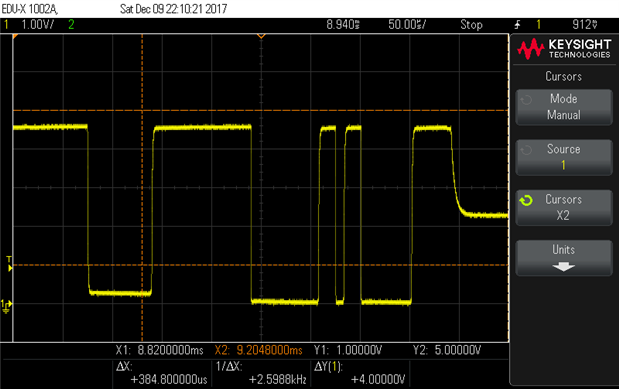
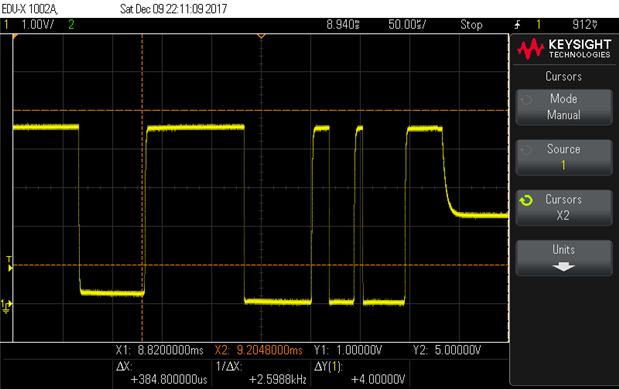
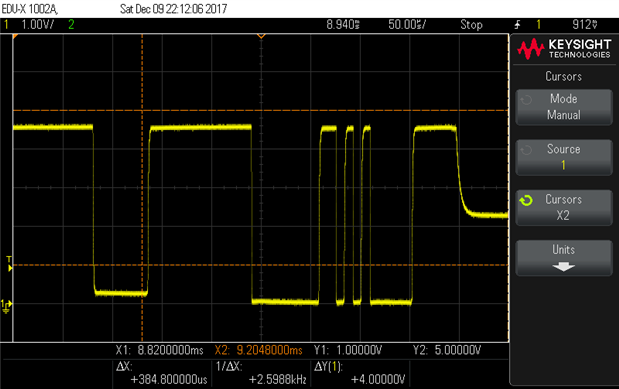
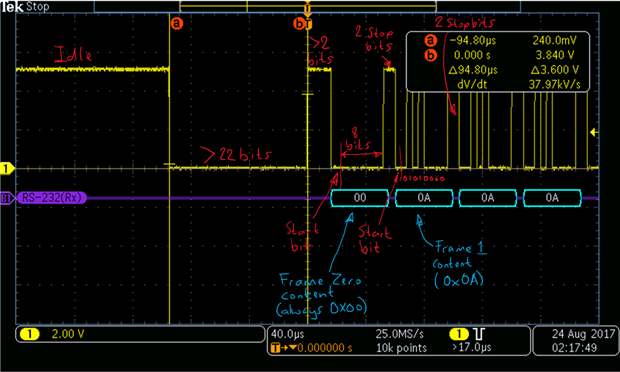
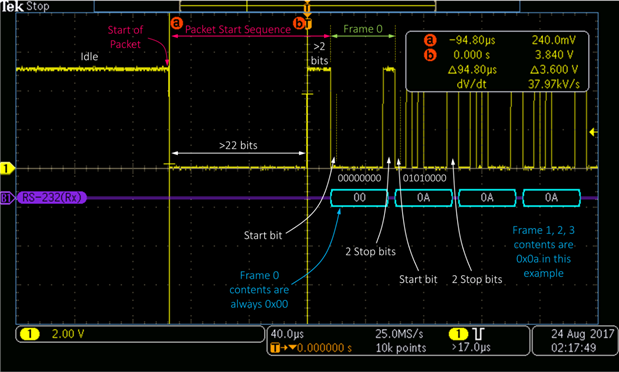
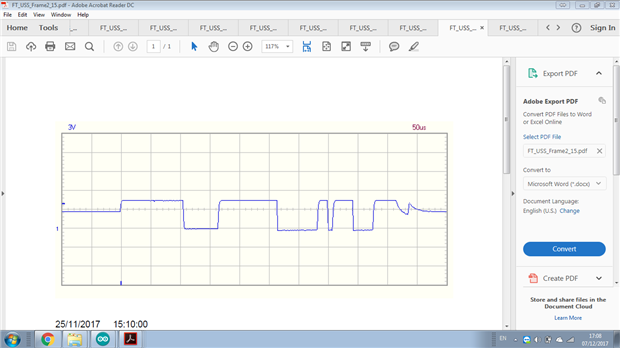
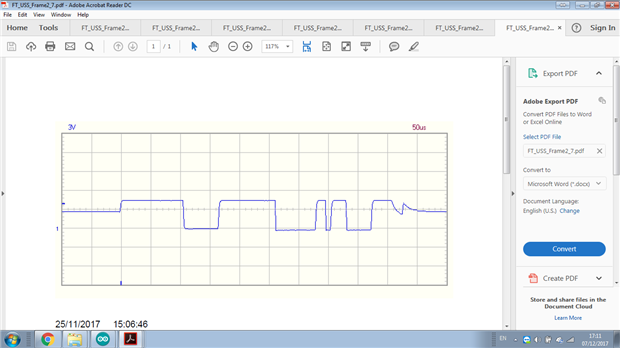
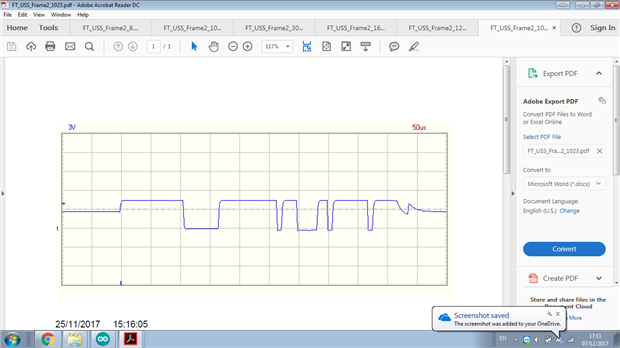
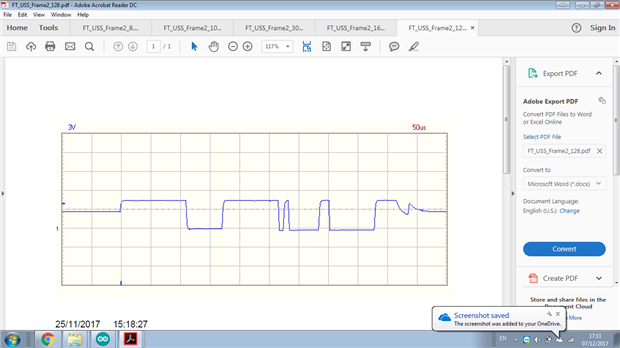
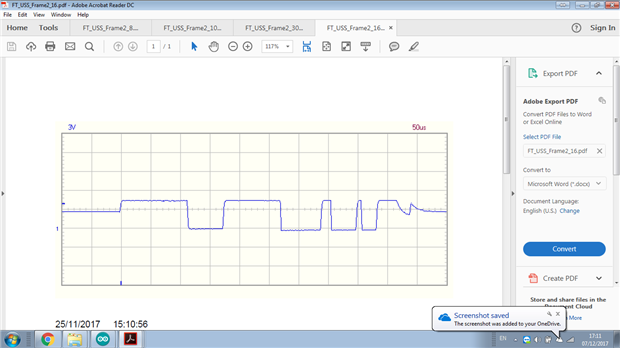
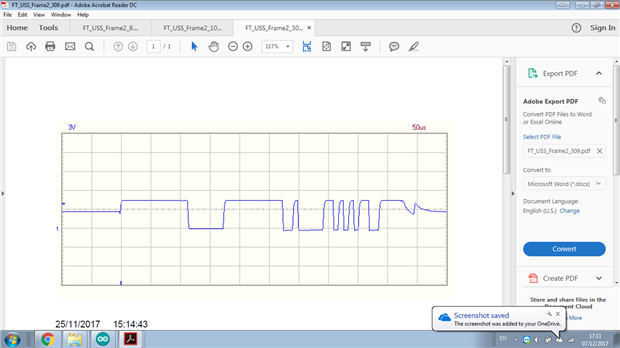
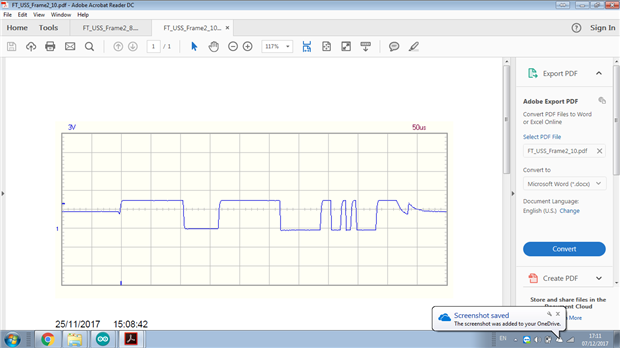
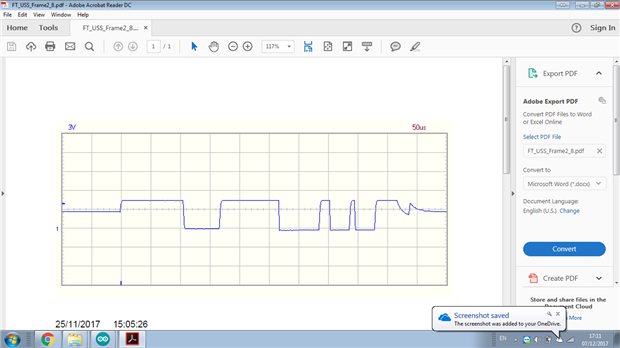
This is the code I have so far and what I got from the oscilloscope

imageimageimageimageimageimageimageimage


void setup() {
  // put your setup code here, to run once:
  Serial.begin(9600);
  Serial1.begin(115200, SERIAL_8N1);
  //Serial1.begin(2400);
  pinMode(2,OUTPUT);
}


char data1 = 'a';
char data2 = 'a';


void loop() {
  // put your main code here, to run repeatedly:
  //analogWrite(2,153);
  //delay(1);
  Serial.println("Data: ");
  /*
  for(int i = 0; i < 1; i++){
    digitalWrite(2,HIGH);
    delayMicroseconds(100);
    digitalWrite(2,LOW);
    delayMicroseconds(50);
  }
  */
  
  digitalWrite(2,HIGH);
  delayMicroseconds(125);
  digitalWrite(2,LOW);
  delayMicroseconds(78);
  
  //digitalWrite(2,HIGH);
  //delayMicroseconds(90);
  //digitalWrite(2,LOW);
  
  //Serial1.print('a');
  data1 = Serial1.read();
  data2 = Serial1.read();
  Serial.println(data1,DEC);
  Serial.println(data2,DEC);
  delay(100);
}

  • Sign in to reply
  • Cancel

Top Replies

  • shabaz
    shabaz over 7 years ago in reply to beacon_dave +3 suggested
    I've tried manually writing on traces (using digital pen): But in the end it seemed a bit ugly (my handwriting isn't great!) so I just used lines/text as usual: I suppose what could be done is pull the…
  • shabaz
    shabaz over 7 years ago +2
    Hi Brandon, Please could you use the editor tools to share the oscilloscope image (with the Google drive link we have to share information before we can access it, which I at least am not comfortable with…
  • beacon_dave
    beacon_dave over 7 years ago +2
    It is a shame that the publishing date for this new book has been put back until March 2018 https://www.amazon.co.uk/dp/3864904269/_encoding=UTF8?coliid=I12JZFYLSO5E4A&colid=3C0DWEIAWWTCA&psc=0 as it would…
Parents
  • shabaz
    0 shabaz over 7 years ago

    Hi Brandon,


    Please could you use the editor tools to share the oscilloscope image (with the Google drive link we have to share information before we can access it, which I at least am not comfortable with and others may or may not feel the same).


    The question I had was, how are you handling the same-wire for transmitting the low pulse, and the received data?


    One easy method could be to use a transistor (as open drain or open collector) to pull the line low, although software-only methods are possible too.

    • Cancel
    • Vote Up +2 Vote Down
    • Sign in to reply
    • Verify Answer
    • Cancel
  • brv64
    0 brv64 over 7 years ago in reply to shabaz

    It's ok, I understand.

    I added the images on the post.

    image

    I got those images by connecting the probe directly into a TXT controller and the sensor.

    If you need more images or information, please let me know

    image

    • Cancel
    • Vote Up 0 Vote Down
    • Sign in to reply
    • Verify Answer
    • Reject Answer
    • Cancel
  • shabaz
    0 shabaz over 7 years ago in reply to brv64

    Hi Brandon,


    I think you're not capturing the beginning part (perhaps your trigger condition needs changing, or different timebase setting), because you should see a 0.2msec delay from when you pull the line low. I can't see a 200msec delay on the traces.

    However, more concerning, is that there are multiple voltage levels in the trace, when there should only be two levels, low and high. It could be a situation where the microcontroller is functioning with (say) 3.3V logic, and the sensor is working at 5V logic levels for example. Anyway, that needs resolving, before something gets damaged. You can use logic level converters to help here.

    • Cancel
    • Vote Up +1 Vote Down
    • Sign in to reply
    • Verify Answer
    • Reject Answer
    • Cancel
  • beacon_dave
    0 beacon_dave over 7 years ago in reply to shabaz

    Hi Shabaz - here is what I see on the scope with a FT Robotics TXT controller and the FT ultrasonic sensor.


    It doesn't appear to quite match the documentation...


    As for the levels, the ultrasonic sensor originally was supplied with construction kits for the earlier 'TX' controllers, which were later replaced with the 'TXT' controllers. There is a blog about inside the TX controller here:

    Hacking the Fischertechnik TX Controller - Stefan Brunner


    image


    image


    image


    image


    image


    image


    image


    image


    image


    image


    image


    image


    image


    image

    • Cancel
    • Vote Up +2 Vote Down
    • Sign in to reply
    • Verify Answer
    • Reject Answer
    • Cancel
  • shabaz
    0 shabaz over 7 years ago in reply to beacon_dave

    Hi Dave,


    Great captures! I just had a look at the URL you mentioned, the controllers look really sophisticated!

    • Cancel
    • Vote Up 0 Vote Down
    • Sign in to reply
    • Verify Answer
    • Cancel
Reply
  • shabaz
    0 shabaz over 7 years ago in reply to beacon_dave

    Hi Dave,


    Great captures! I just had a look at the URL you mentioned, the controllers look really sophisticated!

    • Cancel
    • Vote Up 0 Vote Down
    • Sign in to reply
    • Verify Answer
    • Cancel
Children
  • beacon_dave
    0 beacon_dave over 7 years ago in reply to shabaz

    I'm starting to wonder if my captures are inverted...


    Doesn't really help with the signal being on a black wire with a red connector, and the ground on red/green wire with a green connector... At least the power is on a red wire with a red connector.

    • Cancel
    • Vote Up +2 Vote Down
    • Sign in to reply
    • Verify Answer
    • Reject Answer
    • Cancel
  • beacon_dave
    0 beacon_dave over 7 years ago in reply to shabaz

    The specification for the newer TXT controller can be found at:

    https://www.fischertechnik.de/en/products/playing/robotics/522429-robotics-txt-controller

    Similar form factor but it is based around a dual processor ARM Cortex A8 (32bit/600mHz) + Cortex M3

    • Cancel
    • Vote Up +1 Vote Down
    • Sign in to reply
    • Verify Answer
    • Reject Answer
    • Cancel
  • beacon_dave
    0 beacon_dave over 7 years ago in reply to beacon_dave

    I had another look at this and it is starting to make sense now. The timings appear to be a bit out compared to the documentation though.


    This screenshot shows two 'host queries'. The first query doesn't get a response from the sensor (not mandatory) but presumably causes an ultrasonic 'TX Burst' at the sensor. The second around 10ms later, with the 'RX Response' data supplied in two bytes, high first, then the low. 


    image


    This screenshot shows the second 'Host Query' in more detail. The low pulse from the controller is around 44us rather than the documented 78us. The '2-Byte answer' is a bit quicker than the documented 0.2ms - 1ms. The high byte shows a value of 0x80 with only bit D7 set indicating it is the 'first byte'. The low byte shows a value of 0x09 with only bits D0 and D3 set. This distance value corresponds with the value displayed in the control software.

    image

    • Cancel
    • Vote Up +1 Vote Down
    • Sign in to reply
    • Verify Answer
    • Reject Answer
    • Cancel
  • beacon_dave
    0 beacon_dave over 7 years ago in reply to beacon_dave

    It's been a slow day so just posting a few more oscilloscope screenshots I grabbed whilst looking at this sensor set-up yesterday evening.


    The high byte can be seen on the left side which remains at value 0x80 for all these captures. Top bit is set which indicates that it is the 'first byte'.


    This one shows a value of '10' being received. Bits D1 and D3 set in the low byte. Cursors on bit D3 show a bit timing value of around 9us which appears consistent with 115kbaud.

    image


    I should have turned the cursors off at this stage for clarity (or set up my triggering correctly rather than being lazy and relying on digital storage image ) but I wasn't intending on posting them here until now.


    Value of '11' being received. Bits D0, D1 & D3 set in the low byte.

    image


    Value of '12' being received. bits D2 & D3 set in the low byte.

    image


    Value of '2' being received. Bit D1 set in the low byte.

    image


    For some reason 2 was the smallest distance range I could make the sensor detect with my test setup. Should go down to 0 (distance <4cm)


    I was able to get a max value of 1023 (distance >400cm) however. With hindsight I should perhaps of captured this end to demonstrate bits D8 and D9 being set in the high byte.


    Timebase changed from 20us/div to 50us/div for the last three screenshots to include the 'host query' low pulse in the capture.


    Value of '3' being received. Bits D0 & D1 set in the low byte.

    image


    Value of '4' being received. Bit D2 set in the low byte.

    image


    Value of '5' being received. Bits D0 & D2 set in the low byte.

    image


    Starting to wonder if there is a good tool for quickly annotating oscilloscope captures. Would be nice to be able to quickly draw a grid to overlay the bit positions and have it scale to fit between the desired start and end points allowing for highlighting of start and stop bits.

    • Cancel
    • Vote Up +1 Vote Down
    • Sign in to reply
    • Verify Answer
    • Reject Answer
    • Cancel
  • mcb1
    0 mcb1 over 7 years ago in reply to beacon_dave

    Would be nice to be able to quickly draw a grid to overlay the bit positions and have it scale to fit between the desired start and end points allowing for highlighting of start and stop bits.

    Almost seems to be a logic analyser ...

    • Cancel
    • Vote Up +2 Vote Down
    • Sign in to reply
    • Verify Answer
    • Cancel
  • beacon_dave
    0 beacon_dave over 7 years ago in reply to mcb1

    Yes, but I was thinking more along the lines of a general graphics app that would allow a tutor to quickly overlay and scale an annotation graphic on top of any scope capture image to help illustrate what one is looking at.


    I was thinking along the lines of a Visio smart shape, however Visio is perhaps not the best tool for working with bitmap graphics unless you want to include them as part of a larger document.

    • Cancel
    • Vote Up +2 Vote Down
    • Sign in to reply
    • Verify Answer
    • Cancel
  • shabaz
    0 shabaz over 7 years ago in reply to beacon_dave

    I've tried manually writing on traces (using digital pen):

    image

    But in the end it seemed a bit ugly (my handwriting isn't great!) so I just used lines/text as usual:

    image

    I suppose what could be done is pull the trace content as a file (most oscilloscopes will allow that) and then use filtering and line-fitting techniques to automatically clean it up. It might actually not be that hard. Could be an interesting project : )

    As a next level it would be very neat if it could detect popular shapes (like sine waves, charge/discharge curves etc) and automatically fit a line (especially if it could be manually tidied up later too, if the user observed that an important part of the trace was accidentally filtered out by the line-fitting algorithm).

    • Cancel
    • Vote Up +3 Vote Down
    • Sign in to reply
    • Verify Answer
    • Reject Answer
    • Cancel
  • beacon_dave
    0 beacon_dave over 7 years ago in reply to shabaz

    Hi Shabaz - those annotations look great.


    I've never quite mastered the digital pen - I tend to need an e-slate tablet which allows you to still write on paper but capture as e-ink, then overlay the two.


    I have been meaning to look at pulling the trace out as a file as I find one downside to the standard capture snapshot option is that you often don't end up with a wide enough view of the signal at a sufficient resolution. Would be nice to have an option to create a 'widescreen' screenshot using the complete sample data as opposed to just the window you currently have displayed on the scope. Some higher end scopes may already have this as an option though.

    • Cancel
    • Vote Up +2 Vote Down
    • Sign in to reply
    • Verify Answer
    • Cancel
element14 Community

element14 is the first online community specifically for engineers. Connect with your peers and get expert answers to your questions.

  • Members
  • Learn
  • Technologies
  • Challenges & Projects
  • Products
  • Store
  • About Us
  • Feedback & Support
  • FAQs
  • Terms of Use
  • Privacy Policy
  • Legal and Copyright Notices
  • Sitemap
  • Cookies

An Avnet Company © 2025 Premier Farnell Limited. All Rights Reserved.

Premier Farnell Ltd, registered in England and Wales (no 00876412), registered office: Farnell House, Forge Lane, Leeds LS12 2NE.

ICP 备案号 10220084.

Follow element14

  • X
  • Facebook
  • linkedin
  • YouTube