element14 Community
element14 Community
    Register Log In
  • Site
  • Search
  • Log In Register
  • Community Hub
    Community Hub
    • What's New on element14
    • Feedback and Support
    • Benefits of Membership
    • Personal Blogs
    • Members Area
    • Achievement Levels
  • Learn
    Learn
    • Ask an Expert
    • eBooks
    • element14 presents
    • Learning Center
    • Tech Spotlight
    • STEM Academy
    • Webinars, Training and Events
    • Learning Groups
  • Technologies
    Technologies
    • 3D Printing
    • FPGA
    • Industrial Automation
    • Internet of Things
    • Power & Energy
    • Sensors
    • Technology Groups
  • Challenges & Projects
    Challenges & Projects
    • Design Challenges
    • element14 presents Projects
    • Project14
    • Arduino Projects
    • Raspberry Pi Projects
    • Project Groups
  • Products
    Products
    • Arduino
    • Avnet Boards Community
    • Dev Tools
    • Manufacturers
    • Multicomp Pro
    • Product Groups
    • Raspberry Pi
    • RoadTests & Reviews
  • Store
    Store
    • Visit Your Store
    • Choose another store...
      • Europe
      •  Austria (German)
      •  Belgium (Dutch, French)
      •  Bulgaria (Bulgarian)
      •  Czech Republic (Czech)
      •  Denmark (Danish)
      •  Estonia (Estonian)
      •  Finland (Finnish)
      •  France (French)
      •  Germany (German)
      •  Hungary (Hungarian)
      •  Ireland
      •  Israel
      •  Italy (Italian)
      •  Latvia (Latvian)
      •  
      •  Lithuania (Lithuanian)
      •  Netherlands (Dutch)
      •  Norway (Norwegian)
      •  Poland (Polish)
      •  Portugal (Portuguese)
      •  Romania (Romanian)
      •  Russia (Russian)
      •  Slovakia (Slovak)
      •  Slovenia (Slovenian)
      •  Spain (Spanish)
      •  Sweden (Swedish)
      •  Switzerland(German, French)
      •  Turkey (Turkish)
      •  United Kingdom
      • Asia Pacific
      •  Australia
      •  China
      •  Hong Kong
      •  India
      •  Korea (Korean)
      •  Malaysia
      •  New Zealand
      •  Philippines
      •  Singapore
      •  Taiwan
      •  Thailand (Thai)
      • Americas
      •  Brazil (Portuguese)
      •  Canada
      •  Mexico (Spanish)
      •  United States
      Can't find the country/region you're looking for? Visit our export site or find a local distributor.
  • Translate
  • Profile
  • Settings
Single-Board Computers
  • Products
  • Dev Tools
  • Single-Board Computers
  • More
  • Cancel
Single-Board Computers
Forum Linux performance and analysis tools
  • Blog
  • Forum
  • Documents
  • Files
  • Members
  • Mentions
  • Sub-Groups
  • Tags
  • More
  • Cancel
  • New
Join Single-Board Computers to participate - click to join for free!
Actions
  • Share
  • More
  • Cancel
Forum Thread Details
  • Replies 5 replies
  • Subscribers 56 subscribers
  • Views 481 views
  • Users 0 members are here
  • sbc
  • single_board_computer
  • linux
Related

Linux performance and analysis tools

fustini
fustini over 11 years ago

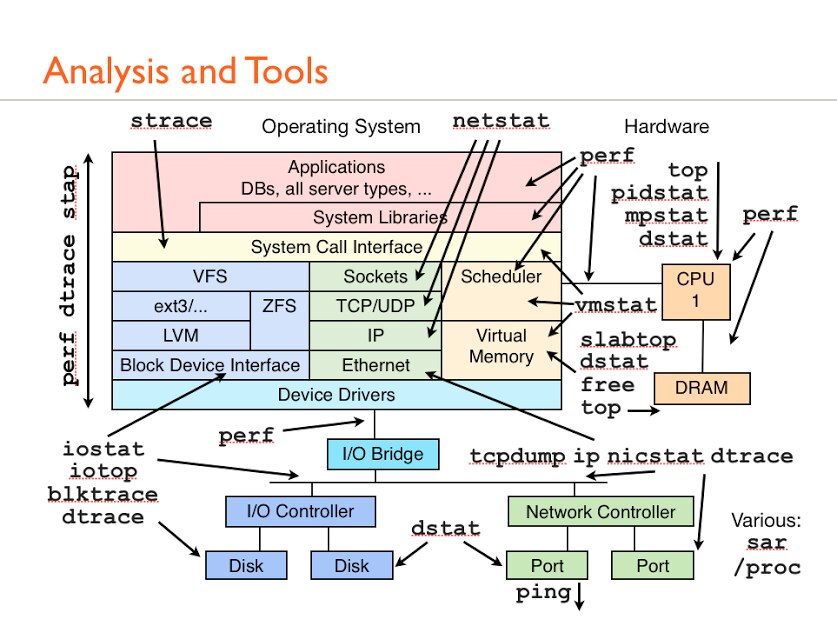
Handy graphic I saw on Google+ and thought might be interesting to those running Linux on SBCs:


Linux performance and analysis tools

https://plus.google.com/+AntonyPeel/posts/2vAzzGPVNbK

image


Anything that is missing?  or anything that is wrong?


Cheers,

Drew

  • Sign in to reply
  • Cancel

Top Replies

  • shabaz
    shabaz over 11 years ago +1
    Hi Drew, I've not used all these, just some, but it looks about right. I've never seen it in a diagram form, but maybe that will help people. Although the above is perhaps intended for Linux perf, the…
  • Former Member
    Former Member over 11 years ago +1
    perf seems to have become the 'swiss army knife' for analysing all sorts of stuff in linux. The one I'd probably question is netstat. The linux networking stack is actually very much more capable than…
  • shabaz
    shabaz over 11 years ago in reply to fustini +1
    Hi Drew! Yes, it is really great and super-simple to use. I have some personal notes on it, pasted below. To display packets in real time, the command (as root user) is (you may have a different path to…
  • shabaz
    shabaz over 11 years ago

    Hi Drew,


    I've not used all these, just some, but it looks about right. I've never seen it in a diagram form, but maybe that will help people.


    Although the above is perhaps intended for Linux perf, the commands are still useful for user application debugging, when those apps for example eventually call Linux library functions. But generally for app debugging there are other tools too of course, gdb being a prominent one of course. And for app perf, there are tools like google perftools.

    Also some other general useful tools on my list would be nm, tshark (prefer it to just using tcpdump), file, ldd.

    • Cancel
    • Vote Up +1 Vote Down
    • Sign in to reply
    • Cancel
  • Former Member
    Former Member over 11 years ago

    perf seems to have become the 'swiss army knife' for analysing all sorts of stuff in linux.


    The one I'd probably question is netstat. The linux networking stack is actually very much more capable than tools like netstat can describe. You'd want to use things like ctstat, rtstat, ifstat, lnstat, nstat, rtacct, ss from the iproute2 package to get a better view of what's going on.


    Similarly, it's missing things like mtr, traceroute, tracepath, tcptraceroute on the network side and I'm sure there are many others.


    Possibly not directly applicable to SBC's, but there's things like powertop and tools/x86/turbostat in the kernel source that any Arm equivalents of would be interesting to use to analyse what pointless things the system is wasting power on.


    The list will probably get huge - depends on exactly what things you want to examine..

    • Cancel
    • Vote Up +1 Vote Down
    • Sign in to reply
    • Cancel
  • fustini
    fustini over 11 years ago in reply to shabaz

    thanks for the tip on tshark!  I use Ethereal/Wireshark GUI but didn't realize there was a terminal program other than tcpdump

    • Cancel
    • Vote Up 0 Vote Down
    • Sign in to reply
    • Cancel
  • shabaz
    shabaz over 11 years ago in reply to fustini

    Hi Drew!

    Yes, it is really great and super-simple to use. I have some personal notes on it, pasted below.


    To display packets in real time, the command (as root user) is (you may have a different path to it):

    /usr/sbin/tshark -i eth0

    Output:

    Running as user "root" and group "root". This could be dangerous.
    Capturing on eth0
    0.000000 Oracle_2b:14:b3 -> Broadcast    ARP Who has 10.10.71.1?  Tell 10.10.71.12
    0.459221 Oracle_16:23:b6 -> Broadcast    ARP Who has 10.10.71.65?  Tell 10.10.71.90
    0.682997     10.0.0.0 -> 224.0.0.1    IGMP V3 Membership Query, general
    0.708566 10.10.67.233 -> 10.10.65.49 SSH Encrypted response packet len=132
    0.708680 10.10.67.233 -> 10.10.65.49 SSH Encrypted response packet len=132
    0.708787 10.10.67.233 -> 10.10.65.49 SSH Encrypted response packet len=116


    A ‘display filter’ is useful:

    /usr/sbin/tshark -i eth0 -R "ip.addr==10.10.66.57"


    Another example is:

    /usr/sbin/tshark -i eth0 -R "udp.port==5000"


    This will capture everything:

    /usr/sbin/tshark -i eth0 -w test.cap


    To capture and display in real time (most useful), the ‘-S’ switch is used:

    /usr/sbin/tshark -i eth0 -w test.cap –S -R "ip.addr==10.10.66.57”


    Note that the interface ‘eth0’ can be replaced with ‘any’, which will allow traffic across ports on the same machine to be captured. This is very useful to capture traffic between components running on the same Linux platform.


    To capture only certain packets, a ‘capture filter’ can be specified. However, please note that the capture filter syntax is unfortunately different from display filter syntax. This example also shows how to write to a file.

    /usr/sbin/tshark -i eth0 -f "port 5000" –w test.cap


    To view the contents of the captured file, either Wireshark can be used, or a display filter can again be used with tshark:

    /usr/sbin/tshark -r test.cap -R "ip.addr==10.10.66.57"

    Output:

    Running as user "root" and group "root". This could be dangerous.
    32 5.681169  10.10.66.57 -> 10.10.67.233 SIP Request: REGISTER sip:abc.test
    39 5.684898 10.10.67.233 -> 10.10.66.57 SIP Status: 403 Forbidden - User Unknown    (0 bindings)

    • Cancel
    • Vote Up +1 Vote Down
    • Sign in to reply
    • Cancel
  • fustini
    fustini over 11 years ago in reply to shabaz

    Thanks!

    • Cancel
    • Vote Up 0 Vote Down
    • Sign in to reply
    • Cancel
element14 Community

element14 is the first online community specifically for engineers. Connect with your peers and get expert answers to your questions.

  • Members
  • Learn
  • Technologies
  • Challenges & Projects
  • Products
  • Store
  • About Us
  • Feedback & Support
  • FAQs
  • Terms of Use
  • Privacy Policy
  • Legal and Copyright Notices
  • Sitemap
  • Cookies

An Avnet Company © 2025 Premier Farnell Limited. All Rights Reserved.

Premier Farnell Ltd, registered in England and Wales (no 00876412), registered office: Farnell House, Forge Lane, Leeds LS12 2NE.

ICP 备案号 10220084.

Follow element14

  • X
  • Facebook
  • linkedin
  • YouTube