element14 Community
element14 Community
    Register Log In
  • Site
  • Search
  • Log In Register
  • Community Hub
    Community Hub
    • What's New on element14
    • Feedback and Support
    • Benefits of Membership
    • Personal Blogs
    • Members Area
    • Achievement Levels
  • Learn
    Learn
    • Ask an Expert
    • eBooks
    • element14 presents
    • Learning Center
    • Tech Spotlight
    • STEM Academy
    • Webinars, Training and Events
    • Learning Groups
  • Technologies
    Technologies
    • 3D Printing
    • FPGA
    • Industrial Automation
    • Internet of Things
    • Power & Energy
    • Sensors
    • Technology Groups
  • Challenges & Projects
    Challenges & Projects
    • Design Challenges
    • element14 presents Projects
    • Project14
    • Arduino Projects
    • Raspberry Pi Projects
    • Project Groups
  • Products
    Products
    • Arduino
    • Avnet & Tria Boards Community
    • Dev Tools
    • Manufacturers
    • Multicomp Pro
    • Product Groups
    • Raspberry Pi
    • RoadTests & Reviews
  • About Us
  • Store
    Store
    • Visit Your Store
    • Choose another store...
      • Europe
      •  Austria (German)
      •  Belgium (Dutch, French)
      •  Bulgaria (Bulgarian)
      •  Czech Republic (Czech)
      •  Denmark (Danish)
      •  Estonia (Estonian)
      •  Finland (Finnish)
      •  France (French)
      •  Germany (German)
      •  Hungary (Hungarian)
      •  Ireland
      •  Israel
      •  Italy (Italian)
      •  Latvia (Latvian)
      •  
      •  Lithuania (Lithuanian)
      •  Netherlands (Dutch)
      •  Norway (Norwegian)
      •  Poland (Polish)
      •  Portugal (Portuguese)
      •  Romania (Romanian)
      •  Russia (Russian)
      •  Slovakia (Slovak)
      •  Slovenia (Slovenian)
      •  Spain (Spanish)
      •  Sweden (Swedish)
      •  Switzerland(German, French)
      •  Turkey (Turkish)
      •  United Kingdom
      • Asia Pacific
      •  Australia
      •  China
      •  Hong Kong
      •  India
      •  Korea (Korean)
      •  Malaysia
      •  New Zealand
      •  Philippines
      •  Singapore
      •  Taiwan
      •  Thailand (Thai)
      • Americas
      •  Brazil (Portuguese)
      •  Canada
      •  Mexico (Spanish)
      •  United States
      Can't find the country/region you're looking for? Visit our export site or find a local distributor.
  • Translate
  • Profile
  • Settings
Raspberry Pi Projects
  • Products
  • Raspberry Pi
  • Raspberry Pi Projects
  • More
  • Cancel
Raspberry Pi Projects
Blog Counting Traffic for the Community - Telraam
  • Blog
  • Documents
  • Events
  • Polls
  • Members
  • Mentions
  • Sub-Groups
  • Tags
  • More
  • Cancel
  • New
Join Raspberry Pi Projects to participate - click to join for free!
  • Share
  • More
  • Cancel
Group Actions
  • Group RSS
  • More
  • Cancel
Engagement
  • Author Author: Jan Cumps
  • Date Created: 23 Mar 2022 6:11 PM Date Created
  • Views 6665 views
  • Likes 14 likes
  • Comments 10 comments
  • smart_cities
Related
Recommended

Counting Traffic for the Community - Telraam

Jan Cumps
Jan Cumps
23 Mar 2022
Counting Traffic for the Community - Telraam

There will be big infrastructure works in my part of Brussels.
The government is trying to measure the impact of deviations and road blocks on traffic.
They also try to assess if the currently being built metro line M3 has a positive impact on traffic.

The department of public works has contacted a company that's specialised in getting traffic metrics. They put a counting device in private house's windows.
They were looking for volunteers to install such a traffic counter.

I subscribed and just got a device. It's a Raspberry Pi with a low definition camera!

image

image source: extension of metro line 3, and my house marked in red

The Traffic Counter

The company and device are called telraam (abacus).
It's a play on words. In Dutch, Tel-Raam is literally Count-Window. 

I received it yesterday. Look what's inside: 

image

Inside the black box: a Pi 3 A+

image

The camera is a Pi CAM V2

image

The firmware is pre-loaded on an SD card. As a user, you don't interact with the Pi directly. The setup is typically done via browsers.
I may blog later on how the setup and provisioning works. Long story short: it was an easy 6 step process. Can be done by anyone that is able to follow instructions.
This can be a good example for parties that want to build a consumer product on a Pi, for a non-tech audience.

The Data

Filming a street is a sensitive subject. Privacy comes into play.
For that reason, the raw video data is never streamed. It doesn't go beyond the Pi.

Counting the different types of traffic, the direction, and the speed, are derived from the camera stream.
That data is then regularly exchanged with the Telraam online services.
Virtually everything happens on the Pi:

  • detect if a moving object is traffic
  • categorise it (pedestrian, bike, car, heavy)
  • determine direction
  • determine speed

That telemetry data is sent to the cloud.

Two times per day, the camera also takes a real image of the street and sends that to the server. This is done to validate that the camera is positioned correctly.
To ensure that the data does not include privacy sensitive info, these measures are in place:

  • 30 seconds of video are recorded, then all pixels are averaged to make any moving object unrecognisable
  • the resolution is reduced by using pixelisation. This takes care that people and license plates never show up.
  • these images are stored for 8 days maximum, and can only be viewed by support and the person that owns the counter (me).

The design is reviewed by the Belgian privacy commission.

The abstracted data is free for anyone that wants to use it for academical use or public-related causes. There's an API.
That data does not include my exact location (it shows the section of the street I am in), or any images.
The counter does not work during the night. That would require a much more expensive setup. 

Private Interface

As the owner of the traffic counter, I have access to an owner's dashboard. 

image

This interface is used to finetune what's covered by the camera:

  • street layout (size, lanes, ...)
  • what side of the street the camera is on
  • type of traffic
  • the low-resolution, blurred camera image to validate it still points at the desired area.
  • data insights, but they are virtually identical to what the public sees.
    The only difference is when there are more than one camera on a street section. In that case, I can see my individual camera's results.
    Other data consumers (government and the general public) will get the averaged results of all cameras on that street section.

Public Interface

The public will be able to look at a map, and see what street sections are covered by one of more counters.
They can then drill into the data and trends.
You can monitor with me.

Here's what's available for my counter. It's in use for half a day now:

image
image: the section of the street that I am monitoring

image
image: last hour's count. Heavy vehicles and speed need more time for calibration

image
image: more data: the count after half a day. You can set the time window - but mine is just active since this noon.

Speed data is also public. Not per vehicle (nothing can be traced back to individual cars), but amount divided into buckets.
My street, like most roads in Brussels, has a 30 KM/H limit.

image
image: speed buckets

The few ticks in the higher speed buckets (50+) are very likely glitches in the recognition. This was mentioned during the intro session.
The counts there are too low to represent valid data.

image

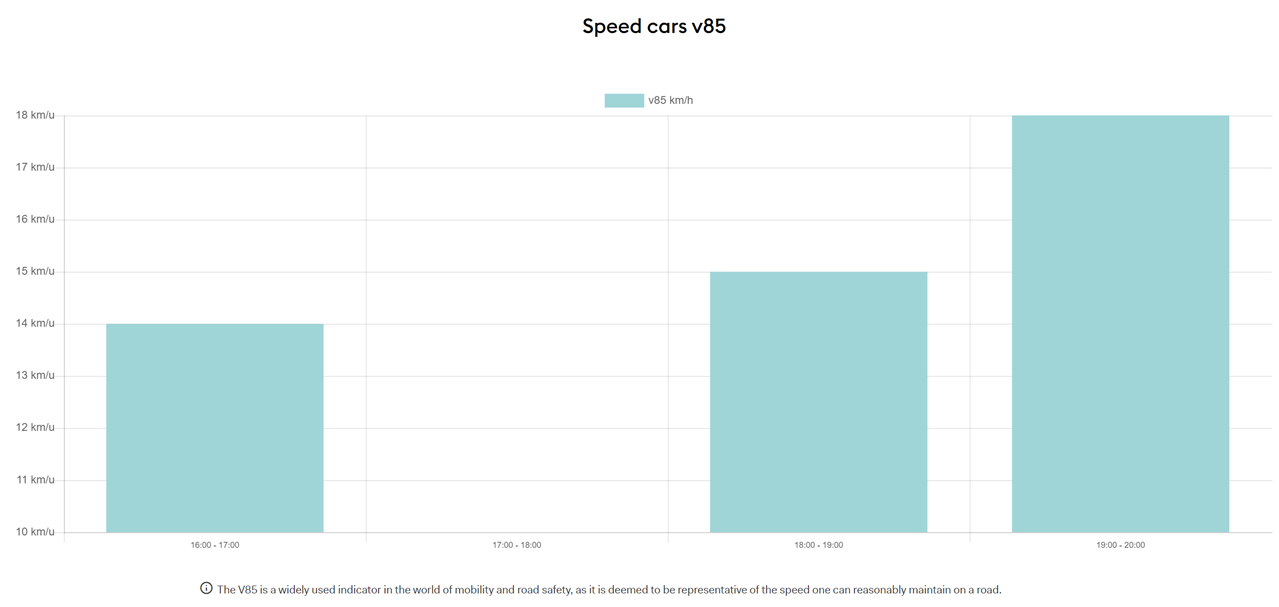
image: analysis of the expected feasible speed per hour in my street.

image
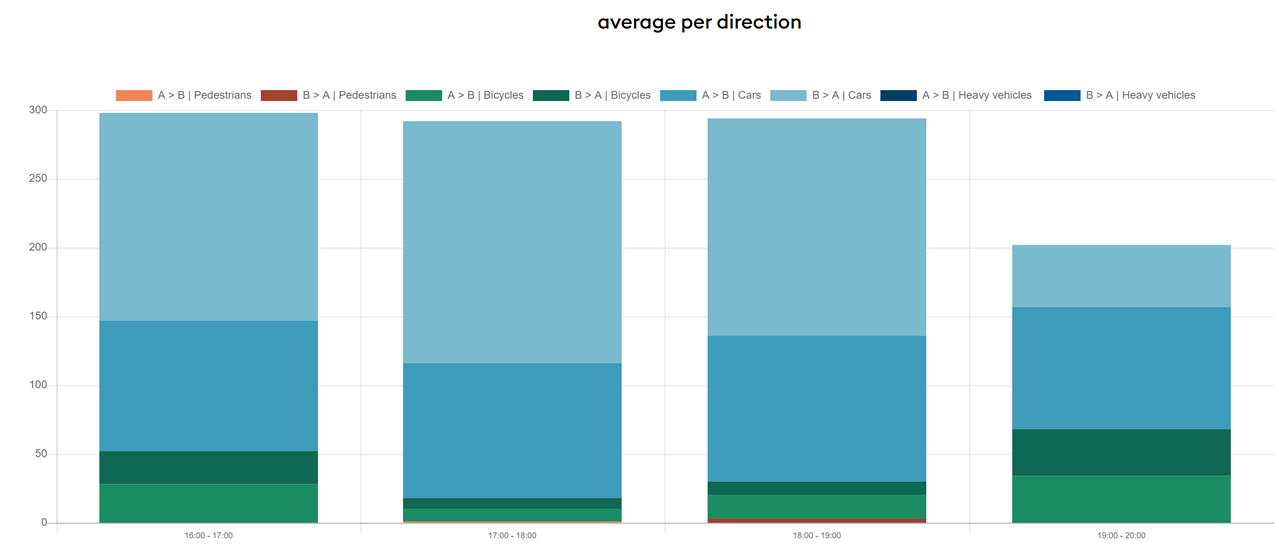
image: does the traffic move in or out of town, per hour?

Last one shows the different types of traffic, and their percentages.

image
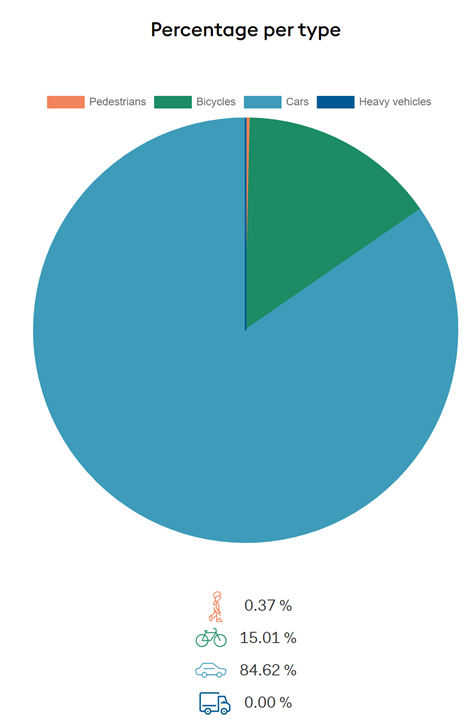
Note that there are virtually no trucks and pedestrians:

  • From my location, I can't count pedestrians because the house is too close to the street and it can't capture the sidewalks
  • Counting trucks needs approximately 3 weeks of data, so that the system can calibrate itself.
    This is camera position dependent, and can't be preconfigured with reliable outcome. That's why the first weeks are used to learn. 

Government Interface

The government has access to all data the public has, but they get additional analysis tools for the area to hire the service for.
These show how traffic's behaviour changes over time. That can be morning vs evening, winter vs summer, week vs weekend, before, during and after infrastructure works, ... 
Those are the tools they use to turn this raw individual citizen window counters into tools to make decisions.

related blog
Counting Traffic for the Community - Telraam
Counting Traffic with Telraam - stats after 2 days
Counting Traffic with Telraam - heavy vehicles
  • Sign in to reply

Top Comments

  • Jan Cumps
    Jan Cumps over 3 years ago in reply to Jan Cumps +1
    ntewinkel , I stand corrected. The software is open source : https://github.com/Telraam/Telraam-RPi I got a message from the Telraam team with this link.
  • Jan Cumps
    Jan Cumps over 3 years ago in reply to Jan Cumps

    ntewinkel, I stand corrected. The software is open source: https://github.com/Telraam/Telraam-RPi

    I got a message from the Telraam team with this link.

    • Cancel
    • Vote Up +1 Vote Down
    • Sign in to reply
    • More
    • Cancel
  • Jan Cumps
    Jan Cumps over 3 years ago in reply to Jan Cumps

    (mayors  Slight smile - autocorrect seems to keep all errors and makes funny words of the rest)

    • Cancel
    • Vote Up 0 Vote Down
    • Sign in to reply
    • More
    • Cancel
  • Jan Cumps
    Jan Cumps over 3 years ago

    I posted a follow up, the data after 2 days of counting and settling: Counting Traffic with Telraam - stats after 2 days

    • Cancel
    • Vote Up 0 Vote Down
    • Sign in to reply
    • More
    • Cancel
  • Jan Cumps
    Jan Cumps over 3 years ago in reply to BigG

    Yes, these are the same players.
    My counter is subsidised by the maires of Schaarbeek, where I live, and our neighbour Evere - both part of Brussels. Focus on impact of the big public transport construction sites that will appear there during the next 10 years.
    There's another initiative to measure traffic on the "inner circle" of the city. That's to assess the "Good Move" traffic reform plan of the city. 
    Data collected for both initiatives, and other ones, is available online.

    • Cancel
    • Vote Up 0 Vote Down
    • Sign in to reply
    • More
    • Cancel
  • BigG
    BigG over 3 years ago

    A EU funded ‘citizen science’ project called "WeCount" was launched a couple of years ago where numerous cities participated. https://www.we-count.net/

    It's good to see that it's still running.

    Your write up about setting it up and what the data output looks like is very helpful.

    Here's hoping improvements are made and that it continues to get adopted so that a better understanding of urban traffic flows can be achieved.

    • Cancel
    • Vote Up 0 Vote Down
    • Sign in to reply
    • More
    • Cancel
>
element14 Community

element14 is the first online community specifically for engineers. Connect with your peers and get expert answers to your questions.

  • Members
  • Learn
  • Technologies
  • Challenges & Projects
  • Products
  • Store
  • About Us
  • Feedback & Support
  • FAQs
  • Terms of Use
  • Privacy Policy
  • Legal and Copyright Notices
  • Sitemap
  • Cookies

An Avnet Company © 2025 Premier Farnell Limited. All Rights Reserved.

Premier Farnell Ltd, registered in England and Wales (no 00876412), registered office: Farnell House, Forge Lane, Leeds LS12 2NE.

ICP 备案号 10220084.

Follow element14

  • X
  • Facebook
  • linkedin
  • YouTube