


I recently received an ADALM2000 unit, designed and built by Analog Devices, as part of the roadtest program. I have been using this opportunity to explore all that the device offers.
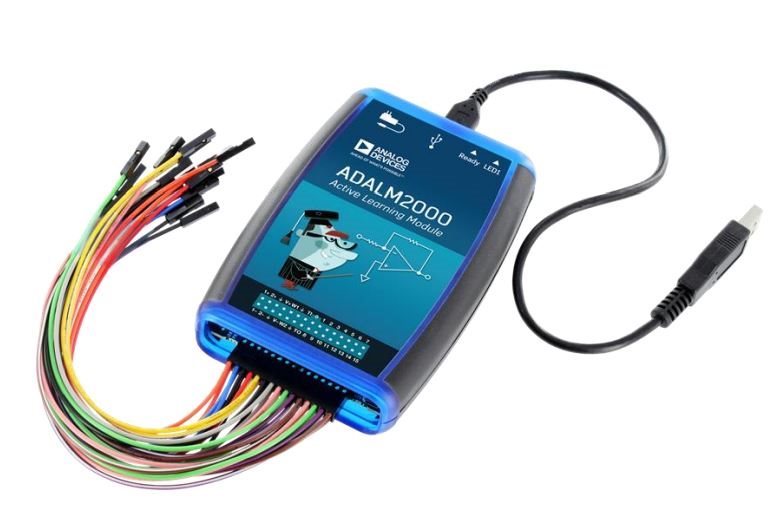
The good thing about the ADALM2000 is that it is a small instrument, yet has several instruments built inside (oscilloscope, function generator, spectrum analyzer, Network Analyzer, power supply, voltmeter, etc). This makes it ideal for exploring the world around me, electrically speaking. Being a low(er) cost instrument, it has its limitations, but generally speaking as long as you stay within a few tens of Megahertz range it works fine. For some, few tens of Megahertz is all they need 90% of the time.
One of the instruments inside the ADALM2000 is the Network Analyzer, which I find very interesting because it lets me measure the frequency response of any Device Under Test (DUT). The way it does that is, it generates a "sweep" of frequencies going from a Low Frequency to a Higher Frequency (set by user), and measures both the signal going into the DUT as well as what is coming out of the DUT. Then, the software compares the Amplitude and Phase of what goes in versus what comes out to determine the Amplitude and Phase response of the DUT across the range of frequencies requested by user.
This information can give a lot of useful insight into the behaviour of the DUT. For example:
- We can see how a Low/High/Band pass filter behaves both in terms of amplitude and phase response over a range of frequencies.
- We can see how passing a signal through a long cable attenuates the various frequencies to varying degrees.
...and so on.
In this blog post I want to share some of my experimentation with crystal oscillators. Why crystal oscillators? Because their behaviour is frequency dependent. As per my humble understanding, the way they work is that the quartz crystal inside will respond to a very specific "natural frequency" based on how it was built. So you get resonance at that very particular frequency while the response to other frequencies is less enthusiastic. As a result, you get oscillation at a very precise frequency, corresponding to the natural frequency of the crystal, which is exactly what we need as clock for various digital circuits as well as for analog/RF circuits.
Let's say we have a crystal oscillator at hand, and we don't know what frequency it will oscillate at (let's say the marking can't be read or you can't find the datasheet). Can we use our ADALM2000 to find out the oscillation frequency? Further, what other information can we gather about the behaviour of the crystal.
Test Setup
For this particular experiment I took a crystal off a scrap microcontroller board for my tests. I can read the markings, but I will pretend I can't. For now.

I used a hot air gun to desodler it. Since it is a SMD part, to make my testing easier, I soldered two short wires to the two pads at the bottom. This way I could use my IC test clips to hold on to the wires. (Btw, these clips don't come included with the ADALM2000 kit).

To find the natural frequency of oscillation, my idea was to stimulate the oscillator with a sweep of frequencies and see at what frequency it resonates (i.e, gives the largest output). This sounds like something a Network Analyzer would be perfect for. Luckily, the ADALM2000 has all the instruments needed to build one, and the software already implements the functionaity. So let's build a simple circuit as below using the ADALM2000, some IC clips for quick connections, and a resistor.


We are using the Function generator Channel 1 inside the ADALM2000 to provide the stimulus, and using the two oscilloscope channels inside the unit to measure the reference signal and the output signal. The Scopy software will help us set the stimulus settings, as well as process the result and display those in nice Amplitude and Phase graphs.
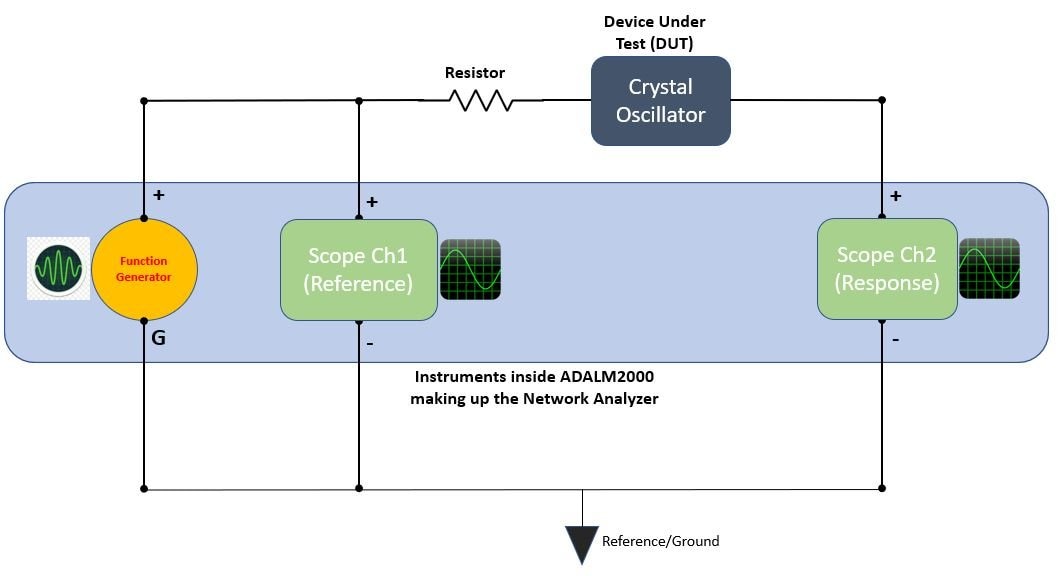
Note that the Function generators inside the ADALM2000 are single ended, while the oscilloscope channels are differential. To bring everything to the same reference levels, I have connected the negative sides of the oscilloscope channels to the device ground (which is also the ground for the function generator channels).
I started with a wide sweep starting at 1Mhz and ending at 25Mhz (maximum value allowed by ADALM2000 Network Analyzer). Knowing that the crystals have a very narrow resonance band, I increased the number of frequency sample points to 5000 to get better chances of hitting the resonance frequency. I used a stimulus voltage of 500mV peak to peak so as not to destroy the oscillator in case it operates on lower voltages. The sweep took a several minutes to complete due to the increased number of sample points.
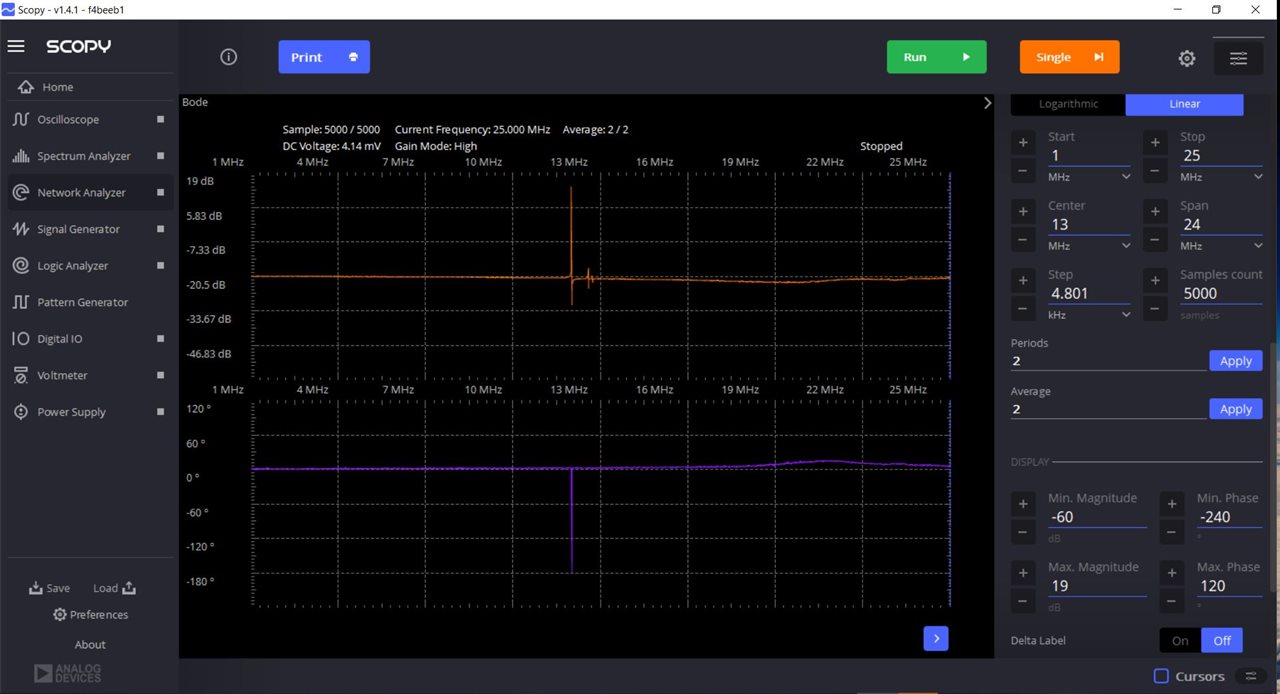
If we look at the Amplitude graph, we can immediately notice a sharp peak:

Let's zoom in further to get a clearer picture:

Putting the mouse over the peak, we can see the peak in amplitude is happening around 12Mhz. Close to that point (but not at exactly the same frequency), we can also see the phase going to 180 degrees corresponding to the point where Amplitude experiences a negative peak. We also see some smaller peaks around 12.57Mhz and 12.71Mhz.
To observe the behaviour more closely, we can now perform another sweep from 11.5Mhz to 13Mhz. This gives us a better frequency resolution of 300Hz within our frequency span of interest. Note that we can control the frequency resolution to give us even more sample points, but it will increase the sweep time further. This particular sweep took around 5 minutes to complete.

The resultant graph gives us a clearer picture. We can see the three resonance points clearly, with the first one being the strongest. Note that the amlitude in the amplitude graph is decibels.By putting the mouse over the peak points, I can see that the first peak has amplitude of ~13dB, while the second peak has an amplitude of -1.94dB. The amplitude difference between the peaks is ~15dB, which, using an online calculator, tells me the first peak is ~5.6 times bigger in volts compared to the second peak. I *think* that might explain why the crystal prefers to oscillate at the first frequency and not at the frequencies corresponding to 2nd (or 3rd) peak.
At this point I wanted to understand better the behaviour of the crystal around the primary fundamental oscillation frequency (highest peak). For this, I performed another sweep from 11.95Mhz to 12.05Mhz, a much smaller frequency range centered around the main peak. This is what I obtained:

I find this graph more interesting than my expectations. My expectation before I started this experiment, was to see a very narrow band pass filter response centered around the crysta's fundamental frequency. However, the shapes of the amplitude and phase responses graphs are not so simple!
I put marker on the peak spot, and we can see that it happens at a frequency of 11.9990 Mhz. You can guess by now that the marking on the crystal says 12.000Mhz. I have read that presence of some capacitance or inductance in parallel/series with the crystal can shift the peak frequency. It could be either that happening here, or it could be that we're at the accuracy limit of the ADALM2000. Without a calibrated second instrument, which I don't have available at home, I can't say which one it is. But I think for most intents and purposes this much accuracy is good enough.
Another very interesting thing I notice here is that the point of Peak Amplitude (resonance) corresponds to a 90 deg phase shift between output and input. Somehow I thought that there would be a 0 degree phase between the stimulus and response at point of highest resonance. Perhaps one of the more knowledgeable readers can help explain this behaviour further!
After the peak point the phase difference drops to 180 degrees, i.e., stimulus and response are opposite in phase. I think this 180 degrees phase shift is something that helps keep the oscillation from not drifting away from the peak frequency, at least on the right side of the peak frequency. The image of a steep uphill climb comes to mind, if the oscillation tries to move past 12Mhz due to the response phase starting to work against the stimulus.
If you understand crystal oscillators better, please help explain the graphs in the comments section!
Buffer previewer functionality
I want to take briefly explain how the "buffer previewer" works in the Scopy Network Analyzer. I found it a to be a very useful tool that enables seeing the actual input/reponse signals to understand what was going on at that particular point during measurement.
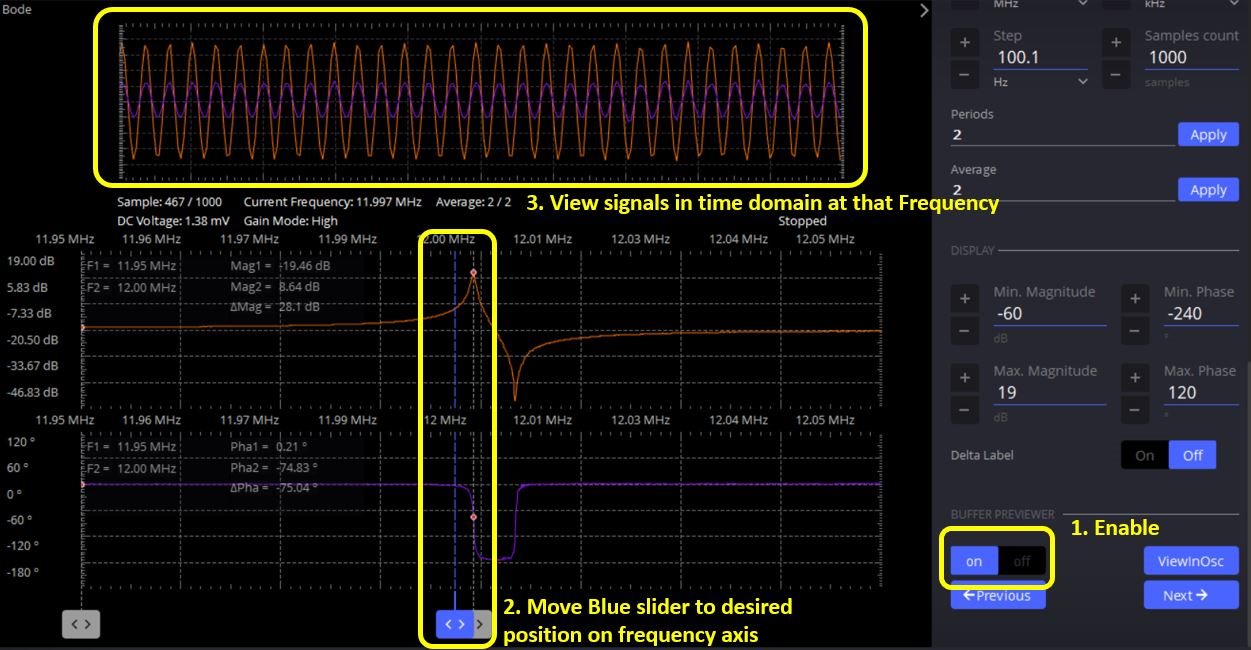
Using it is quite simple. Referring to the screenshot above, you turn it on first, then you can move the blue slider horizontally to select the point at which you want to view the signals, and the viewer on top updates in real time to show the actual signals. The orange trace is Channel 1 (reference/stimulus measurement signal), while blue is the reponse signal. Now, we can look back at the raw signals at different points in our sweep around the peak crystal frequency. In all cases, look at the blue slider to see what location on the Amplitude/Phase graph we're viewing.

Here you can see the signal before hitting the peak frequency. The response(blue) is smaller than stimulus(orange) signal. The two signals are in phase with each other.

Here you can see the signal at the peak frequency. The response(blue) signal is larger than stimulus(orange) signal. This is due to resonance. The two signals have 90 degrees phase difference with each other.

Here, we are observing a point between the maximum and minimum peaks. The response(blue) signal is smaller than stimulus(orange) signal. The two signals are 180 degrees out of phase with each other.

Finally here we are observing a point after the minimum amplitude peak. The response(blue) signal is smaller than stimulus(orange) signal. The two signals are back to being in-phase (no phase difference) with each other.
Being able to view the raw signals at the various points not only helps to debug any unexpected results, but also helps build intuition of what's going on to the raw signals.
Why the Series Resistor?
An observant reader might have noticed the resistor in my diagram, and wondered why I needed to use the resistor? Well, I learnt this by experience during this experimentation. Initially I connected things up without a resistor (directly to the two legs of crystal) and saw that the amplitude graph was showing a flat response across the sweep frequencies. This felt odd, so I used the "buffer previewer" function inside the Scopy Network Analyzer to try to make sense of what was going on. I noticed that both the reference as well as the response signals were getting bigger when resonance happened. In other words, the response was also affecting the reference signal measurement itself since there was no isolation/separation between the crystal and Signal generator. A Network Analyzer's amplitude graph shows the ration of Reponse vs Input signals, so both scaling equally doesn't help. I figured I needed to put some separation between the reference signal being generated by the Function generator and the Oscillator response signal. I fixed this by putting a resistor between the two and I immediately started getting the desired results.
Other things I tried
- Another idea I had in mind was to excite the Crystal with like "white noise" (a signal containing somewhat equal amounts of a lot of frequencies).My idea was that if I excite the crystal with a whole lot of frequencies, I should see a peak at the natural frequency of the crystal due to resonance, while the other frequencies should get attenuated. To try this, I used the Function generator to generate several types of noise (I tried different settings). I then used the Spectrum analyzer inside the Scopy to look at the response. However, I couldn't manage to get the expected result, and rather saw a lot of different peaks on the spectrum analyzer, without any clear winners. I suspect a major issue was that my "white noise" wasn't white enough, meaning it didn't contain a uniform distribution of frequencies as I had hoped. I think because of the resonance band being so narrow, the chances of hitting the band consistently enough to observe it were very low.
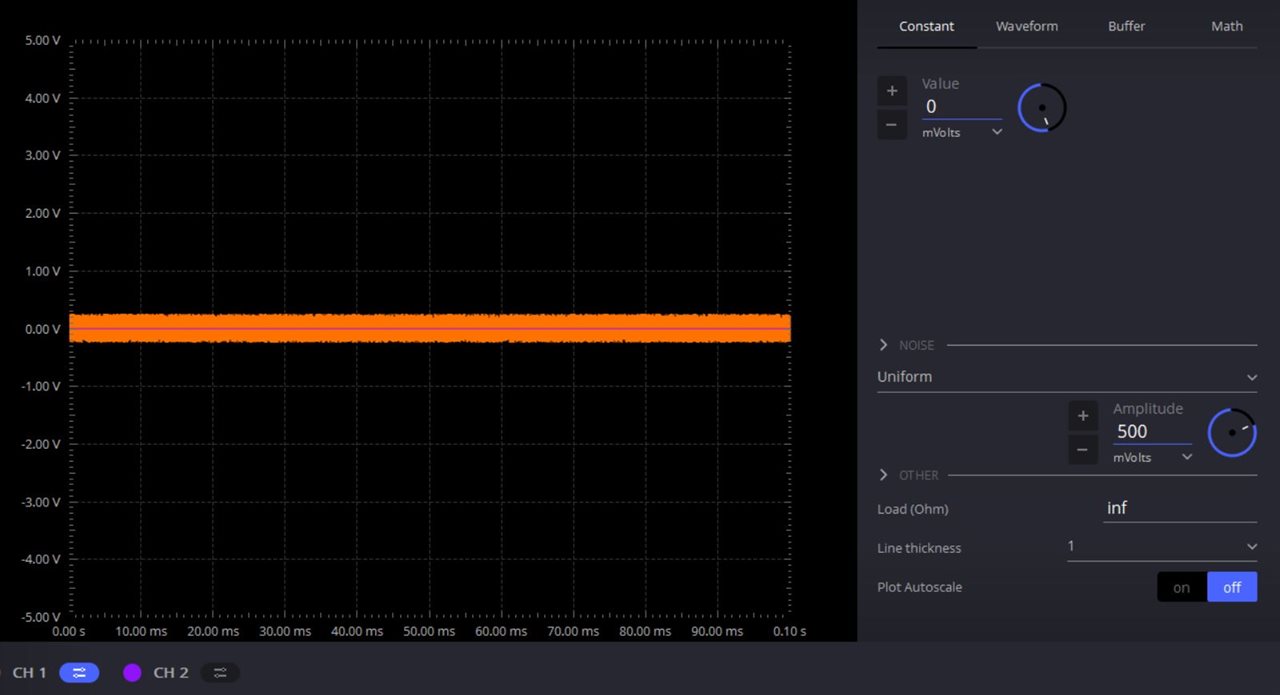
The above shows the stimulus uniform noise being generated using the Function generator (Ch1) inside the ADALM2000

The screenshot above shows the ouput of the Spectrum Analyzer. The orange trace is the stimulus "uniform noise" spectrum going to the oscillator, while the blue trace is the response spectrum. observed on the other side of the oscillator. No noticeable peak is observed at 12Mhz.
- I had also planned to repeat this experiment with another crystal I had bought for a TVP5150AM1 AV decoder circuit. However, I realized that the frequency on the crystal (27Mhz) was out of the range of the ADALM2000 (which can go up to 25Mhz in Network Analyzer mode). This was a reminder that the lower cost of instrument comes with limiits on specs.
Observations/Takeaways:
- The "buffer previewer" feature in the Scopy software is very useful to see the raw reference& response signals in time domain and understand what's going on at the very basic level if/when things are not working as you'd expect.
- Having several instruments at your disposal lets you try different ideas. In my case, I had several different ideas on how to study the oscillator response. Some worked, others didn't. But the amazing thing is that an instrument like this ADALM2000 let me try all those different ideas without having to arrange several different separate instruments, and all conveniently in a little table space the size of a shoebox!
- The lower price of the ADALM2000 comes with its limits on performance - something to be kept in mind when planning experiments.

