6.2 Diode characterization
A diode is a two-terminal device that facilitates current conduction in one direction and blocks it in the other. The I-V characterization of a diode can be challenging due to the exponential relationship between voltage and current. To accurately characterize a diode, an instrument with a high dynamic range (like an SMU) is required. In addition, it’s also important to consider the self-heating effect, as it can shift the I-V curve during the characterization of the device.
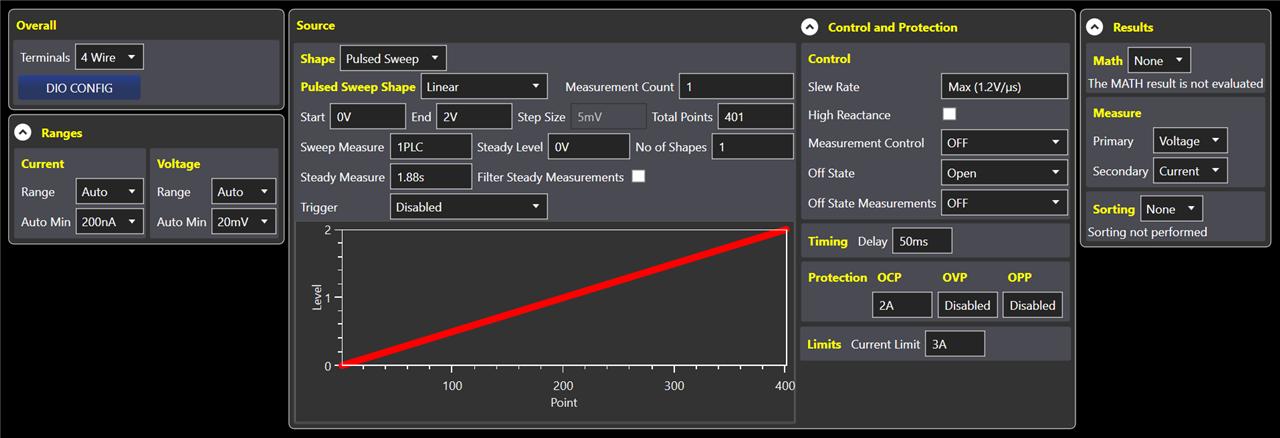
I decided to characterize a HER208 diode, which is a diode that can handle a maximum RMS current of 2 A and has a maximum DC blocking voltage of 1000 V. I set the instrument in 4-wire mode and performed a voltage sweep from 0 V to 2 V with 2 s steps with 5 mV voltage increase, measurements of duration of 1 PLC (power line cycle) and an overcurrent protection of 2 A.

I opted to use the TTi Test Bridge as it allows me to set all the necessary parameters quickly on a single screen, and later automatically retrieve the measurements to store them directly into the computer. Using the instrument’s front-panel would have been far more time-consuming and less efficient. It would have required me to navigate through multiple menus, set parameters through the instrument’s touchscreen to then perform the measurement and finally store the results into a pen drive.
6.2.1 Continuous sweep
The fastest way to perform a sweep is to perform a “continuous” sweep, but this can cause self-heating in the mW power range. How much a diode heats up depends on several factors that include ambient factors and the amount of power that the diode dissipates. By setting the step duration to 2 s, I gave the diode time to self-heat, but probably not enough to reach within 1 ºC of the converging temperature at the higher voltage steps. To set each step duration to 2 s, I used a measurement delay of 1980 ms, and measurement duration of 20 ms, which corresponds to 1 PLC at 50 Hz power line frequency.

This configuration produced the following curve:
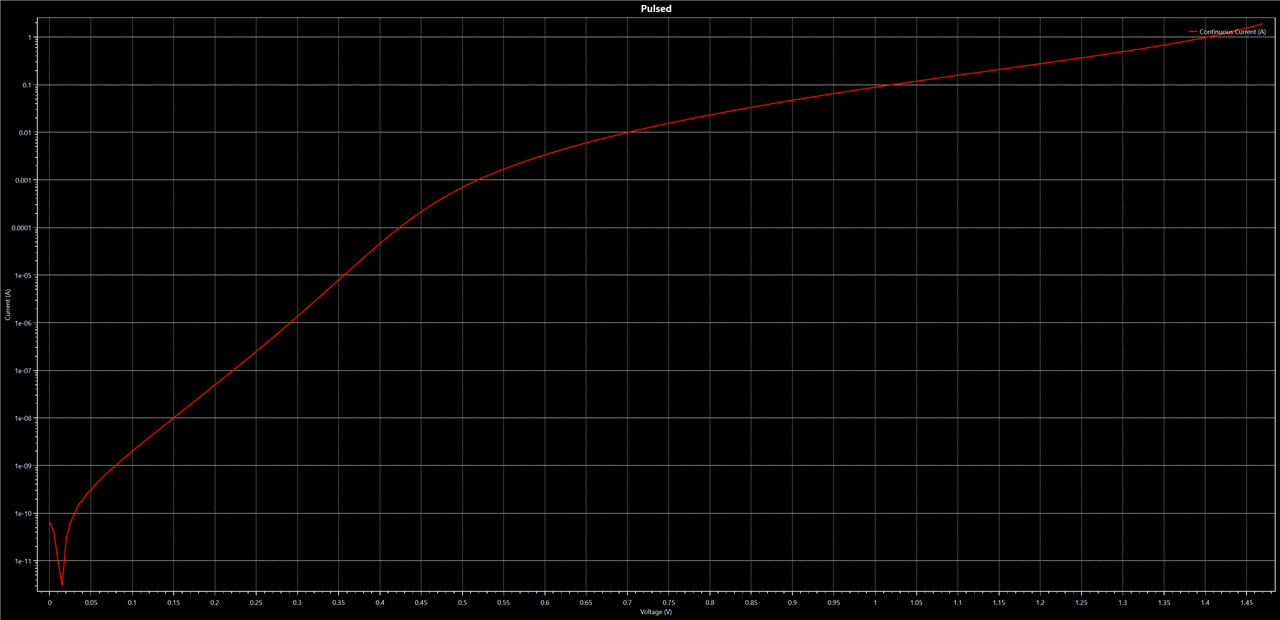
The inverted spike at approximately ~15 mV occurred when the current crossed the 0 A level. The program could have just not plotted negative value, or maybe indicate with a different color that the values are negative, but instead it plotted them as if they were positive currents. At 0 V the SMU measured around -60 pA, with the diode and without anything connected to the SMU.
6.2.2 Pulsed sweep
To reduce the effect of self-heating, the SMU provides pulsed sweeps, where the SMU switches between a “steady voltage”, which I set to 0 V, and a “sweep voltage”. I set the sweep measurement duration to 20 ms (1 PLC), the steady measurement duration to 1880 ms, and the measurement delay to 50 ms. In this way, each step is 70 ms at the sweep level, and 1930 ms at 0 V.
I then plotted the continuous and pulsed sweep curves to see how close they matched each other:
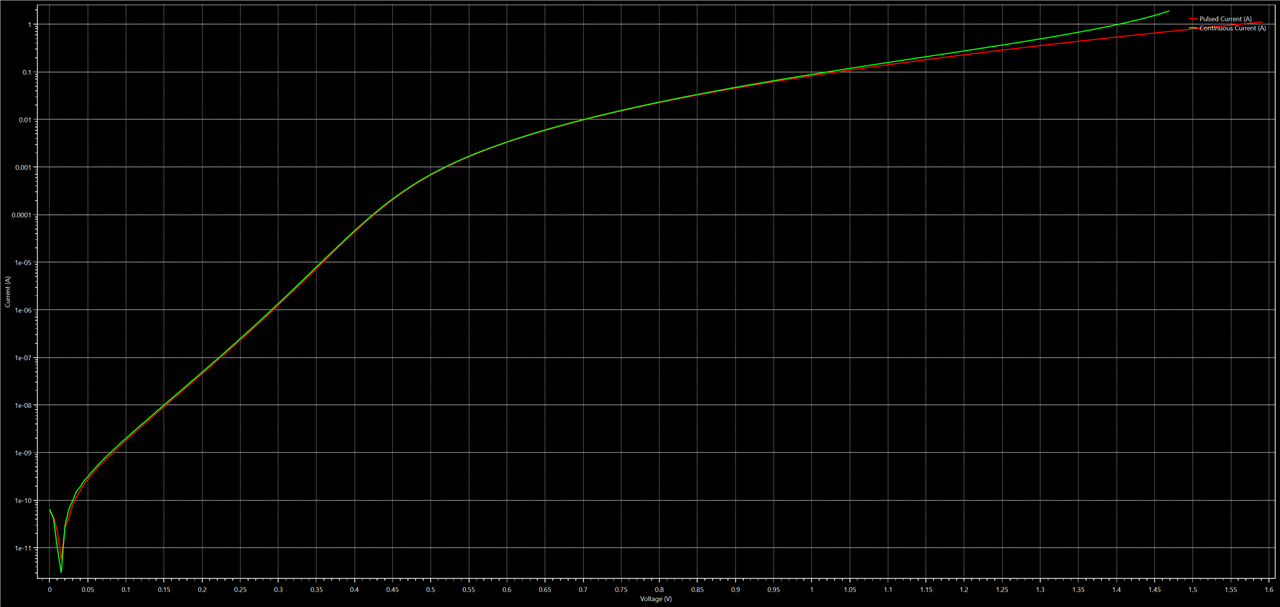
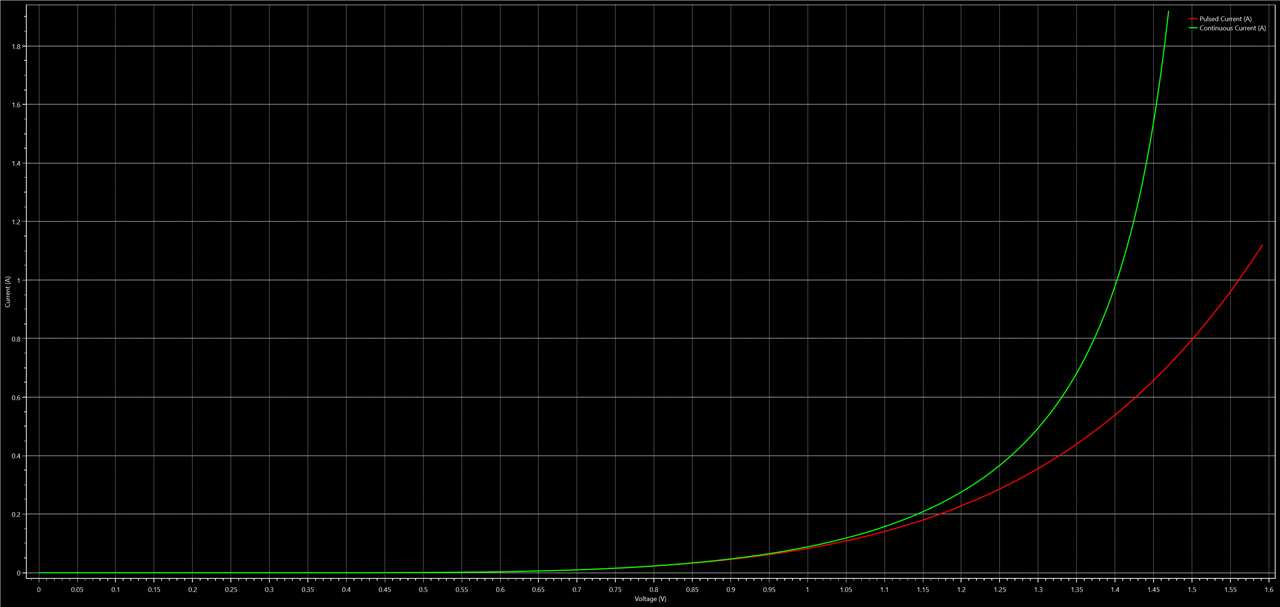
As expected, the moment the “continuous sweep” got into the mW range, both curves began to diverge. At 1.45 V, the self-heated diode transferred more than twice the amount of current of the “non-heated” diode, while at 1 A, the forward voltage difference was around 0.15 V.
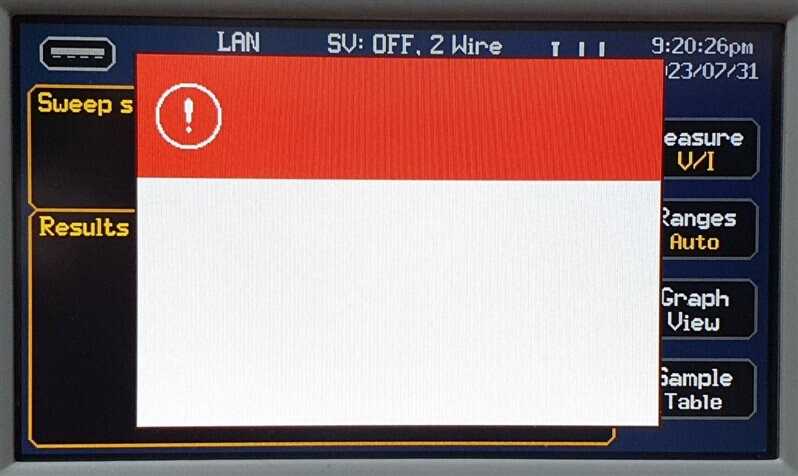
One thing that I noticed is that when protections trip, a red window appeared in the instrument’s front panel, but without any text on it. And for some reason the overcurrent protection tended to trip far before reaching 2 A, which is something that did not occur when I performed the sweep in 2-wire mode.
6.2.2 Conclusions
Voltage or current sweeps are standard features of SMUs that allow them to generate I-V curves. One drawback of performing continuous sweeps is that at they can self-heat the DUTs when the SMU output reaches the mW range, shifting in this way the I-V curve. The ability to perform a pulsed sweep allows an SMU to generate an I-V curve of a DUT with reduced self-heating. To do this, the SMU makes the measurements during the application of short pulses to the DUT, followed by a resting period that allows the DUT to return to its resting temperature after each pulse.
AIM-TTi’s SMU Test Bridge, while conveniently exposing most of the SMU front-panel functionality in addition to extra features such as an arbitrary waveform generator, still needs considerable improvement. While performing the measurements I had a couple of crashes, which appeared to have been triggered by pressing the Apply button too quick. Other less serious bugs that I found were for instance that when I tried to check the values of the measured points in the graphical view, it would only show me the current and not the voltage. The current was always in the Ampere range with 4 decimal digits, so for low currents it would always show “0.0000 A”. Nice features that I would like to see in future releases would be measuring capabilities in the graphical view, without them, one either must make rough guesses, or just save the data as CSV and import it from somewhere else for further analysis. The SMU firmware, on the other hand, felt much more mature, although still with a few bugs.
