


In this post, I examine in a little more detail how well the Sensor Cube and the Wireless hub's antennas and wireless communication can work. In talking with Gough Lui and others, there may be some distance limitations that are not as good as they could be.
This is written as a follow up to my recent Road Test of the IDT Wireless evaluation kit as the official evaluation period is closed now.
I came up with a few simple tests which I will show the results of below. For the signal strength of the sensor cube, there aren't any part numbers on the chip antenna on the sensor cube, so I can't pull any data sheets. The wireless hub is a PCB antenna created from traces of copper and vias, so there is definable no datasheets available.
My tests are as follows:
- Compare signal strength of the cube using an "RF Explorer" handheld spectrum analyzer.
- I will have the cube a different distances and compare the dBm measured at ~906 mHz range for each of the six sides pointed at the frequency analyzer. This will tell me if there is directionality to the antenna on the cube.
- I will use a set of fixed distances and use the "peak hold" function while doing a 3-minute per side recording period.
- I will gather three sets of data and average them.
- This test will tell me transmit strength of each device. It does not validate how well each device can receive weak signals.
- Repeat test #1 with the wireless hub.
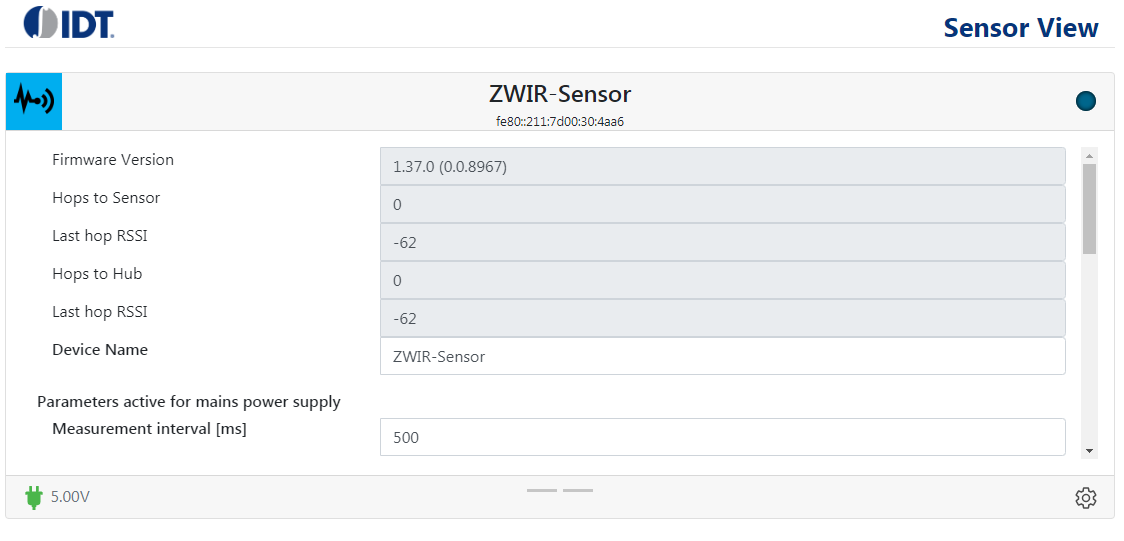
- Once tests 1 and 2 are complete, I should be able to approximate the strongest signal direction for both the wireless hub and sensor cube. I will try to validate this by checking the orientation combinations (36) between the two devices and record the RSSI displayed in the web interface; which is read out for both hub --> sensor and for sensor --> hub. The RSSI is a combination of both sending & receiving signal strength. This means that even though the device is good at transmitting in a certain direction, doesn't necessarily mean that it can receive weak signals. RSSI is more of a "throughput" of signal strength versus just a transmit strength.
- I'll recreate Gough's experiment reading out RSSI at 1, 2, 3, 4, 5 meter distances between the two devices. Ideally, I get the same results as his experiment. He found that after 5 meters, the devices basically dropped out.
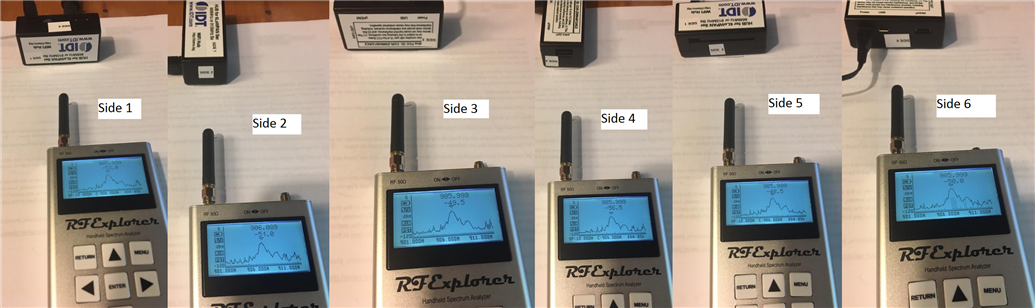
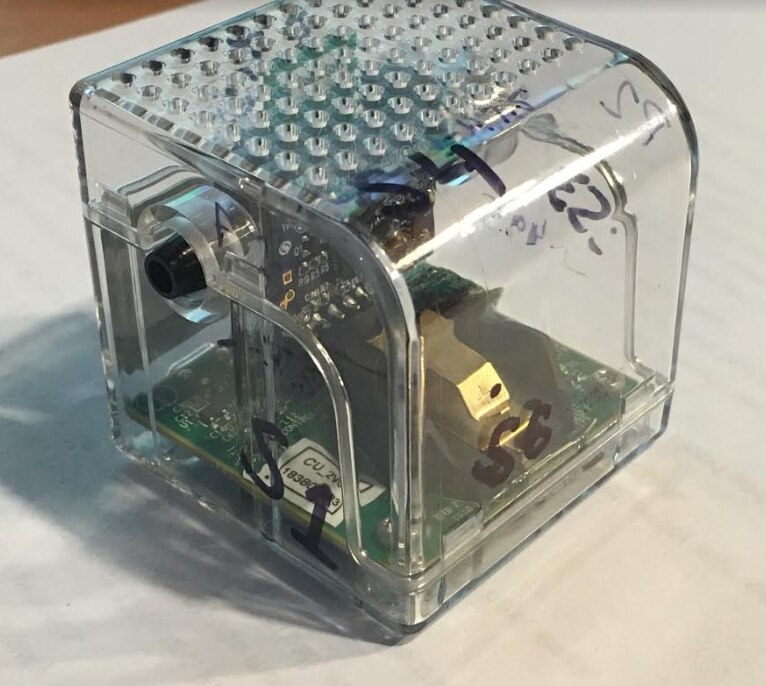
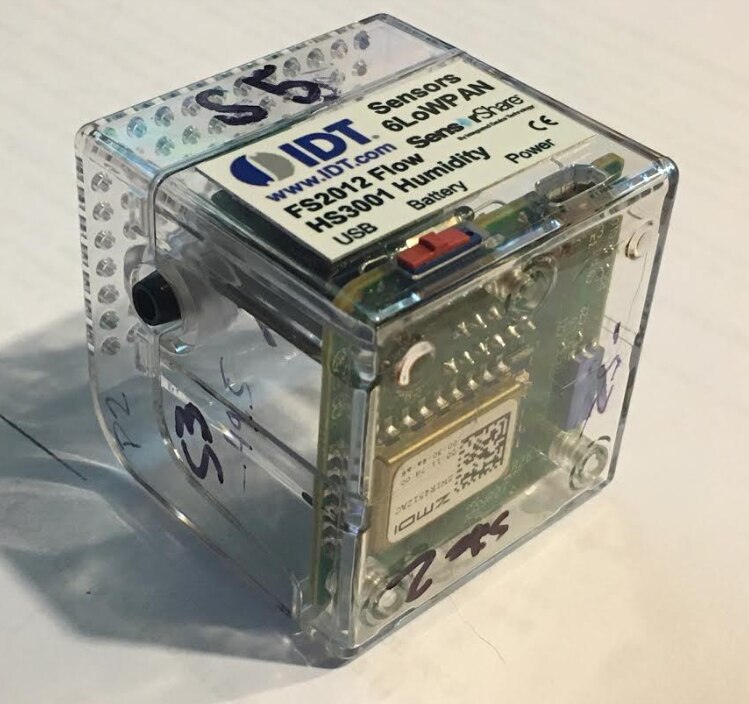
The smaller of the two antennae on the RF Explorer was being used for this series of tests. All tests were done with the cases fully in place. Further tests could find if the case design attenuates the signal unduly; but I am not planning on investigating that as I am testing the "as delivered" version of the product. All tests were done with the sensor cube running on mains (USB) power and not battery power.
Test 1 results
Test data - Best value in bold. Worst value shown in red for each sample set.
| Side | Description | 2" Distance | 2" #2 | 2" #3 | 2" Average | 20" Distance | 20" #2 | 20" #3 | 20" Average |
|---|---|---|---|---|---|---|---|---|---|
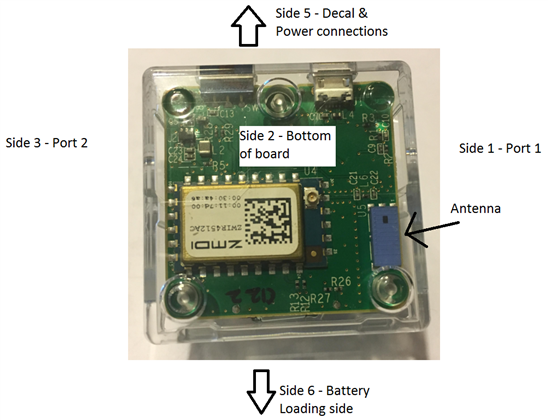
| Side 1 | Port 1 side | -48.5 | -47.5 | -49.5 | -48.5 | -66.0 | -63.5 | -63.0 | -64.16 |
| Side 2 | Bottom | -52.0 | -59.0 | -54.0 | -55.0 | -62.0 | -64.5 | -66.0 | -64.16 |
| Side 3 | Port 2 side | -49.5 | -47.0 | -48.0 | -48.16 | -66.5 | -66.5 | -63.5 | -65.5 |
| Side 4 | Top (vent) side | -47.5 | -48.0 | -48.0 | -47.83 | -64.5 | -65.0 | -68.5 | -66.0 |
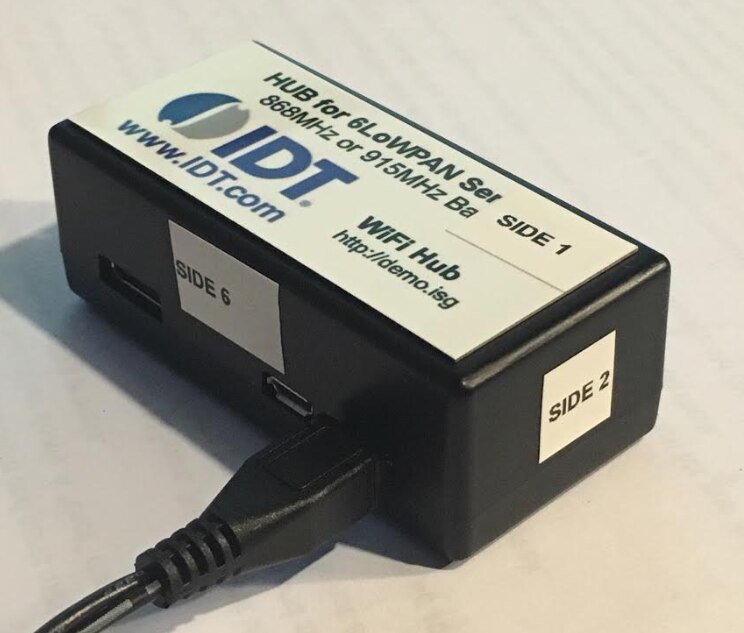
| Side 5 | Decal & power connection | -44.5 | -46.0 | -42.5 | -44.33 | -65.5 | -65.0 | -55.0* | -61.83 |
| Side 6 | Battery loading side | -44.5 | -46.0 | -45.5 | -45.3 | -66.0 | -63.5 | -61.0 | -63.5 |
*This data point appears to be an outlier, but I don't think it is unreasonably skewing the final averages
** If anyone knows how to highlight cells on this forum, please let me know!
This test showed that side 5 - "Decal and Power connection" of the cube has the strongest RF signature, so that's the side which should face the wireless hub for best results. This is a but surprising since that side has an aluminum decal which I would figure to attenuate the signal at least a little. However, it was only the strongest by a couple of dBm, so actual performance difference may to be negligible. The next best was Side 6, the battery loading side. This is directly opposite on the cube, 180 degrees, from side 5, so it shows some directionality to the antenna. The top and bottom of the cube had pretty poor results with the bottom being the worst at 2" and the top being the worst at 20". Port 1 and Port 2 sides are average for each sample set compared to the other sets of sides. I feel reasonably confident in these test results based on the "paring" of sides that it showed. Each pair of opposite cube sides showed similar to each other, and we have strongest along the length of the antenna and weakest coming from the top & bottom. I think that I got a "flier" in my data reading side 5 at 20", but I don't think it changes the story even with that.
Winner - Side 5 - Decal & power connections has the strongest signal
Test 2 Results
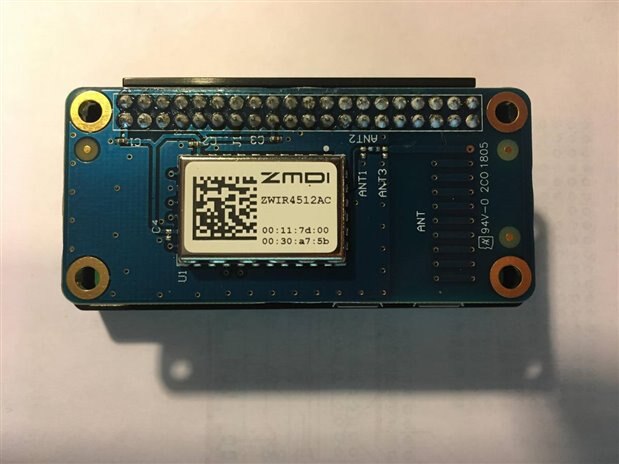
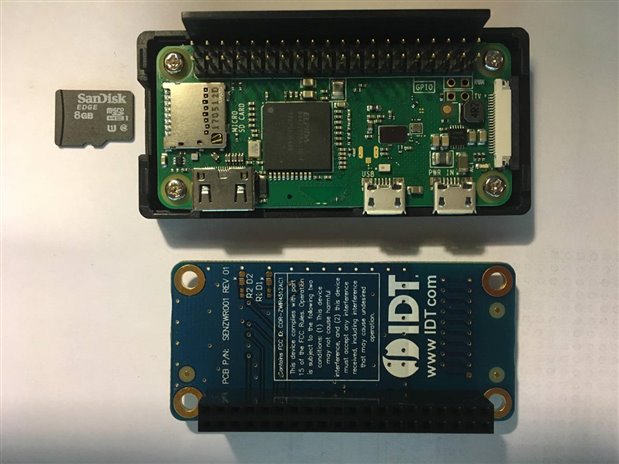
The wireless hub is made up of a RaspberryPi Zero W with a "hat" (daughter board). The Hat holds the ZWIR4512 chip and has a wireless antenna made up of PCB traces in a spiral shape going through vias and copper traces on the board. This is a much different antenna solution to the chip antenna on the sensor cube.
The bottom of the module is expected to have the weakest signal strength since the signal would have to go either through or around the RaspberryPi board.
| Side | Description | 2" Distance | 2" #2 | 2" #3 | 2" Average | 20" Distance | 20" #2 | 20" #3 | 20" Average |
|---|---|---|---|---|---|---|---|---|---|
| Side 1 | Top; main label | -53.0 | -51.5 | -52.0 | -52.16 | -66.5 | -69.0 | -59.5 | -65.0 |
| Side 2 | Small end, closed | -51.0 | -49.0 | -50.5 | -50.16 | -64.5 | -64.0 | -65.5 | -64.66 |
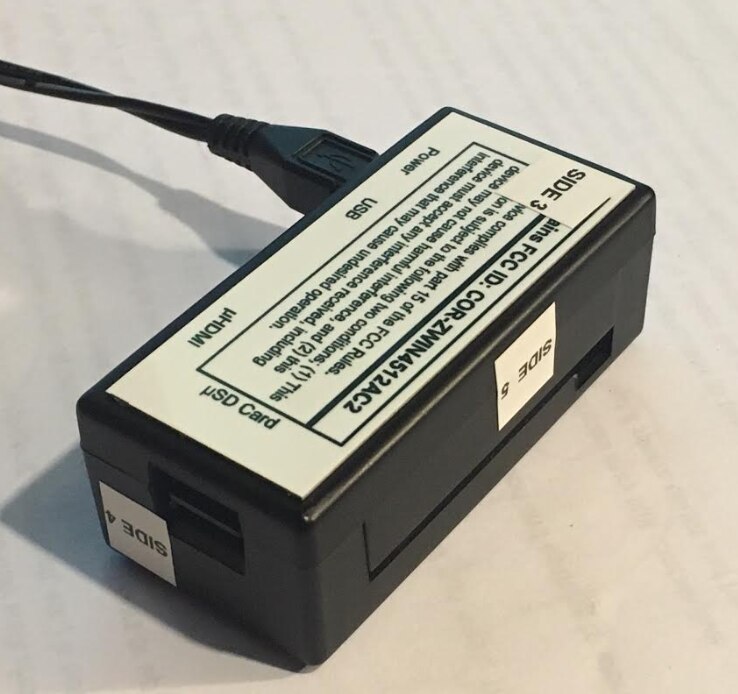
| Side 3 | Bottom; FCC label | -49.5 | -50.5 | -54.0 | -51.33 | -65.0 | -65.0 | -69.0 | -66.33 |
| Side 4 | Small end, SD card | -56.5 | -56.5 | -62.0 | -58.33 | -71.5 | -62.0 | -64.5 | -66.0 |
| Side 5 | Wide empty side | -48.5 | -53.0 | -53.5 | -51.66 | -64.0 | -67.5 | -63.0 | -64.83 |
| Side 6 | Power, USB/HDMI ports | -50.0 | -44.5 | -45.0 | -46.5 | -63.5 | -63.0 | -65.0 | -63.83 |
My estimate turned out accurate that the bottom of the wireless hub had the weakest signal (at least from 20 inches).The strongest signature was from the connection port side of the module (side 6). This side would be opposite of [side 5] the wide, empty side. As noted above, this is really a test of how strong the transmit signal getting out of the module is. The next test will validate the "total travel" of the signal - leaving one device and being received at another device.
Test 3 Results
Distance between devices: 20" for this set of tests.The prediction is that based on tests 1 and 2, the strongest signal strength will be equal to the side with the highest dBm strength @ 20" from above facing the opposite module. Side 5 is the strongest signal from the sensor module and side 6 is the strongest from the hub. So I should have the overall highest RSSI when sensor side 5 faces hub side 6. I took these measurements by watching the readout on the web interface for the module and rotated each module one side at a time. I would watch for the RSSI numbers to settle out the record the mean displayed value.
RSSI Hub Tx to Sensor Rx:
| Sensor side-> | 1 | 2 | 3 | 4 | 5 | 6 | Avg |
| 1 hub side | -77 | -62 | -62 | -68 | -62 | -62 | 65.5 |
| 2 | -66 | -63 | -62 | -78 | -69 | -64 | 67 |
| 3 | -72 | -62 | -62 | -69 | -66 | -62 | 65.5 |
| 4 | -66 | -62 | -66 | -62 | -62 | -62 | 63.3 |
| 5 | -72 | -66 | -80 | -63 | -81 | -69 | 71.8 |
| 6 | -66 | -66 | -75 | -57 | -64 | -63 | 65.2 |
| Average | 69.8 | 63.5 | 67.8 | 66.2 | 67.3 | 63.7 |
RSSI Sensor Tx to Hub Rx:
| Sensor side-> | 1 | 2 | 3 | 4 | 5 | 6 | Avg |
| 1 Hub side | -78 | -62 | -62 | -69 | -66 | -59 | 66.0 |
| 2 | -67 | -64 | -62 | -78 | -70 | -66 | 67.8 |
| 3 | -72 | -62 | -61 | -69 | -66 | -60 | 65.0 |
| 4 | -66 | -59 | -66 | -59 | -62 | -62 | 62.3 |
| 5 | -72 | -66 | -80 | -64 | -81 | -69 | 72.0 |
| 6 | -66 | -66 | -75 | -56 | -66 | -66 | 65.8 |
| Average | 70.2 | 63.2 | 67.7 | 65.8 | 68.5 | 63.7 |
Unfortunately, Test 3 test did not back up the predictions based on tests 1 and 2, but given that the tests 1 and 2 all had results within a few dBm, that may explain it a little. I would have expected the sensor to have the best results when facing the hub via Side 5, but it had the best with using Side 4. And with the hub, I would expect its best results with sides 5 or 6 facing the sensor cube; but the best RSSI was was on side 4. More investigation would bee needed to find more information.
Test 4 results
The genesis of this post was based on Liu's finding of poor signal strength which seems to completely fall off at 5 meters and make the device unusable. I will perform the same test as him but have the modules face each other accordingly as per test 3 to give the best possible result.
I will test at approximately 1- 5 meters of distance between the devices, but since metric is SO complicated and hard to under stand, I'll instead test at 39.37 to 196.85 inches  . This test was done with Side 2 (bottom) of the sensor facing side 4 (SD Card) side of the hub since they gave the best results in test #3.
| Distance | RSSI Hub 2 Sensor | RSSI Sensor 2 Hub |
|---|---|---|
| 39.97" | -72 | -73 |
| 78.74" | -78 | -79 |
| 118.11 | -75 | -75 |
| 157.48 | -87 | -87 |
| 196.85 | -81 | -83 |
So again I get some non-linear results trying to maintain everything else constant. I double checked these results and kept getting the same things.
The final few RSSI measurements are based on some sample applications I had wanted to use this device for.
1. Use the gas flow sensor to monitor the radon mitigation system. I placed the cube in the corner of my basement on the far side of my furnace where the radon pump is located. The hub is located about 5 meters away in the same room but not line of site. I got about -87 for this test which was still quite usable.
2. Use the liquid flow sensor to monitor the reverse osmosis system under my kitchen sink. The hub is located about 2-3 meters away but on a different floor of the house. I got about -88 dBm in this test.
Summary
Although I got some inconsistent results in the later tests, the unit stayed usable a different distances and with objects like walls and ceilings between them.
Top Comments