


3.1 Solar cell characterization (worflow comparison)
Solar or photovoltaic cells are devices that convert light energy directly into electricity. The shape of the solar cell I-V curve makes the maximization of the output power an important goal to maximize the efficiency of the light to electrical energy conversion. As it can be seen in the image, the maximum power (Pmax) occurs at the Vmax voltage and Imax current. Other important values that characterize the curve are the open circuit voltage (Voc) and the short circuit current (Isc).

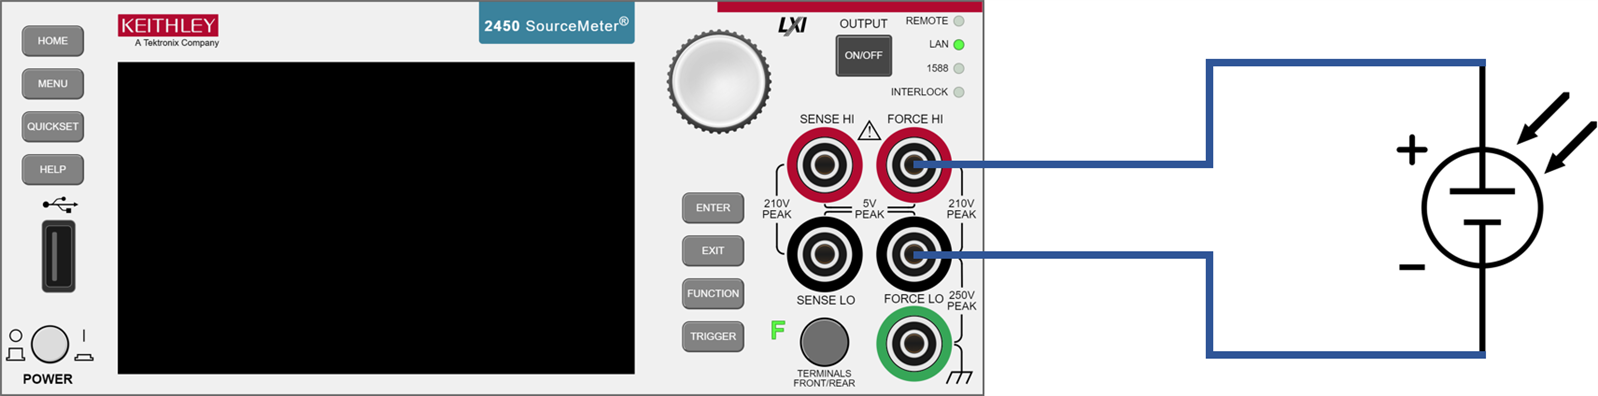
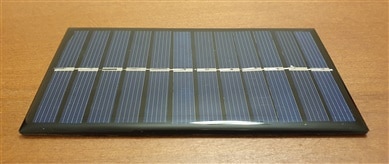
I connected a small 6 V solar panel to the instrument to compare how the different user interfaces (front panel, Web, KickStart, Keithley’s I-V tracer APP and the TSP scripting engine) are used to perform the same task of measuring the Pmax, Vmax, Imax, Voc and Isc values. All experiments were performed in similar light conditions, artificial light without natural light. The purpose of this was to show how flexible the instrument is and how the different workflows compare to each other.
3.1.1 Front panel
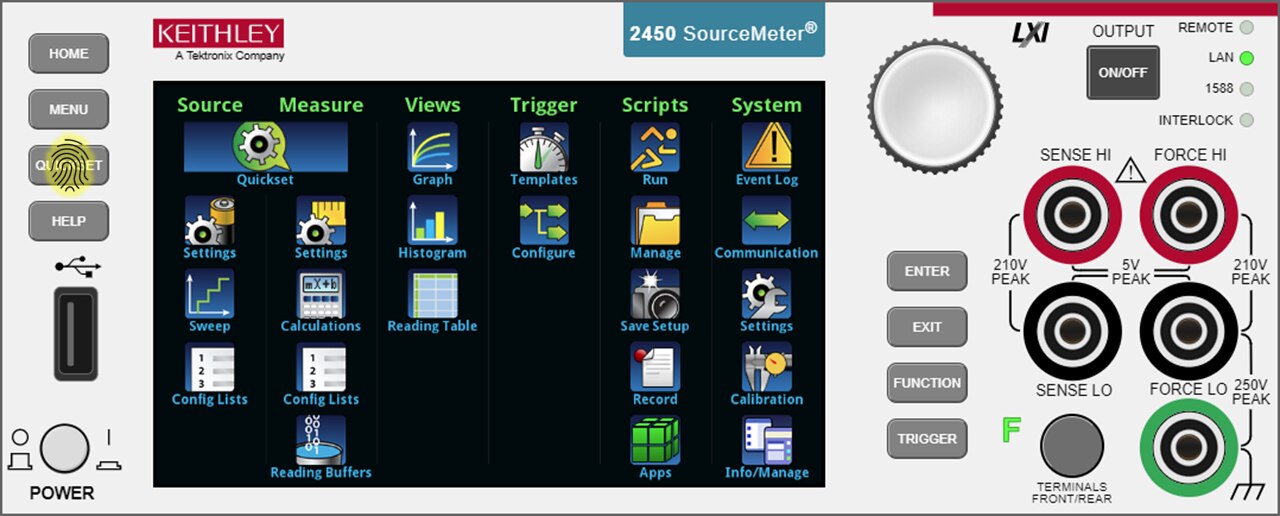
Even with the front panel there are multiple ways to accomplish the same task, what I'm going to show here is just one of them. The following images show the sequence of presses to accomplish the different tasks.
To measure the Voc I pressed QUICKSET and set the SMU as a voltmeter, which actually just sets the SMU as a 0 A source.


To measure the Isc I pressed QUICKSET again and set the SMU as an ammeter, which sets SMU as a 0 V source.


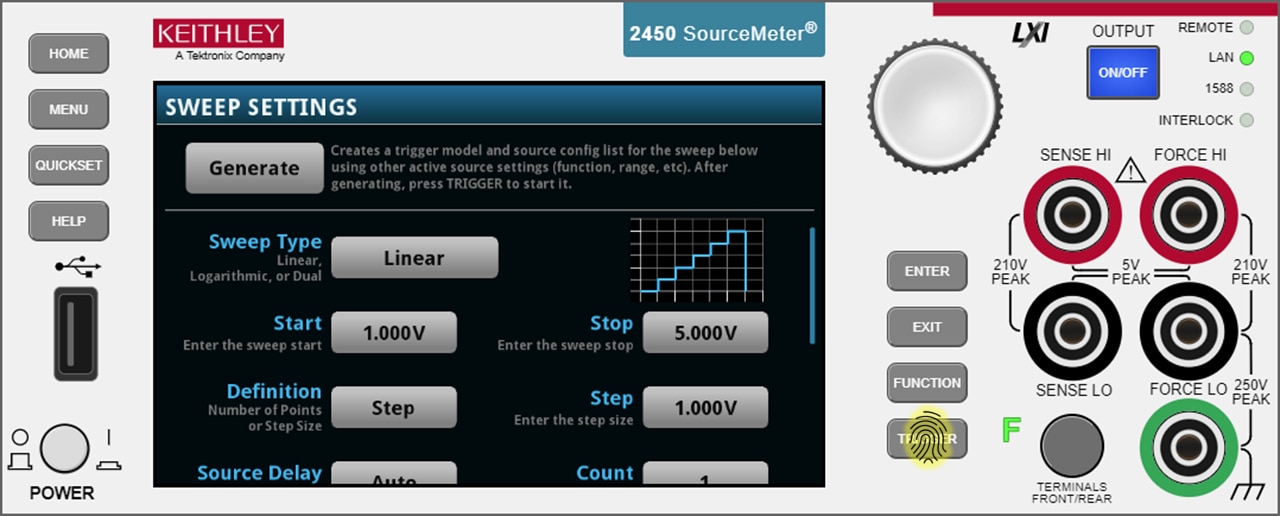
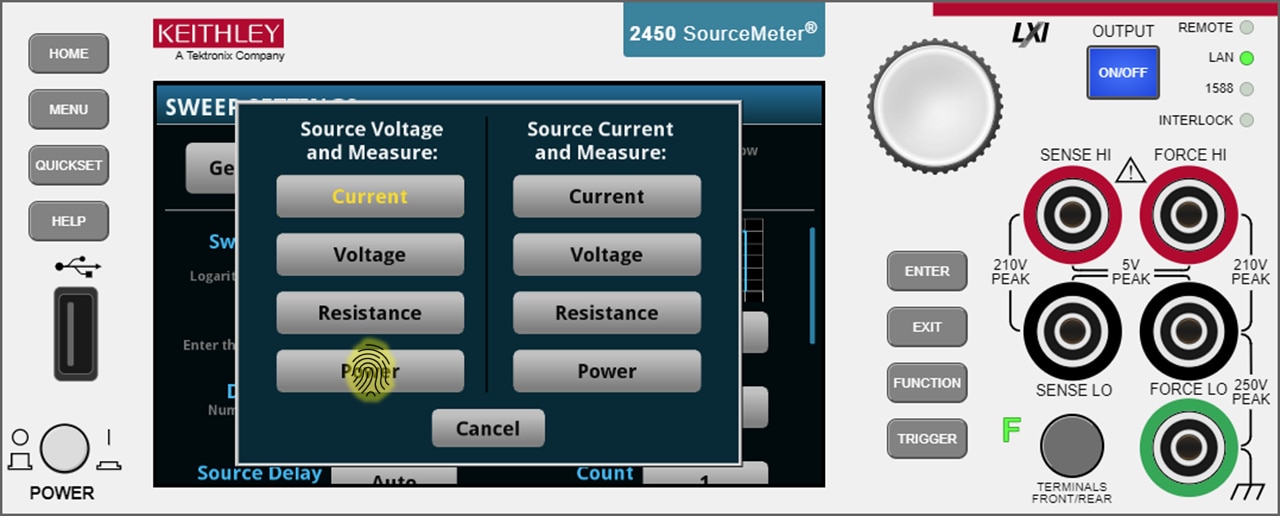
To find the Pmax, Imax, and Vmax a sweep is required. I pressed the sweep icon from the main menu and set the SMU to act as a voltage source and to measure power. I set the parameters so that the voltage sweep begins at 0 V, ends at 3 V, and uses a step of 100 mV. Then I pressed generate to generate the sweep trigger model.


After pressing generate I could immediately press TRIGGER to begin the sweep, but I went to the graph view before pressing the trigger just to see how the V-P curve gets traced. At the graph view I pressed TRIGGER and the curve got traced. Since the instrument is sinking power (positive voltage, negative current), the curve is inverted compared to the previously shown image. The most negative point of the graph is the Pmax point, or the point where the instrument sinks the maximum amount of power.


To find the values of Pmax and Vmax I got back to the main menu and then opened the "Reading Table". The table showed the 31 measured value pairs, where the most negative power value is Pmax and the voltage that generated it is Vmax.


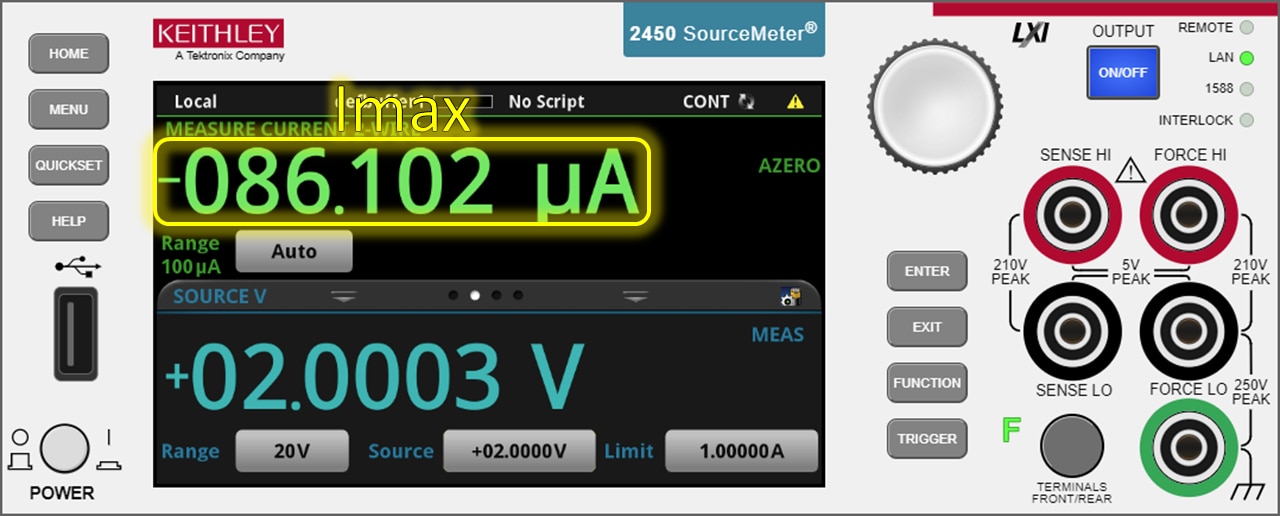
Finally I could have just divided Pmax by Vmax to calculate Imax, but instead I set the instrument as an ammeter (0 V power supply), and then set it to source 2 V (Vmax) and measured the current, which was Imax.


Here is a video to that shows the complete sequence:
3.1.2 Web remote control
The virtual front panel could be used to perform the same exact previous operations, but since the virtual front panel is less responsive, there are better approaches to perform the same task. I opened the web page, selected "Virtual Front Panel" from the web menu, and then performed a sweep the same way as I did using the front panel. Then I selected "Extract data" from the web menu and downloaded the "defbuffer1.csv" file.


The downloaded file contained:
Style,Standard Append Mode,1 Fill Mode,1 Capacity,100000 Count,31 Base Time Seconds,1590965091 Base Time Fractional,.414148240 Base Time,05/31/2020 22:44:51.414148240 Index,Reading,Unit,Range Digits,Disp Digits,Math,Start Group,Limit1 High,Limit1 Low,Limit2 High,Limit2 Low,Terminal,Questionable,Origin,Value,Unit,Digits,Output,Sense,Source Limit,Overtemp,Date,Time,Fractional Seconds 1,-2.362010962401e-09,Watt DC,.01,5.5,F,F,F,F,F,F,Front,F,Main,0.0000189139682,Volt DC,10,T,2W,F,F,05/31/2020,22:44:51,.414148240 2,-1.242611311886e-05,Watt DC,.01,5.5,F,F,F,F,F,F,Front,F,Main,0.1001361459494,Volt DC,10,T,2W,F,F,05/31/2020,22:44:51,.497943660 3,-2.471492809181e-05,Watt DC,.01,5.5,F,F,F,F,F,F,Front,F,Main,0.2000370919704,Volt DC,10,T,2W,F,F,05/31/2020,22:44:51,.581734940 4,-3.692363169066e-05,Watt DC,.01,5.5,F,F,F,F,F,F,Front,F,Main,0.3001865744591,Volt DC,10,T,2W,F,F,05/31/2020,22:44:51,.665518540 5,-4.898440827022e-05,Watt DC,.01,5.5,F,F,F,F,F,F,Front,F,Main,0.4000690877438,Volt DC,10,T,2W,F,F,05/31/2020,22:44:51,.749268360 6,-6.088699299122e-05,Watt DC,.01,5.5,F,F,F,F,F,F,Front,F,Main,0.5001206994057,Volt DC,10,T,2W,F,F,05/31/2020,22:44:51,.833037980 7,-7.259131330299e-05,Watt DC,.01,5.5,F,F,F,F,F,F,Front,F,Main,0.5999734997749,Volt DC,10,T,2W,F,F,05/31/2020,22:44:51,.916815560 8,-8.40647693077e-05,Watt DC,.01,5.5,F,F,F,F,F,F,Front,F,Main,0.7001413106918,Volt DC,10,T,2W,F,F,05/31/2020,22:44:52,.000584280 9,-9.518813171384e-05,Watt DC,.01,5.5,F,F,F,F,F,F,Front,F,Main,0.7999204397202,Volt DC,10,T,2W,F,F,05/31/2020,22:44:52,.084344420 10,-0.0001059482062429,Watt DC,.01,5.5,F,F,F,F,F,F,Front,F,Main,0.9000387787819,Volt DC,10,T,2W,F,F,05/31/2020,22:44:52,.168117300 11,-0.0001162873162216,Watt DC,.01,5.5,F,F,F,F,F,F,Front,F,Main,1.0000853538513,Volt DC,10,T,2W,F,F,05/31/2020,22:44:52,.251883000 12,-0.0001260860277386,Watt DC,.01,5.5,F,F,F,F,F,F,Front,F,Main,1.1002522706985,Volt DC,10,T,2W,F,F,05/31/2020,22:44:52,.335640500 13,-0.0001352475816465,Watt DC,.01,5.5,F,F,F,F,F,F,Front,F,Main,1.1999809741974,Volt DC,10,T,2W,F,F,05/31/2020,22:44:52,.419413760 14,-0.0001437357491305,Watt DC,.01,5.5,F,F,F,F,F,F,Front,F,Main,1.3001267910004,Volt DC,10,T,2W,F,F,05/31/2020,22:44:52,.503188300 15,-0.0001513876754576,Watt DC,.01,5.5,F,F,F,F,F,F,Front,F,Main,1.4000886678696,Volt DC,10,T,2W,F,F,05/31/2020,22:44:52,.586960380 16,-0.00015805077187,Watt DC,.01,5.5,F,F,F,F,F,F,Front,F,Main,1.5000593662262,Volt DC,10,T,2W,F,F,05/31/2020,22:44:52,.670741380 17,-0.0001636959037634,Watt DC,.01,5.5,F,F,F,F,F,F,Front,F,Main,1.5999896526337,Volt DC,10,T,2W,F,F,05/31/2020,22:44:52,.754497560 18,-0.0001678899288462,Watt DC,.001,5.5,F,F,F,F,F,F,Front,F,Main,1.7004889249802,Volt DC,10,T,2W,F,F,05/31/2020,22:44:52,.996550460 19,-0.0001709166287472,Watt DC,.001,5.5,F,F,F,F,F,F,Front,F,Main,1.8002762794495,Volt DC,10,T,2W,F,F,05/31/2020,22:44:53,.080358420 20,-0.0001723001933525,Watt DC,.001,5.5,F,F,F,F,F,F,Front,F,Main,1.9004484415054,Volt DC,10,T,2W,F,F,05/31/2020,22:44:53,.164141280 21,-0.0001718377743489,Watt DC,.001,5.5,F,F,F,F,F,F,Front,F,Main,2.0002257823944,Volt DC,10,T,2W,F,F,05/31/2020,22:44:53,.247930840 22,-0.0001694016863904,Watt DC,.001,5.5,F,F,F,F,F,F,Front,F,Main,2.1003320217133,Volt DC,10,T,2W,F,F,05/31/2020,22:44:53,.331717780 23,-0.0001646206495683,Watt DC,.001,5.5,F,F,F,F,F,F,Front,F,Main,2.2001404762268,Volt DC,10,T,2W,F,F,05/31/2020,22:44:53,.415515680 24,-0.0001571914208,Watt DC,.001,5.5,F,F,F,F,F,F,Front,F,Main,2.3003673553467,Volt DC,10,T,2W,F,F,05/31/2020,22:44:53,.499291720 25,-0.0001470425619964,Watt DC,.001,5.5,F,F,F,F,F,F,Front,F,Main,2.4001474380493,Volt DC,10,T,2W,F,F,05/31/2020,22:44:53,.583073020 26,-0.0001335032652025,Watt DC,.001,5.5,F,F,F,F,F,F,Front,F,Main,2.5002989768982,Volt DC,10,T,2W,F,F,05/31/2020,22:44:53,.666843100 27,-0.0001165836340393,Watt DC,.001,5.5,F,F,F,F,F,F,Front,F,Main,2.6002016067505,Volt DC,10,T,2W,F,F,05/31/2020,22:44:53,.750626720 28,-9.545069791743e-05,Watt DC,.001,5.5,F,F,F,F,F,F,Front,F,Main,2.7002553939819,Volt DC,10,T,2W,F,F,05/31/2020,22:44:53,.834403820 29,-6.990428710516e-05,Watt DC,.001,5.5,F,F,F,F,F,F,Front,F,Main,2.8000016212463,Volt DC,10,T,2W,F,F,05/31/2020,22:44:53,.918187000 30,-3.936827506013e-05,Watt DC,.001,5.5,F,F,F,F,F,F,Front,F,Main,2.9001667499542,Volt DC,10,T,2W,F,F,05/31/2020,22:44:54,.001974440 31,-1.951180529266e-06,Watt DC,.000001,5.5,F,F,F,F,F,F,Front,F,Main,3.0004289150238,Volt DC,10,T,2W,F,F,05/31/2020,22:44:54,.414318200 |
Now with the sweep data file I could manually look for, or calculate the solar cell parameters, but probably the simplest way is to just use a spreadsheet to compute the parameters.
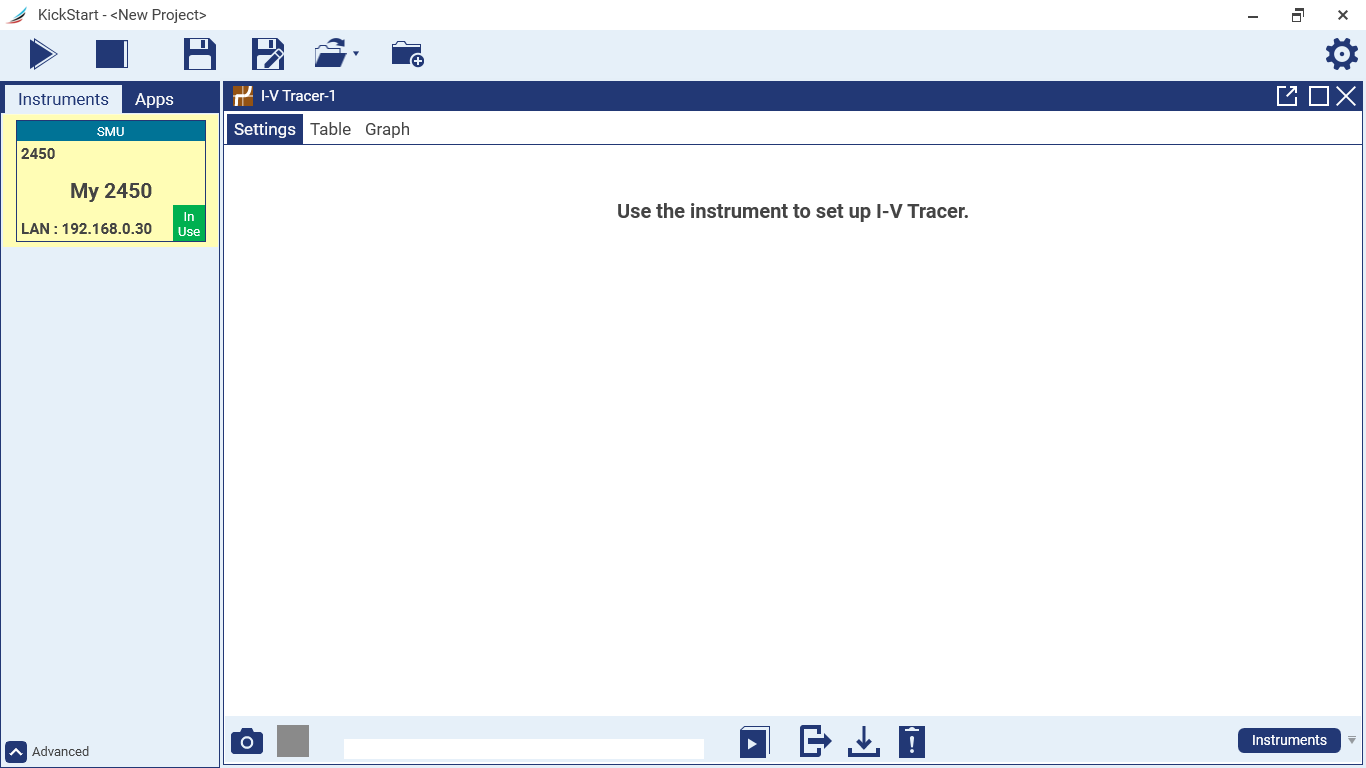
3.1.3 KickStart
KickStart maked it really simple to measure the solar cell parameters. First I double clicked on the instrument ("My 2450"), then I chose "I-V Characterizer", and then I set the sweep parameters as seen in the screen capture. I pressed the "play" button to begin the sweep and then I was able to explore the data from either a table or graphically. In the graph tab through the use of cursors and the ability of KickStart to find the minimum value I quickly was able to find all the solar cell parameters. KickStart can save the data as CSV or an image of the plotted graphs.


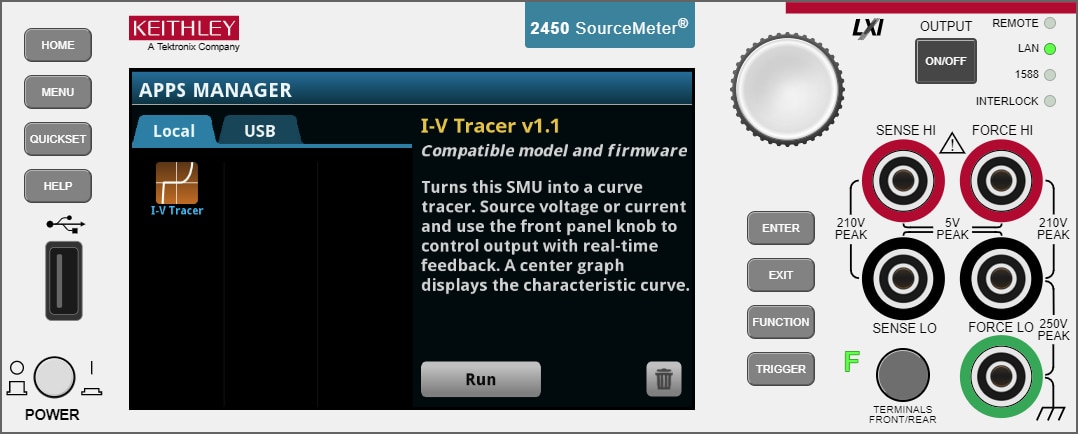
3.1.4 I-V tracer app
I-V tracer is a TSP app that makes the SMU behave a bit like a curve tracer. The TSP app must be installed to the instrument through KickStart, after that it stays in the instrument and can be used even in a stand-alone way.
To initiate the app, I selected "Apps" from the main menu, then "I-V Tracer" and then pressed "Run". At the main I-V tracer screen I pressed "Settings" to set the tracing parameters


I set the tracer to operate as a voltage source, set the maximum voltage to 3.5 V, the current limit to 10 mA, the sensing to 2-wire and the polarity to positive. Then I got back to the tracing screen and pressed the OUTPUT button to begin the tracing. The instrument plots a violet point at the current I-V position which can be changed through the rotation of the navigation wheel. The navigation wheel controls the voltage which can be read directly at the bottom right of the screen along with the current. The Isc and Voc values were simple to measure, but it took a bit of effort to get the tracer to the 0 A position because of the navigation wheel acceleration. Unless I missed it, it does not seem to be possible to plot power, which would mean that its not possible to easily find Pmax from within the app.

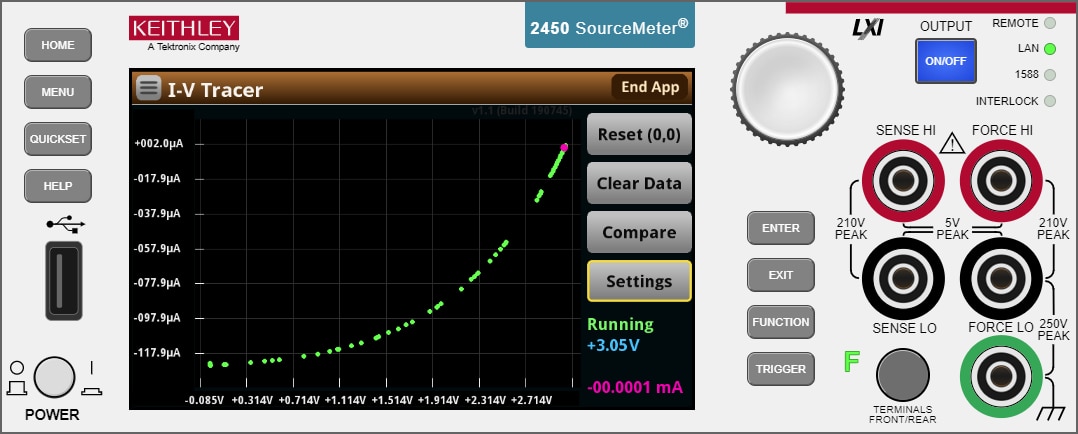
I-V tracer modifies the instrument's menu, but still gives access to the reading table and reading buffer management. The latter can be used to save the buffer data to a USB drive.


A simpler way to transfer the data to the computer is with KickStart. To do that, I selected the SMU from Kickstart's instrument list and then the "I-V tracer" operation mode. To download the data I pressed the camera icon at the bottom, and program automatically downloaded the used I-V tracer settings and the measured I-V points. The downloaded data can then be explored from either the table or the graph view or saved to a file just like when using KickStart in the "I-V Characterizer" operation mode.


3.1.5 Remote control
To remotely control the instrument I used Python. The Python program loads "SolarCell.tsp" and replaces the "{:d}" in the file (equivalent to "%d" in C/C++) with the number of sweep steps. The TSP code first sets instrument as a 0 A current source and measures the Voc. Then it performs a voltage sweep from 0 V to Voc with the specified number of steps. The sweep stores the data in the default buffer defbuffer1 which then is read in a loop to find Pmax, Vmax and Imax. Finally I print() the values from the SMU to the Python program.
| SolarCell.tsp |
|---|
local step = {:d} -- Number of steps
reset() smu.measure.func = smu.FUNC_DC_VOLTAGE -- override smu.FUNC_DC_CURRENT smu.source.func = smu.FUNC_DC_CURRENT -- override smu.FUNC_DC_VOLTAGE smu.source.output = smu.ON local voc = smu.measure.read() smu.source.output = smu.OFF defbuffer1.clear() smu.measure.func = smu.FUNC_DC_CURRENT smu.source.func = smu.FUNC_DC_VOLTAGE smu.source.ilimit.level = 1 -- override the 100uA default smu.source.sweeplinear("SolarCell", 0, voc, step) trigger.model.initiate() waitcomplete() local voltage = defbuffer1.sourcevalues local current = defbuffer1 local isc = current[1] local pmax = voltage[1] * current[1] local vmax = voltage[1] local imax = current[1] for i = 1, step do if voltage[i] * current[i] < pmax then pmax = voltage[i] * current[i] imax = current[i] vmax = voltage[i] end end print(voc) print(math.abs(isc)) print(vmax) print(math.abs(imax)) |
The Python program is very simple. It connects to the instrument, executes the TSP script and read back the values to finally print them in the console. "Keithley" and "Metric" are helper classes/functions that I use to manage instrument connection and print the values in metric notation respectively.
| SolarCell.py |
|---|
import visa
from Keithley import * from Metric import * # Settings resource = 'TCPIP0::192.168.0.30::inst0::INSTR' step = 50 # Run script keithley = Keithley(resource, 180_000) keithley.runScript(file('SolarCell.tsp').format(step)) # Retrieve values voc = float(keithley.read()) isc = float(keithley.read()) vmax = float(keithley.read()) imax = float(keithley.read()) pmax = vmax * imax # Disconnect from the instrument keithley.close() # Print values print('Voc: {:s}'.format(metric(voc, 5, 'V'))) print('Isc: {:s}'.format(metric(isc, 5, 'A'))) print('Vmax: {:s}'.format(metric(vmax, 5, 'V'))) print('Imax: {:s}'.format(metric(imax, 5, 'A'))) |
The program produced the following output:
Voc: 3.0988 V Isc: 132.94 µA Vmax: 2.0237 V Imax: 94.346 µA |
3.1.6 Standalone script
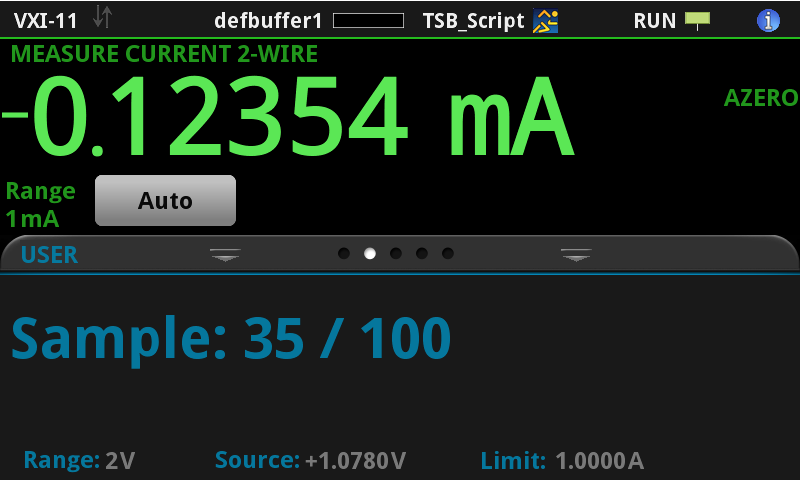
Writing stand-alone scripts usually take more effort, because user input and output must be handled. The first part of the TSP code defines metric(), a function that converts numbers into metric notation. When the script begins I first ask the user to enter the number of sweep steps using the display.input.number() function.

To explain what comes next I will have to get into more details and explain how smu.source.sweeplinear() actually works. The function does 2 things: It builds a source configuration list and a trigger model that uses the configuration list.
Configuration lists are arrays of SMU settings (output voltage levels, current limits, filter settings, etc). There are 2 types of configuration lists, to store source settings (source configuration lists) and to store measure settings (measure configuration list). After a configuration list has been populated, only the name of the configuration list and an index are required to change the settings of the instrument to what is stored at the configuration list index.
Trigger models are sequences of operations that control the instrument to perform sourcing and measuring operations. Trigger models are not as flexible as TSP scripts, but they run in parallel to the TSP script, run faster and have a much tighter timing control. The only way a trigger model can change the source or measure settings of the instrument is by recalling the settings stored at an index of a configuration list.
So what smu.source.sweeplinear() does is to populate a source control list with each of the sourcing values that the sweep requires. trigger.model.initiate() initiates the trigger model and loops a recall of an incrementing element of the source control list, followed by a measure that gets stored in the instrument buffer. The loop ends when all I-V points get evaluated.
Since the trigger model runs in parallel, my script checks the status of the sweep by checking the amount of data that has been stored in the buffer, and displays in the user tab the progress of the sweep through the display.settext() function.
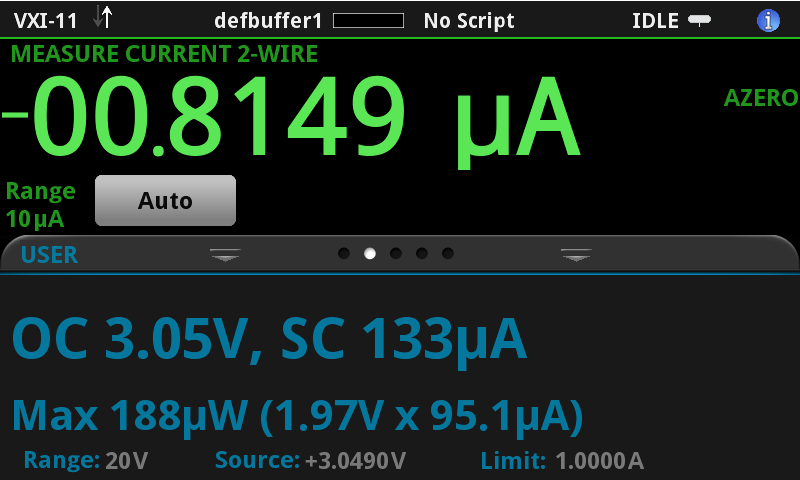
When the sweep finishes, the solar cell parameters are calculated and the results displayed.
-- Convert numbers to metric notation
local function metric(value, digit, unit) value = math.abs(value) local prefix = "" if value < 1 then if value >= 1E-3 then value = value * 1E3 prefix = "m" elseif value >= 1E-6 then value = value * 1E6 prefix = "\20" elseif value >= 1E-9 then value = value * 1E9 prefix = "n" elseif value >= 1e-12 then value = value * 1E12 prefix = "p" elseif value >= 1e-15 then value = value * 1E15 prefix = "f" end end local floatFormat if value >= 100 then floatFormat = string.format("%%.%if", digit - 3) elseif value >= 10 then floatFormat = string.format("%%.%if", digit - 2) else floatFormat = string.format("%%.%if", digit - 1) end return string.format(floatFormat..prefix..unit, value) end reset() display.clear() local step = display.input.number("Sweep steps", display.NFORMAT_INTEGER, 100, 10, 1000) if step != nil then smu.measure.func = smu.FUNC_DC_VOLTAGE -- override smu.FUNC_DC_CURRENT smu.source.func = smu.FUNC_DC_CURRENT -- override smu.FUNC_DC_VOLTAGE smu.source.output = smu.ON local voc = smu.measure.read() smu.source.output = smu.OFF defbuffer1.clear() smu.measure.func = smu.FUNC_DC_CURRENT smu.source.func = smu.FUNC_DC_VOLTAGE smu.source.ilimit.level = 1 -- override the 100uA default smu.source.sweeplinear("SolarCell", 0, voc, step) trigger.model.initiate() while defbuffer1.n < step do delay(0.2) display.settext(display.TEXT1, string.format("Sample: %i / %i", defbuffer1.n, step)) end waitcomplete() local voltage = defbuffer1.sourcevalues local current = defbuffer1.readings local isc = current[1] local pmax = voltage[1] * current[1] local vmax = voltage[1] local imax = current[1] for i = 1, step do if voltage[i] * current[i] < pmax then pmax = voltage[i] * current[i] imax = current[i] vmax = voltage[i] end end
display.changescreen(display.SCREEN_USER_SWIPE) display.settext(display.TEXT1, string.format("OC %s, SC %s", metric(voc, 3, "V"), metric(isc, 3, "A"))) display.settext(display.TEXT2, string.format("Max %s (%s x %s)", metric(pmax, 3, "W"), metric(vmax, 3, "V"), metric(imax, 3, "A"))) end |