


In part 3 of this road test blog series I would like to evaluate the additional functions of the DSOX1102GDSOX1102G oscilloscope I am planning to setup simple experiments to test the serial protocol analyzer function generator digital voltmeter and the frequency response analyzer
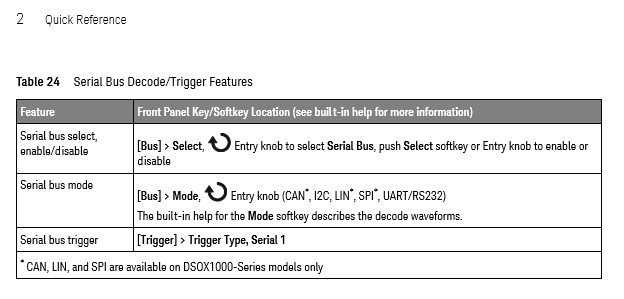
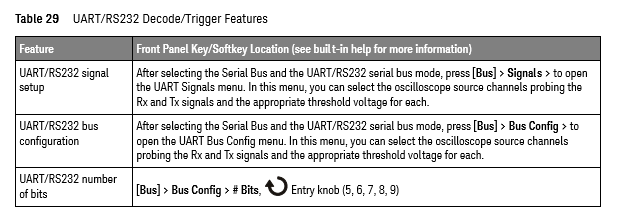
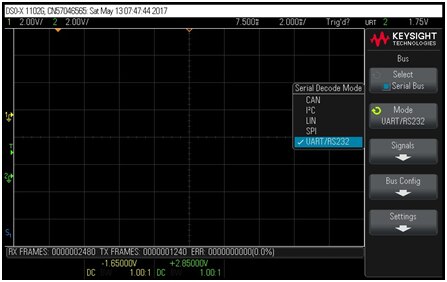
I first started with the serial protocol analyzer. I was particularly interested in this function since I am working on a project where I control an FPGA from a computer through a RS232 interface. So I turned on this project and I setup the Keysight DSOX1102G oscilloscope with channel 1 probing the TX line and channel 2 probing the RX line. For the measurement settings I found very convenient the “quick reference” in the user guide document; it helped me get the measurement active in a few minutes. In particular I liked the tables with instructions, like this one for setting up the type of serial protocol:
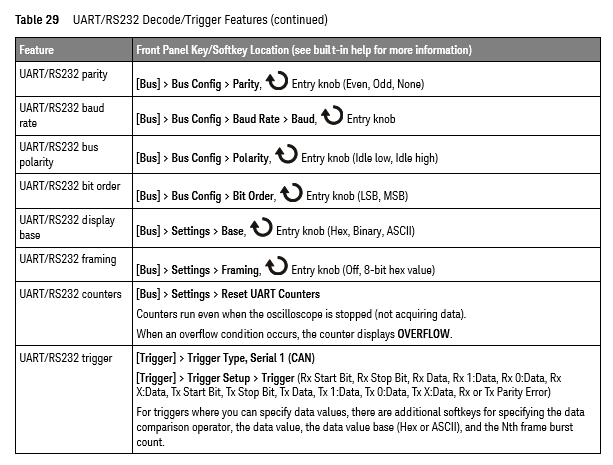
and this one for setting up the trigger mode:
continued on next page:
Here are my steps in setting up the measurement: first I selected the “Serial Bus”:
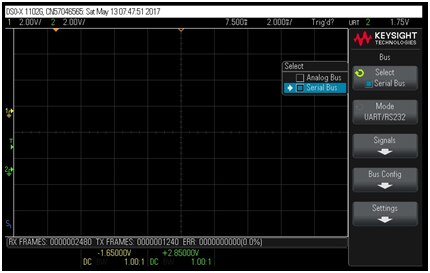
and then I continued with selecting the bus mode as UART/RS232:
Next I configured the UART/RS232 bus to match the settings I have in my FPGA project:

and then I setup the oscilloscope channels:
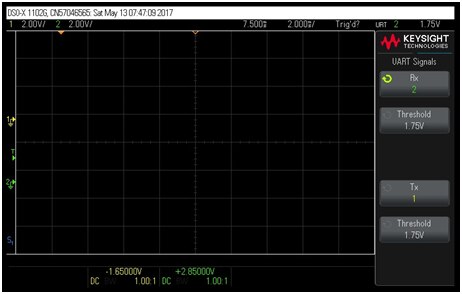
Channel 1 was connected to the TX line and channel 2 to RX. This is 3.3V UART bus so I setup the trigger levels somewhere in the middle of the swing. The trigger function was set to trigger on the TX start bit:
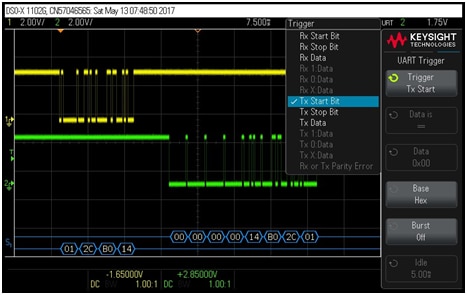
With these settings I started to send date through the serial interface from computer to FPGA and back. Here is a screenshot of the captured data packet:
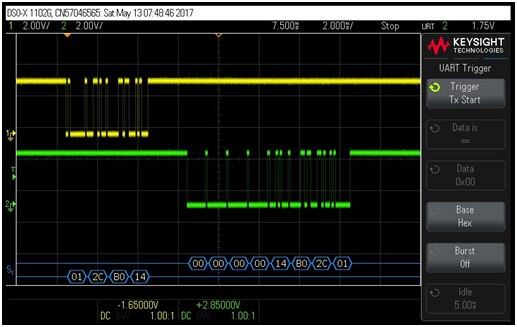
The yellow trace shows the TX line and the green trace shows the RX line. At the bottom of the screen we see the values of the sent data in HEX format (01 2C B0 14). This is an instruction sent to the FPGA. The FPGA responds immediately in this case with zero values (00 00 00 00) followed by a copy of what it has received from the computer (14 B0 2C 01) which is a “reversed order” version of the TX line data. Here is another measurement, this time the FPGA responds with “non-zero” data:
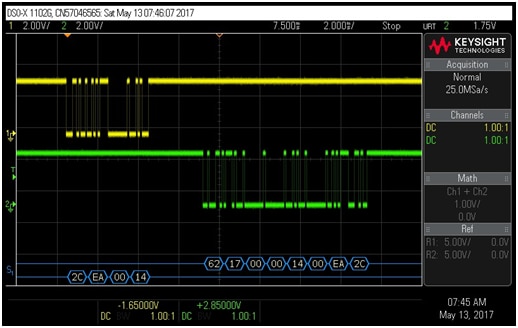
The FPGA data is shown on the RX serial captured data as 62 17 00 00 followed again by a copy of the command received from the computer 14 00 EA 2C (in reversed order).
This was the expected functionality but I wanted to see how the Keysight DSOX1102GDSOX1102G oscilloscope handles wrong data(this is important because we use this scope for troubleshooting and in troubleshooting faulty signals may not follow the serial protocol standard Here is an example of measured data with a failure intentionally inserted in this experiment:
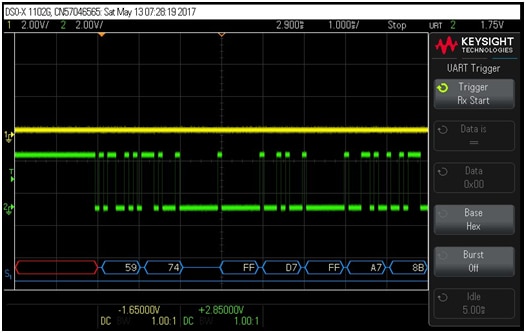
Notice a red section which is “undefined” due to some previous activity that altered the logic sequence of start/stop bits in the serial stream. Notice also a pause on the blue region which is due to signals not following the serial protocol specs. I am impressed of the serial protocol measurement feature of the DSOX1102GDSOX1102G oscilloscope and I am happy to use this function in troubleshooting my projects
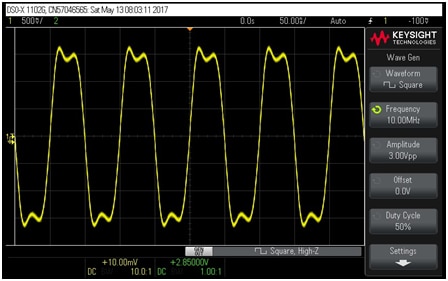
Next I looked at the built-in function generator. I found this feature very useful especially for entry level engineers and students. The function generator can generate square wave signals, sinusoidal, triangular, pulse, DC, and thermal (random) noise. Here is an example of square wave signal:
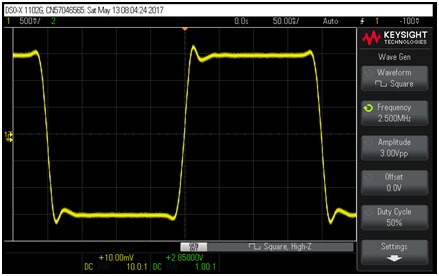
The signal is not perfect, but I think part of the waveform integrity is due to the wires I used for probing. Since the oscilloscope canmeasure waveform aberrations, I used this feature to measure the overshoot, preshoot, duty cycle, and rise time of this waveform:
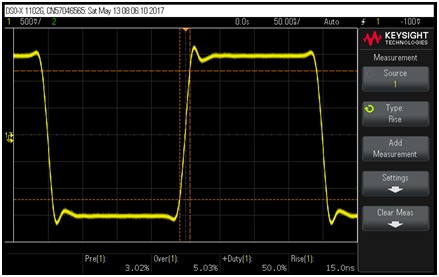
Here we can clearly see the preshoot, right at the beginning of the rising edge. Duty cycle is pretty good (very close to 50%) and rise time is as expected for a square wave signal of the frequency range of this function generator. I then increased the frequency to the maximum value of 10MHz:
I then used the FFT function to look at the frequency spectrum:
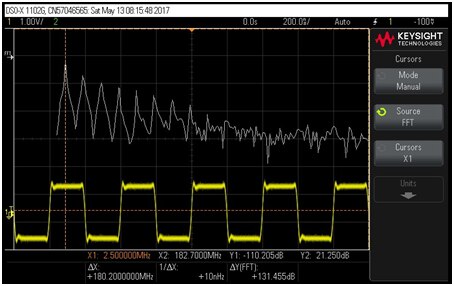
The frequency spectrum follows the expected behavior of fundamental and 3-rd harmonics, as I showed in the previous part of this blog series (in part 2).
I then performed similar measurements for sinusoidal waveform:
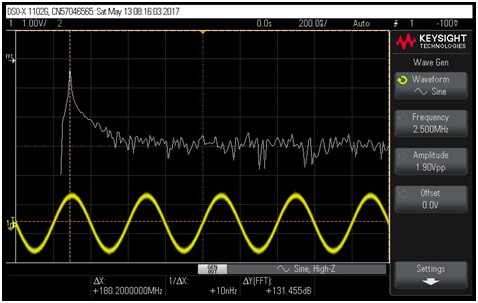
which did not show any visible parasitic spurs.
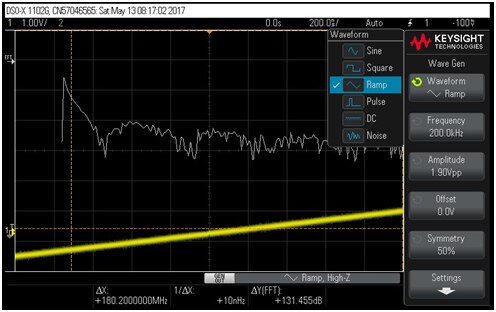
I then setup the function generator to output a triangular waveform:
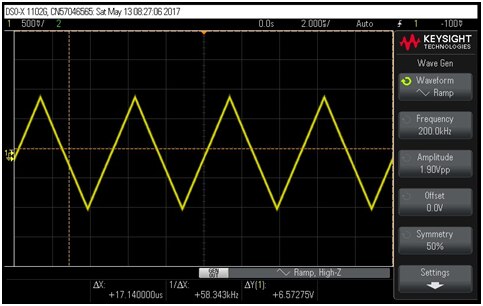
which had the frequency spectrum as shown in the picture below:
The pulse and random noise waveforms are shown in the following two pictures:


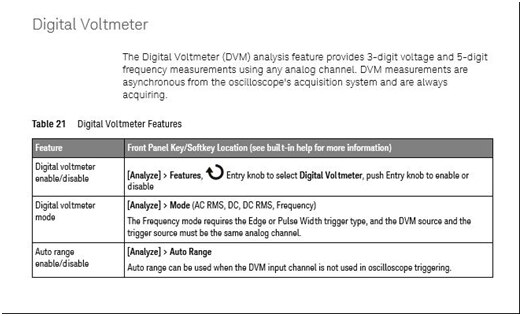
Next I wanted to test the built-n digital voltmeter, but I wasn’t able to do this because my oscilloscope does not have a built-in digital voltmeter. Even though I followed the instructions:
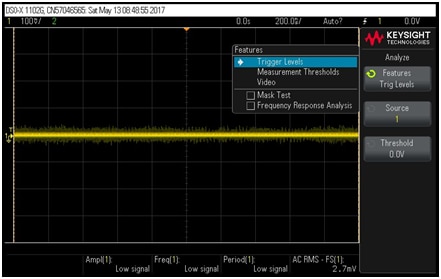
When I got to the “Features” menu there was no “Digital Voltmeter” selection available there:
I even checked the “Help” feature of the oscilloscope, and based on that I was supposed to find a selection for Voltmeter:
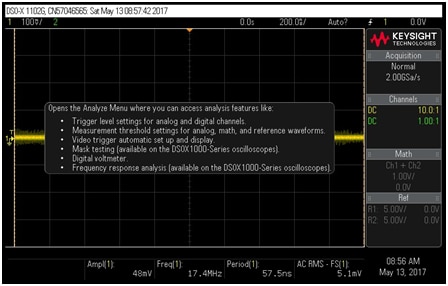
But it looks like somehow this Voltmeter is not available on my oscilloscope. No problem because I have a DMM that I use so not having a built-in Digital Voltmeter in my DSOX1102GDSOX1102G is not an issue I wonder if anyone else has missing voltmeter with the road test oscilloscopes.
My last experiment that I planned was to analyze the frequency response of an amplifier using the frequency analysis function of the Keysight DSOX1102GDSOX1102G oscilloscope So I built an amplifier using an operational amplifier in inverting configuration and I applied a sinusoidal signal at the input(sinusoidal signal generated with the DSOX1102GDSOX1102G oscilloscope. Here is a picture of my testbench:
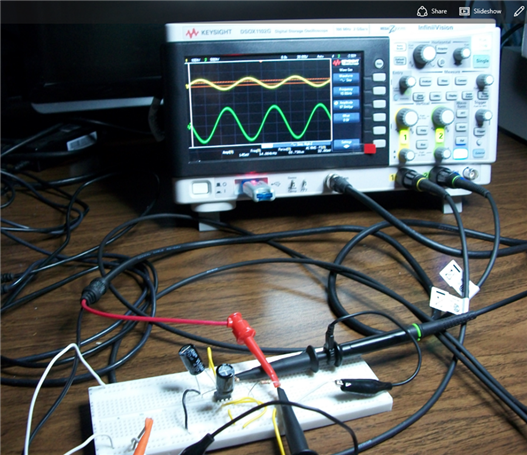
(a bit messy I would categorize it, but it functioned as expected)
Here is a picture showing the input and output signals in time domain:
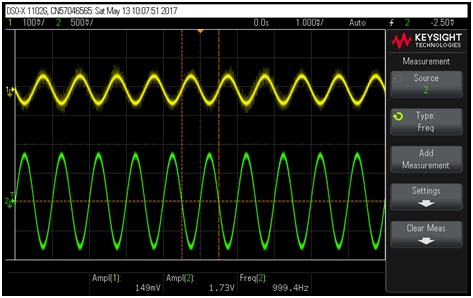
We can see that the output is inverted (or in other words 180 degrees shifted), and from the measured values shown at the bottom of the screen we can calculate the DC voltage gain as 1.73V/0.149V = 11.6.
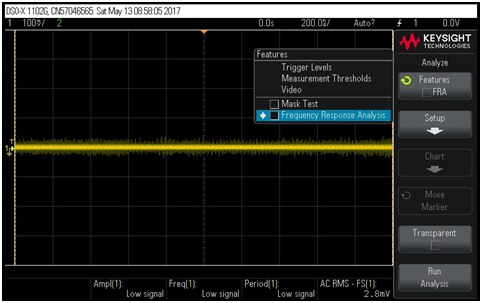
I than started to setup the frequency analysis function by pressing “Analyze” and selecting “Frequency Response Analysis”:
I was impressed that the DSOX1102GDSOX1102G oscilloscope showed me on the screen how to connect the function generator and the channels to the testbench
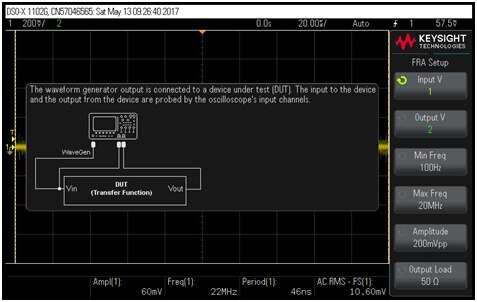
After connecting the two channels the way was shown in the diagram I pressed the“Run Analysis button on the side of the display and to my surprise the DSOX1102GDSOX1102G starting the frequency sweep and displayed in real time the measurements on the screen I captured this in a short video linked below:
The result was the gain and frequency variation with frequency for this amplifier, as shown in the following picture:
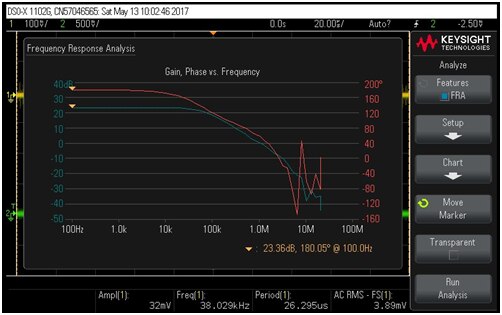
The important part looks good and as expected, with the gain dropping by 20dB per decade after the dominant pole. There is some noise at high frequencies primarily due to the inductive loop coupling in my solder-less breadboard amplifier. To confirm this assumption I have re-run the frequency analysis:
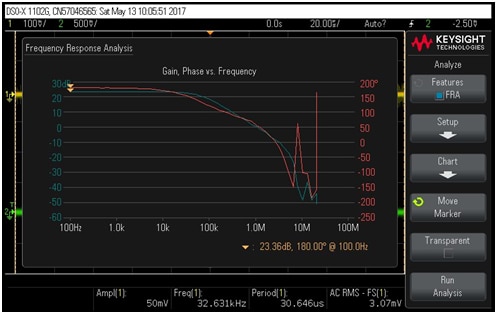
The significant region of the gain and phase remained the same, while the high frequency region of noise showed different behavior. This confirmed to me that the noisy behavior is due to noise and noise coupling in my breadboard circuit.
This frequency analysis feature is very useful for students in analog design classes I am thinking at some point in the future to expand the operational amplifier design project of my CMOS Analog IC Design course and add a hands-on lab where students can evaluate an operational amplifier I like the DSOX1102GDSOX1102G oscilloscope because it provides almost a“full lab equipment set in one instrument for students especially on-line students who don’t have access to school labs
This concludes the third and last part of my road test evaluation of the Keysight InfiniiVision DSOX1102GDSOX1102G oscilloscope I am very impressed of the measurement capabilities that Keysight has implemented in such a small size instrument. I will publish an official report for this road test review in the following days.
Best Wishes to Everyone,
Cosmin
Top Comments