


Measurements with ULINKplus debugger and EA LPC11U37H Board
MDK Ver 5 uses software packs to support a micro-controller device and to use middleware which are needed for Debugging using Event Recorder.
Steps to get the Event Recorder working if you are migrating from the MDK4 legacy code to KEIL MDK5
- Convert the compiled project from MDK4 to MDK5 from within the KEIL IDE.
- Download the correct software packs for your micro-controller from the Pack Installer.
- Later add the downloaded CMSIS and compiler packages from the software packs to your project.
- Setup the Event Recorder in the project.
- Get some beer and proceed as this road test will not end!!
- Add the event recorder code to your main code. Event recorder sample code.
- Then realize from ULINK: ULINKplus + Cortex-M0/M0+/M1/M23 support posted January 8, 2018 Power Measurement- and Test Automation-support is not integrated with MDK-ARM V5.25 pre-release, but planned for all Cortex-M devices with coming MDK-ARM versions. However - Clock frequency measurement will not be possible in a foreseeable future for Cortex-M0/M0+/M1/M23 due to the lack of DWT CYCCNT (CPU cycle counter) in these CPUs.
- Also find out that for Time Stamp Source: Specify the timer used as time base. Default is the DWT Cycle Counter that is part of the CoreSight debug interface. This counter is not available in Cortex-M0 and Cortex-M0+

A quick look into how the Event Recorder works in theory

Proceed ahead and record all the planned events in the code in the Event Recorder. Cross check the values in the Events recorder with the Call Stack
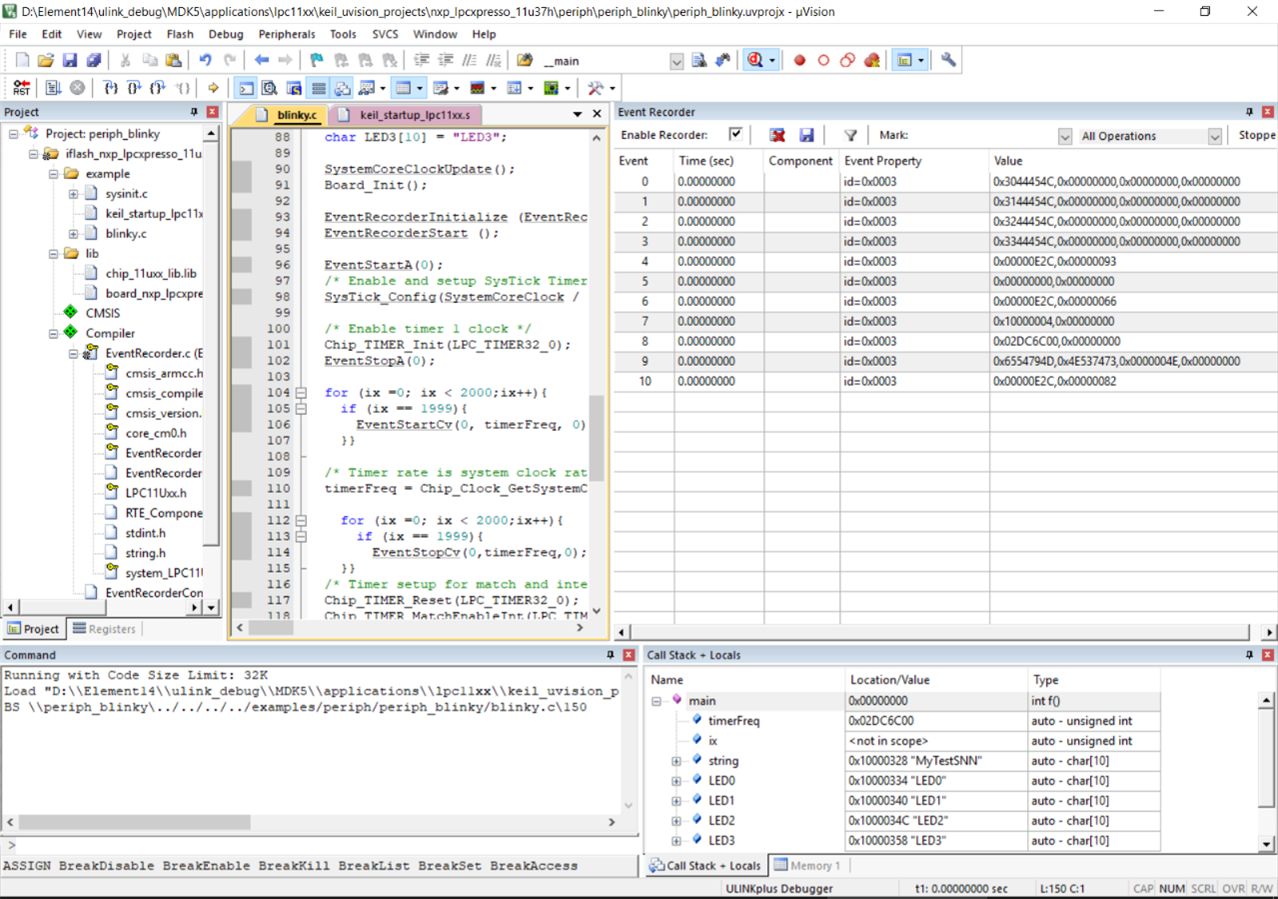
And done... Record all the planned events
An important point to note is to avoid conflicts between the startup files for the project. If you migrated the project from an already pre-complied code chances are that it already has a startup.s and startup.c file. Hence there is no need to add it from the Manage Runtime environment window else there will be a conflict.

Fig: Errors spotted in code with the Event Recorder
I also wanted to use the Event Recorder and Component Viewer for recording events for the Keil RTX5 where you can see the RTX5 RTOS Memory events, Kernel events, Semaphore events, Mutex events but this is only available with the MDK-ARM Plus or MDK-ARM Professional license.
Error #603: 'Keil.MDK-Plus::File System:CORE:LFN Debug:6.10.1': component requires valid MDK-ARM Plus or MDK-ARM Professional license

After some time spent with the Lite version I also evaluate the MDK ARM professional IDE for 7 days trial period. The Event Recorder test below is done using the ARM Cortex-M3 in uVision Simulator which I found to be quite a nice feature. Download Support for ARM Cortex-M0 in uVision Simulator
So even if you do not have the needed micro-controller board in hand one can test the working code in this Simulator. Help: Understanding the Event Recorder

Fig: MDK Professional License
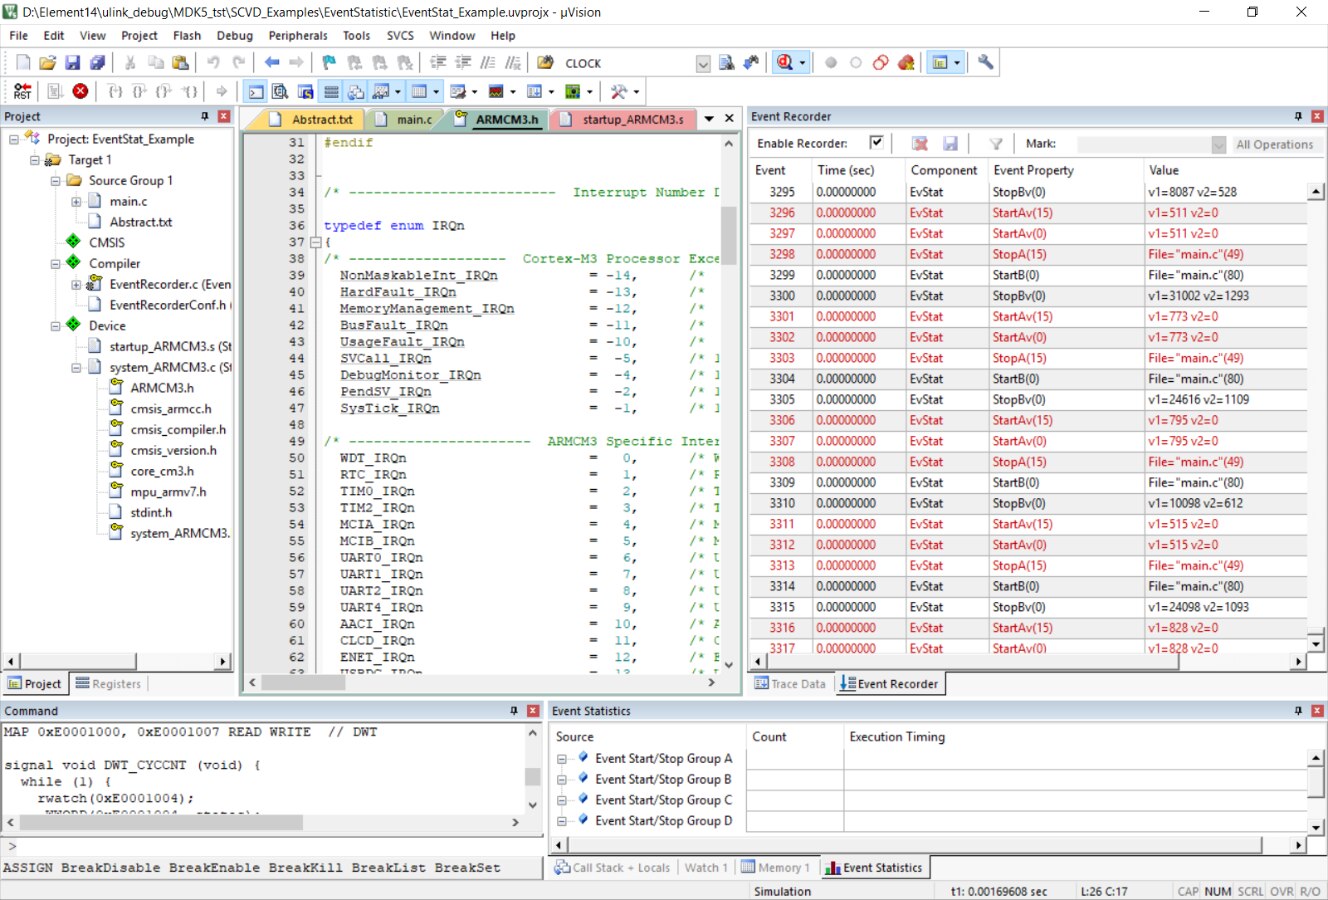
Fig: Recording Events with ARM Cortex-M3 in uVision Simulator
Debugging using SystemViewer Windows
SystemViewer Windows is quite a powerful debugging tool as it lets you see directly into the registers of the peripherals. One can monitor the changes in the register values in real time and look into anomalies directly at the register level to catch unforseen bugs. I have used this very often in other debuggers as well.
This ADC peripheral project was translated and re-compiled in the KEIL MDK5 version. Hence you can see the CMSIS in this project window.
Debugging using the Logic Analyzer
The Logic Analyzer is a tool where you can see the changes in variables or VTREGs. They can be user specific but are subject to some restrictions. It uses trace information from Cortex-M3, M4, M7 devices to display data when used together with a debugger. Ref: Cortex-M Trace Configuration
There are certain restrictions on debugging using Logic Analyzer. The Logic Analyzer cannot record CPU registers, I/O pins of communication peripherals such as UART, CAN, SPI Memory BUS signals, Automatic variables inside a function. The logic analyzer can record peripheral registers, VTREGs and upto 4 global program variables.
I used the Virtual Simulation Registers (VTREG) method. VTREGs uses the CPU's simulated pins for input and output. They give a way to specify signals coming into the CPU from a simulated piece of hardware. VTREGs are not public symbols nor do they reside in a memory space of the CPU. The utilization of VTREGs is CPU dependent. Use command DIR VTREG to find your CPU specific signals which can be used. I tested it for the Cortex M0 Core.

Fig: Virtual Simulation Registers (VTREG) for Cortex M0
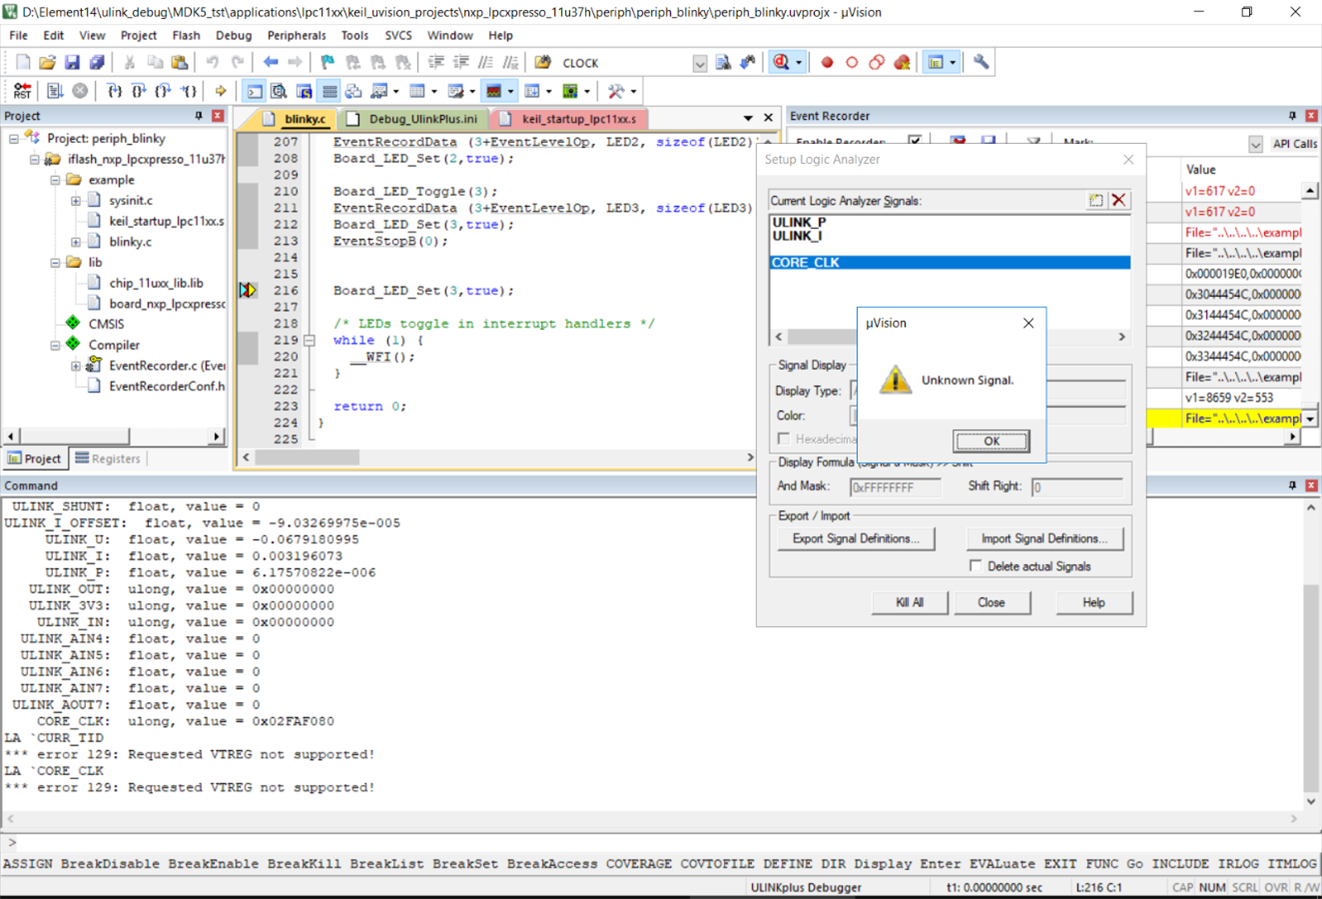
Fig: CORE_CLK Error in Logic Analyzer

Fig: Some success at measuring the ultra low power at the board
Debugging with System Analyzer in Cortex M0
As again; the clock measurement feature works only for Arm Cortex-M3, Cortex-M4, and Cortex-M7 devices and not for Cortex M0.

Fig: No clock Measurement can be seen here
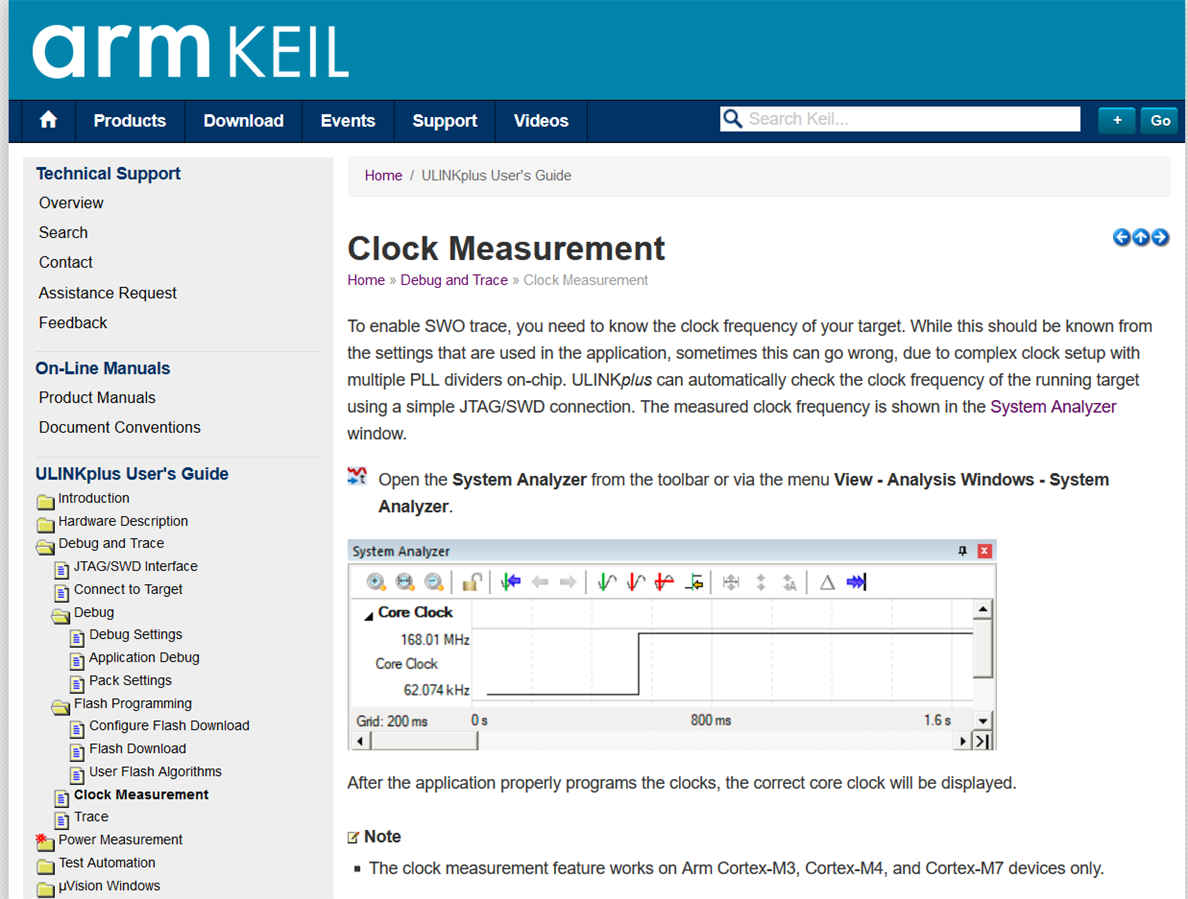
Fig: Again Not supported for Cortex M0 in System Analyzer
Similarly to the other test I also tested with CMSIS in the ARM Cortex-M3 in uVision Simulator.
Performance Analyzer in KEIL MDK Professional
Another cool feature that I tested with the KEIL MDK professional using the ARM Cortex-M3 in uVision Simulator was the performance analyzer. It shows statistics, like time and number of calls of a function or module during code execution.

Fig: Performance Analyzer Window Options Explained

Fig: Performance Analyzer in Real Time Execution

Fig: Performance Analyzer with CMSIS RTOS
Fig: Real Time Execution of Performance Analyzer
ITM and DWT trace debugging
ITM and DWT trace are also unsupported for the Cortex M0 devices. I just confirmed it today with the ARM Tech Support.

Fig: Unsupported Trace debugging
 ITM and DWT trace debugging are unavailable in MCB11U10MCB11U10 MCB1114MCB1114 or MCB11C14MCB11C14 boards because their MCUs do not provide the Serial Wire Output(SWO signal needed). As a result the Logic Analyzer and OS Event Viewer features of the debugger in real time are also not available because they too require the SWO signal. And none of the MCB1000 boards support a JTAG interface.
Power Measurements with ULINKplus debugger and EA LPC11U37H LPCXpresso Board
The ULINKplus adapter allows power measurements during execution as well as in non execution mode. So basically when the shunt is connected to the ulink plus debugger it acts as an Ammeter which is connected in series to the power pin which needs to be measured. For example if you want to measure the current consumption of the MPU connect one end to the MPU_PWR pin; GND on board; and other to the 3V3_PWR pin. And this current and voltage consumption can be seen in the System Analyzer. These measurements can be done during run-time or also only in debug mode without the SWD. For debug mode without the SWD is referred as the Debug — Energy Measurement without Debug
The power measurement setup. Reference
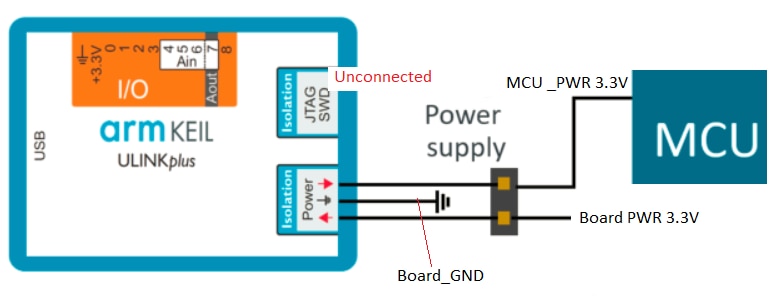
Fig: Setup for Power Measurement
- Next step is to configure the ULINKplus and KEIL MDK5 for power measurement.
- ULINKplus window configuration for the power measurement.
- Setting up the Debug_UlinkPlus.ini file and the proper configuration Wizard settings for the shunt used
- Do the offset calibration for current in the Energy measurement without debug mode

Fig: My simple set up for power measurements
Analyzing power consumption in System Analyzer window as seen below. In the System Analyzer window; the consumption part displays the voltage and current readings captured by ULINKplus.

Fig: Setting up the Debug_Ulink.ini Configuration wizard to chose the appropriate Shunt value

Fig: Power consumption measurements for the LPC11u37H CPU core
Since the ITM and DWT trace debugging are unavailable for Cortex M0 I could only do power measurements only in the debug mode and not the run-time mode
In short, Cortex M0 is not the best MCU to work with if one wants to explore the new features offered by the ARM ULINKplus. Although most of the features that I did want to explore for the device were successful but not to the complete extent.
Top Comments