


After getting the Ettus USRP B205mini-i working with SDR++ on the Raspberry Pi Compute Module 5, I wanted to investigate how the system behaves when pushing the receiver to higher bandwidths. In particular, I was interested in power consumption, CPU load and temperature, and whether the CM5 could maintain stable SDR operation when the processor was under heavy load.
For this test, I combined SDR++ with a CPU stress test and added some monitoring to keep track of what was happening inside the CM5.
Monitoring the CM5
To monitor the system during the experiments, I wrote a small Python script running on the CM5. It continuously reads three parameters:
- CPU utilisation
- CPU temperature
- Fan speed
The measurements are transmitted over MQTT to my home automation system. On the receiving side, I use Node-RED to collect the incoming data and display it in a dashboard. This allows me to monitor the CM5 remotely while running SDR++ and the stress tests.
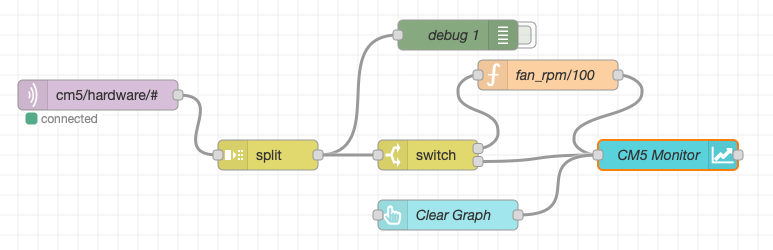
The Node-RED flow receiving the monitoring data from the CM5.
Note that the fan speed (rpm) is devided by 100, in order to be able to keep the range similar as cpu utilisation and temperature.
#!/usr/bin/env python3

import time
import json
import glob
import os
import paho.mqtt.client as mqtt

# MQTT configuration
#BROKER = "localhost"
BROKER = "remote.broker" # name or ip of your remote MQTT broker
PORT = 1883
TOPIC = "cm5/hardware"

INTERVAL = 5  # seconds

def read_cpu():
    with open("/proc/stat") as f:
        values = list(map(int, f.readline().split()[1:]))

    idle = values[3] + values[4]
    total = sum(values)

    return total, idle


def read_temperature():
    try:
        with open("/sys/class/thermal/thermal_zone0/temp") as f:
            return round(int(f.read()) / 1000, 1)
    except (OSError, ValueError):
        return None


def read_fan_speed():
    # Search for available hardware monitoring fan inputs
    for path in glob.glob("/sys/class/hwmon/hwmon*/fan*_input"):
        try:
            with open(path) as f:
                rpm = int(f.read().strip())
                return rpm
        except (OSError, ValueError):
            continue

    return None


def main():

    print("Connecting to MQTT broker:", BROKER)

    client = mqtt.Client()
    client.connect(BROKER, PORT, 60)
    client.loop_start()

    old_total, old_idle = read_cpu()

    print("CM5 monitoring started")

    try:
        while True:
            time.sleep(INTERVAL)

            new_total, new_idle = read_cpu()

            total_diff = new_total - old_total
            idle_diff = new_idle - old_idle

            if total_diff > 0:
                cpu_load = round(
                    100 * (total_diff - idle_diff) / total_diff, 1
                )
            else:
                cpu_load = 0.0

            old_total, old_idle = new_total, new_idle

            temperature = read_temperature()
            fan_rpm = read_fan_speed()

            data = {
                "cpu_load": cpu_load,
                "cpu_temp": temperature,
                "fan_rpm": fan_rpm
            }

            payload = json.dumps(data)

            if client.is_connected():
                client.publish(TOPIC, payload, qos=0)

            print(payload)

    except KeyboardInterrupt:
        print("\nMonitoring stopped")

    finally:
        client.loop_stop()
        client.disconnect()


if __name__ == "__main__":
    main()
The Python monitoring script running on the CM5. CPU utilisation, temperature and fan speed are periodically published over MQTT.
This setup proved quite useful during the tests, as I could observe the system behaviour without having to switch away from SDR++.
Power consumption measurements
For measuring the input power, I used a Ruideng UM25C USB power tester connected between the power supply and the CM5. I did not automate the power measurements or read them out electronically; instead, I simply observed the readings on the tester's display.
Before starting with SDR++, I first measured the power consumption with the system running normally. The idle consumption was approximately 5.2 W.
CPU stress test
As a baseline for the processor's maximum load, I first ran a CPU stress test using stress-ng:
stress-ng --cpu 0 --cpu-method fftThis command starts CPU workers on all available processor cores and uses FFT calculations as the workload.
During this test, the input power increased to approximately 9 W.
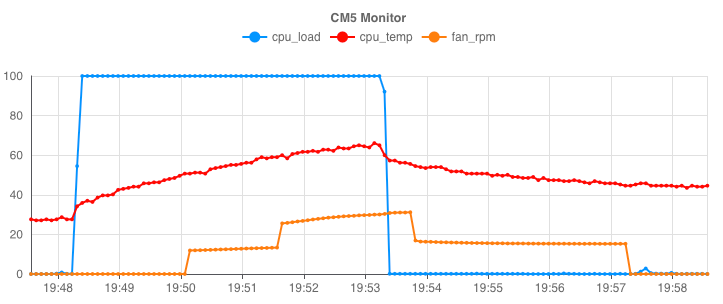
Monitoring results during the CPU stress test. The increase in CPU load, temperature and fan activity can be followed in Node-RED.
This provides a useful reference point for the subsequent SDR++ tests. It also gives an indication of the power required when all CPU cores are heavily occupied.
SDR++ bandwidth tests
Next, I started SDR++ with the Ettus USRP B205mini-i and measured the power consumption at different receiver bandwidth settings.
I used four bandwidth settings: 2, 4, 8 and 16 MHz. For each setting, I observed the input power on the UM25C.
The results are summarised below.
| SDR++ configuration | Input power |
|---|---|
| SDR++ off (idle system) | 5.2 W |
| SDR++ - 2 MHz BW | 6.6 W |
| SDR++ - 4 MHz BW | 6.8 W |
| SDR++ - 8 MHz BW | 7.5 W |
| SDR++ - 16 MHz BW | 8.5 W |
The measurements show a clear increase in power consumption as the receiver bandwidth increases. At 16 MHz, the system consumes approximately 8.5 W, which is already quite close to the 9 W measured during the CPU stress test.
This is not particularly surprising: processing a wider bandwidth requires more data to be transferred from the USRP and processed by the CM5. The additional processing load is reflected in the power consumption.
CPU load, temperature and fan speed during SDR++ operation
Besides measuring the power consumption, I also monitored CPU utilisation, temperature and fan speed at the different SDR++ bandwidth settings. The measurements were collected using the Python monitoring script and displayed in Node-RED.
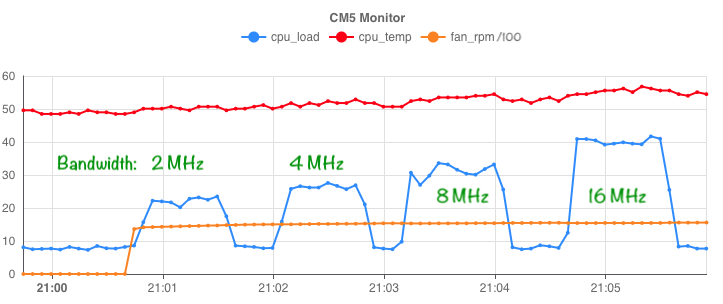
CPU utilisation, temperature and fan speed at 2, 4, 8 and 16 MHz SDR++ bandwidth.
The graph provides a useful insight into how the CM5 responds to the increasing processing requirements. It also shows how the cooling system responds to the additional thermal load.
Combining SDR++ with a CPU stress test
The most interesting part of the experiment was combining the two workloads.
With SDR++ running at 16 MHz bandwidth, I started the same stress-ng CPU test in parallel. This puts the processor under considerable load while it is also handling the incoming USRP data and performing the SDR signal processing.
Under these conditions, the SDR++ audio output became disturbed. The receiver was no longer able to maintain uninterrupted audio which also could be observed in the waterfall.
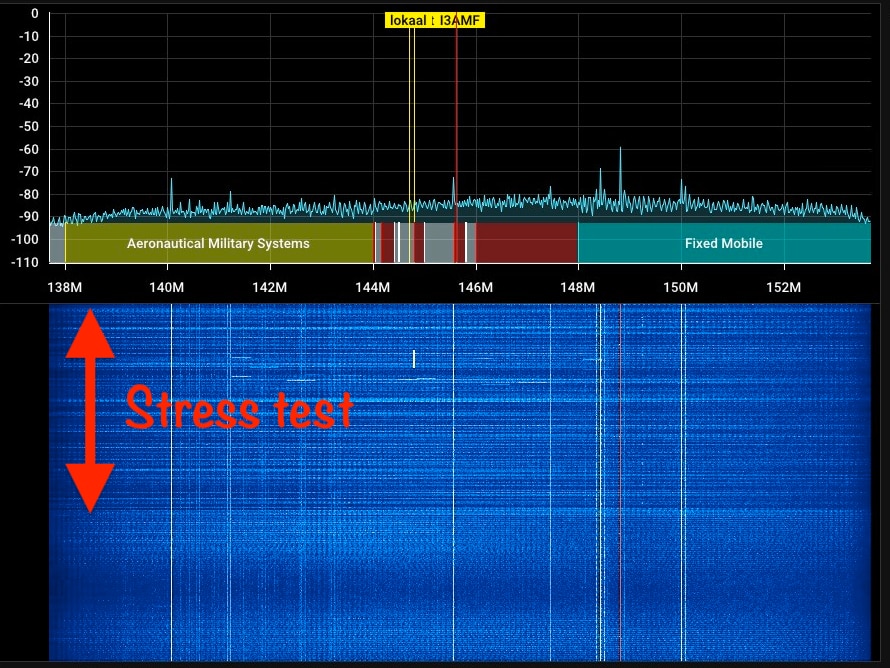
SDR++ waterfall display during the combined bandwidth and CPU stress test. The receiver was operating at 16 MHz while stress-ng was running in the background.
This indicates that the available processing capacity is not sufficient to maintain completely smooth SDR operation when both workloads are running simultaneously.
It is worth pointing out that this is a deliberately demanding test. In normal operation, SDR++ would not usually compete with a CPU stress test consuming all available processor resources. Nevertheless, it gives a useful indication of the limits of the platform.
A note about the USB-C power supply
One additional observation concerns the power supply.
I am using the newer official Raspberry Pi 27W USB-C power supply. Apart from its 5.1 V output at up to 5 A, it also supports USB Power Delivery profiles of 9 V, 12 V and 15 V.
However, throughout my experiments, the CM5 operates at 5 V, even when the power consumption approaches 9 W.
This raises an interesting question: will a future Raspberry Pi Compute Module ever make use of the higher USB-C Power Delivery voltages, or will the 5 V architecture remain the standard?
The higher voltage profiles are useful for other USB-PD-compatible devices, but the current Raspberry Pi 5 and CM5 platforms do not request them. The CM5 IO Board is designed for 5 V operation, with a supply capability of up to 5 A.
There is also an interesting technical document from Raspberry Pi specifically discussing USB Power Delivery on the Raspberry Pi 5:
- USB Power Delivery on Raspberry Pi 5 - technical whitepaper
- Raspberry Pi 27W USB-C Power Supply specifications
For now, the additional voltage profiles remain unused by my CM5 setup. The important specification for this application is the ability to deliver a stable 5 V supply with sufficient current.
Bottom line
The bandwidth stress test shows that the Raspberry Pi CM5 is quite capable of running SDR++ with the Ettus USRP B205mini-i, even at a bandwidth of 16 MHz.
Power consumption increases from approximately 5.2 W with SDR++ switched off to 8.5 W at 16 MHz bandwidth. A full CPU stress test brings this to approximately 9 W.
When combining the maximum SDR++ bandwidth with a simultaneous CPU stress test, audio disturbances become noticeable. This suggests that the system is approaching its processing limits under these deliberately demanding conditions.
The MQTT monitoring setup also proved valuable. Being able to observe CPU utilisation, temperature and fan speed remotely through Node-RED provides a convenient way to assess the behaviour of the CM5 during extended tests.
Overall, the CM5 makes a very capable compact SDR platform, but as with any embedded system, there are limits when several demanding tasks compete for processing resources.
