

Introduction
In common with an increasing number of oscilloscopes the MXO4 series offers the option of a built-in signal generator and software to allow it to operate as a Frequency Response Analyser.
In the case of the MXO4 the FRA and signal generator and FRA are paid for options (MXO4-B6 and MXO4-K36), available at £1311.00 and £1873.00 respectively. (Or you can have them as part of the MXO4-PK1 option bundle at £5618.00.)
The specification for the FRA option is sparse:
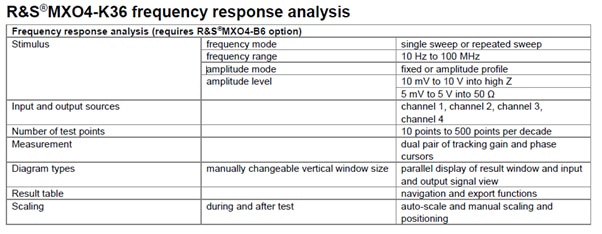
Operation of the features has its own chapter in the User Manual and gets 18 pages. It functions as part of the scope and can be remotely controlled via SCPI commands which are documented in a further 13 pages of the User Manual.
The complete description of the option in the manual is:
The frequency response analysis (FRA) option lets you perform low-frequency
response analysis on your oscilloscope. It characterizes the frequency response of a
variety of electronic devices, including passive filters and amplifier circuits. For
switched-mode power supplies, it measures the control loop response (CLR) and
power supply rejection ratio (PSRR).
The FRA option uses the oscilloscope’s built-in waveform generator to create stimulus
signals ranging from 10 Hz to 100 MHz. Measuring the ratio of the stimulus signal and
the output signal of the DUT at each test frequency, the oscilloscope plots gain and
phase logarithmically.
Having both time and frequency domain views allows you to monitor if the injected signal
causes distortion that leads to errors in the measurement.
I could find very little application data for the MXO4 on the web. There is a very general purpose R&S app note about measuring PSRR on their web site (https://www.rohde-schwarz.com/us/applications/power-supply-rejection-ratio-measurement-psrr-application-card_56279-601516.html)
It does suggest using 1:1 ratio passive probes, which got me thinking about combining some probe investigation with looking at the FRA.
The FRA works up to 100MHz which is plenty high enough for probe and cable problems as we shall see.
A Loopback Test of the FRA
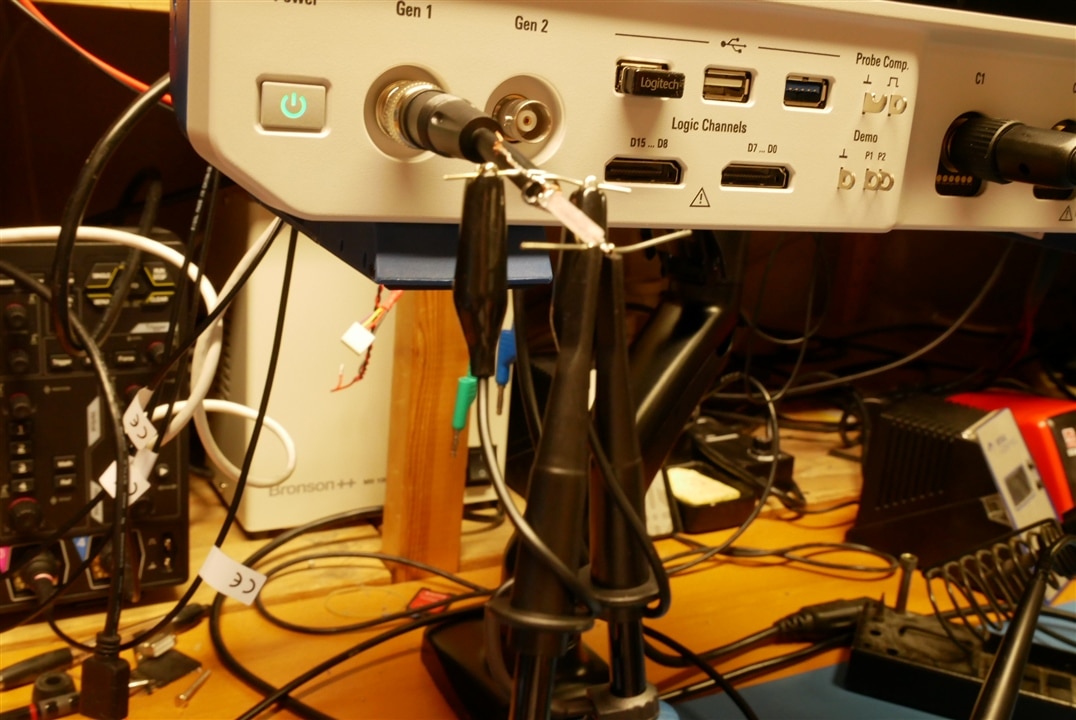
First off I linked the generator output to a T connector via a short BNC cable and each arm of the T to C1 and C2 on the scope using the same length (about 30cm) BNC cable.
Symmetrical BNC cable loopback, 50R terminations
Symmetrical BNC cable loopback, 1M terminations

These are reasonable plots showing less than 0.05dB error in either case.
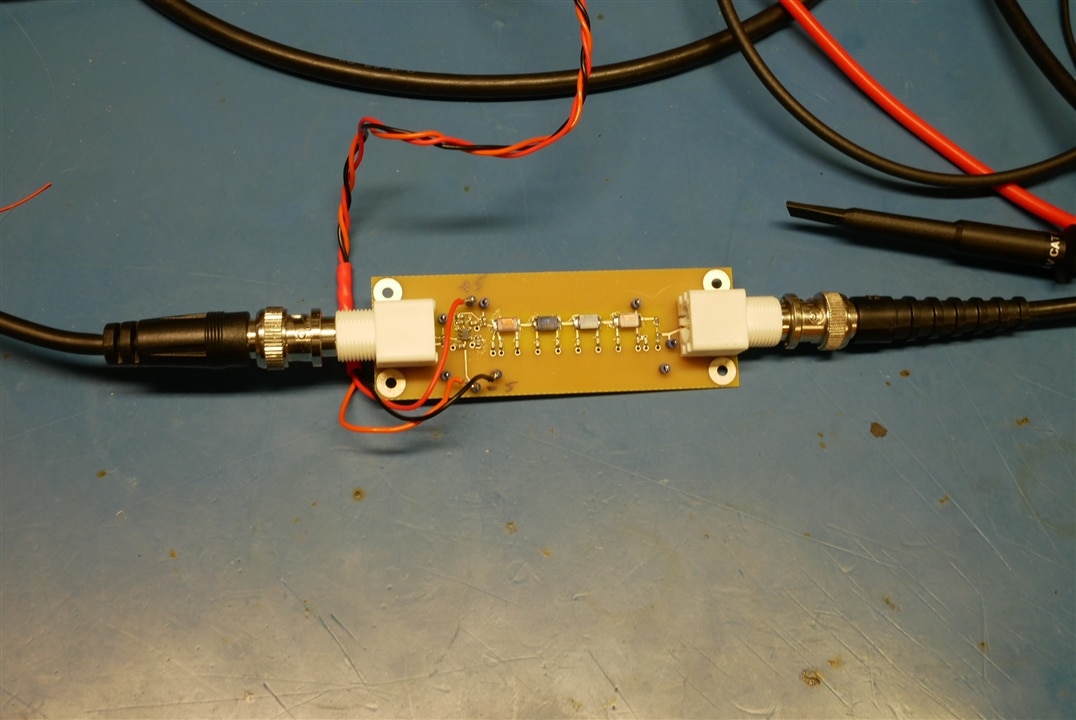
Then I connected the two measuring channels using the supplied R&S 500MHz 10:1 passive probes. They were connected to the generator using a short stub of co-ax cable:
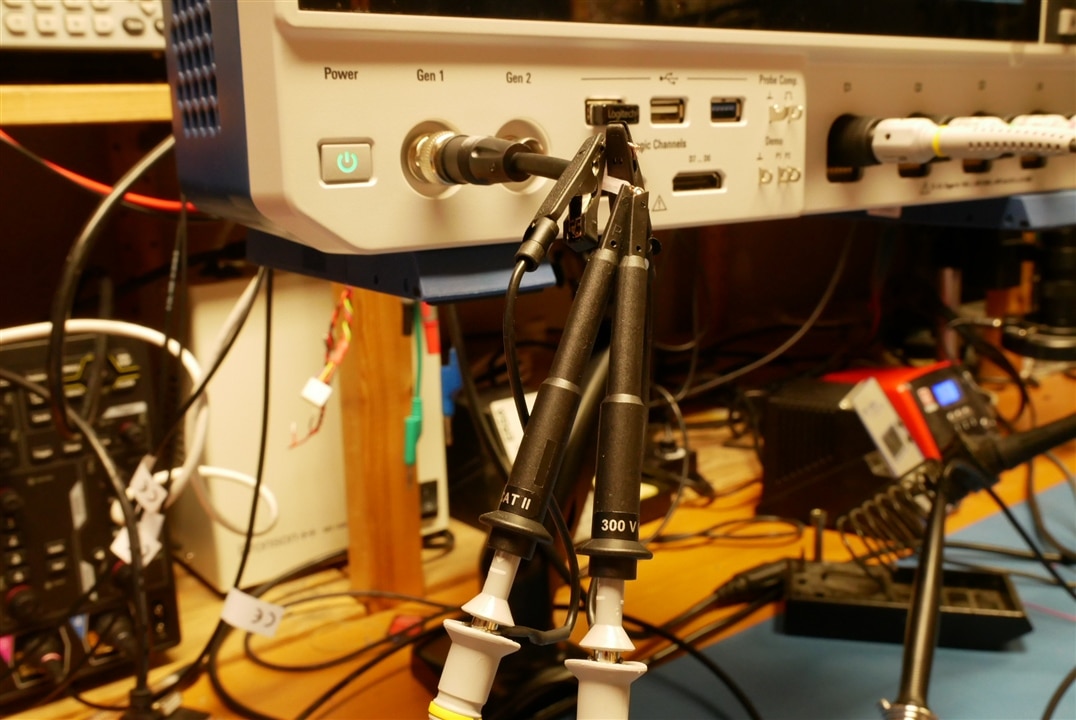
The resulting plot was not so nice, the precise arrangement of the earth leads making a significant difference. I changed the design of the co-ax stub to improve its symmetry:
R&S probes with symmetrical co-ax stub:
The probing error is quite significant. As delivered the probes were adjusted to this level. I tried adjusting them (using the usual square wave cal procedure with the built in cal generator) and couldn’t get them back to this good a match without doing the pair simultaneously - a point to note!
Scope manufacturers' probes are often very expensive, and from these results its quite clear that a 500MHz probe just hooked up casually (as in this experiment) isn’t going to be great at 100MHz.
So I usually use much cheaper switchable probes unless I really need a good one. That way it’s much less irksome when I fry the tip with a soldering iron or break a tip off. (I’ve done both, and more than once. The more forgivable tip frying being achieved by unexpected heating of the test object.)
My favourite low cost probes are the Pico 200MHz TA386, available from Farnell at £33 each. They are not as compact as a high spec probe but perfectly usable.
Pico TA386 probes x10 setting
Pico TA386 probes x1 setting
These are very reasonable plots, note the low frequency step of about 0.03dB where I haven’t tuned the probe very well. I’m not that bothered.
Every no and then one leaves one’s brain at home and gets to thinking that because one probe has a connected ground lead then it isn’t worth bothering with the earth lead on the others.
Pico TA386 with one probe earth lead not connected

A 17dB error tells you that you need both !!
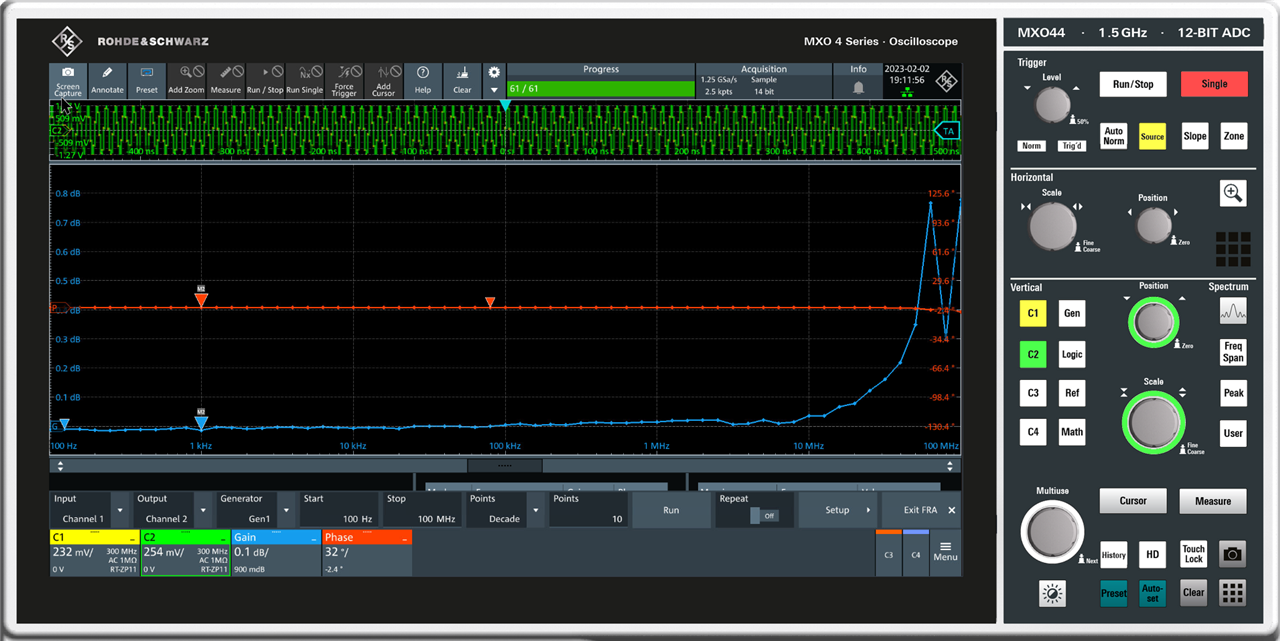
LC filter response
Loopbacks are all very well and the insights to probing quite interesting but what we really want is to measure a real filter. This is an anti-alias filter for a data acquisition system. Its designed as a 220R impedance to reduce internal power consumption so there is an insertion loss when it’s padded to 50R operation.
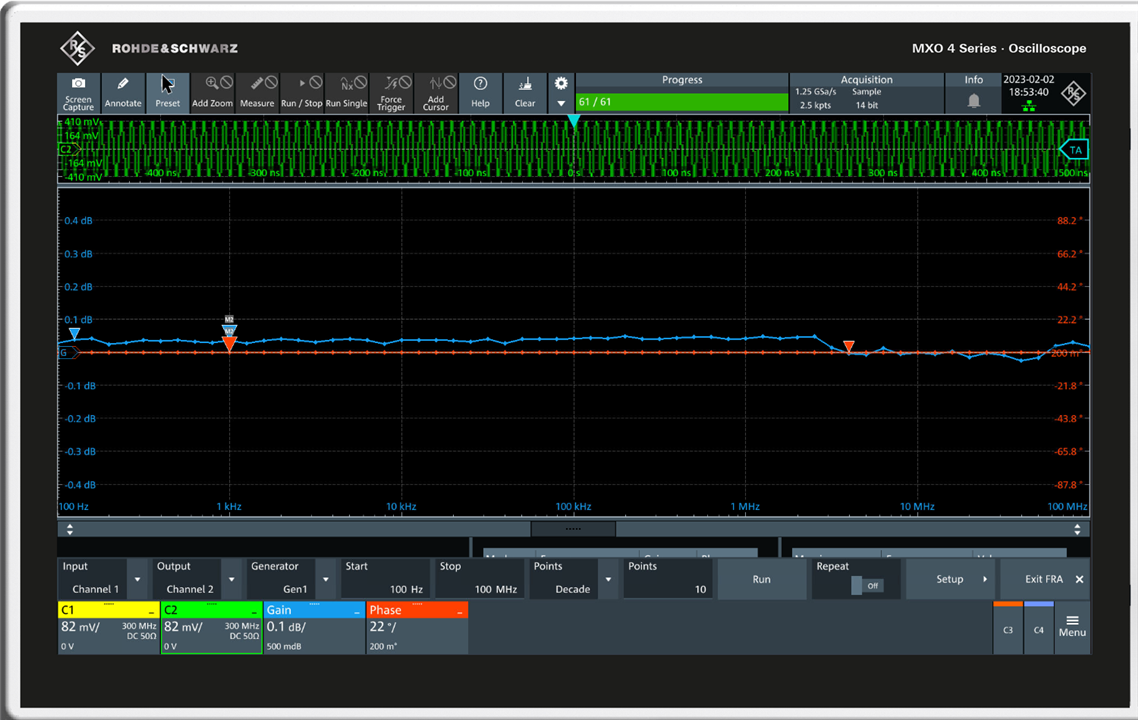
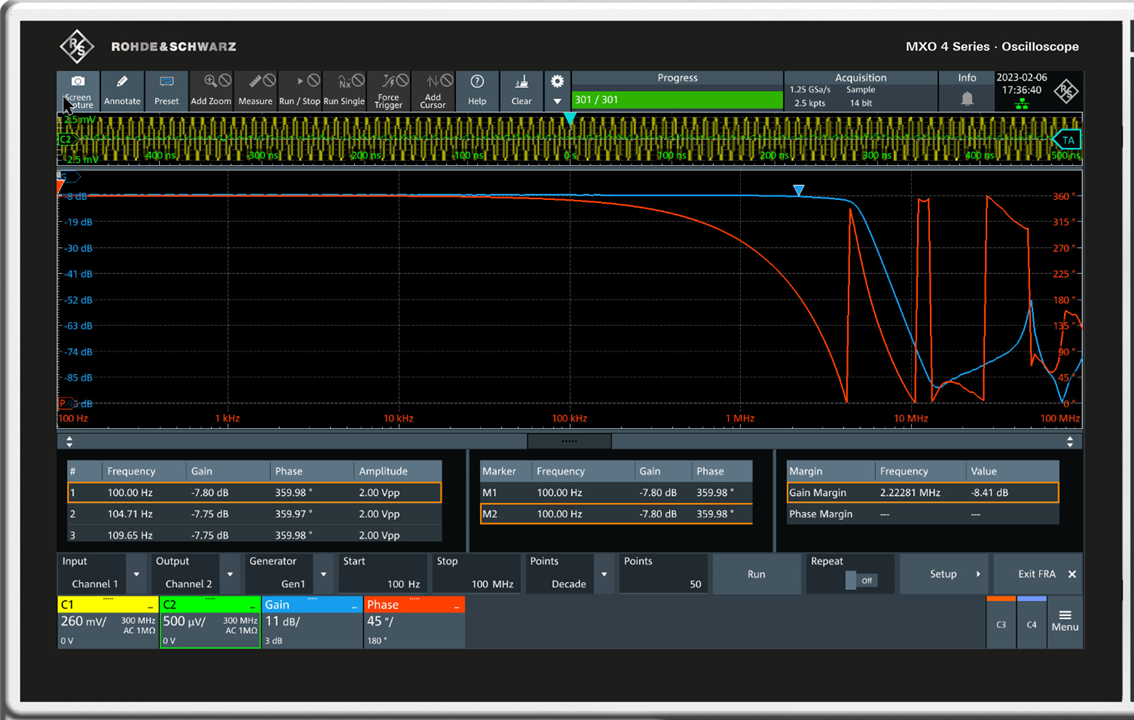
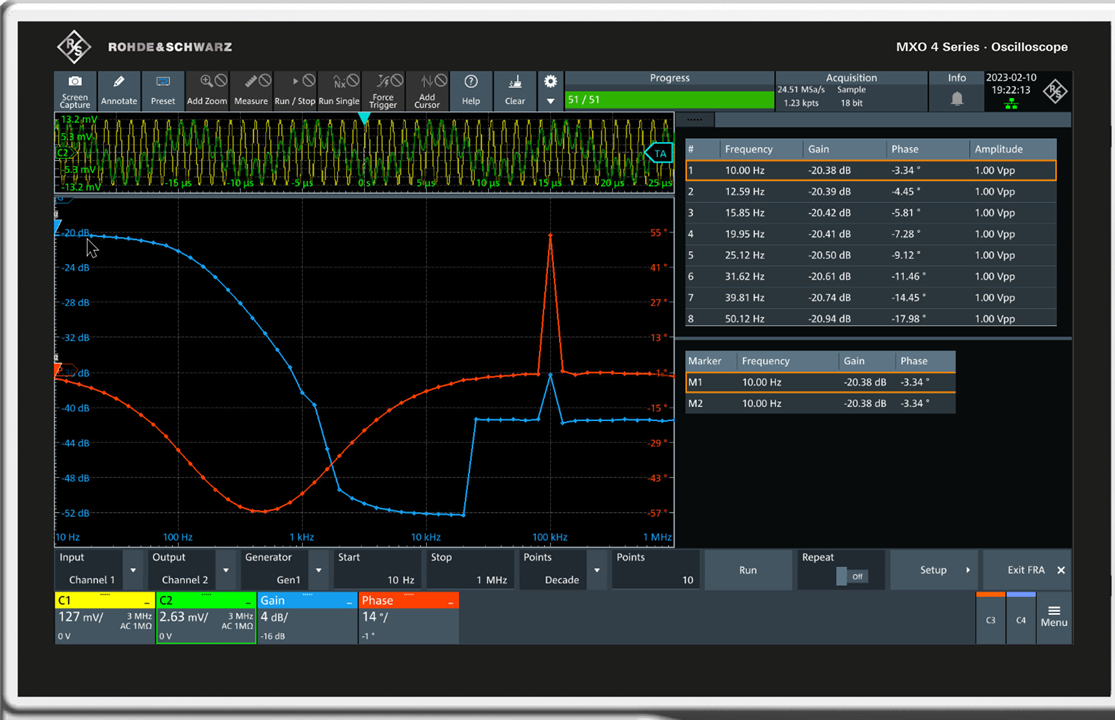
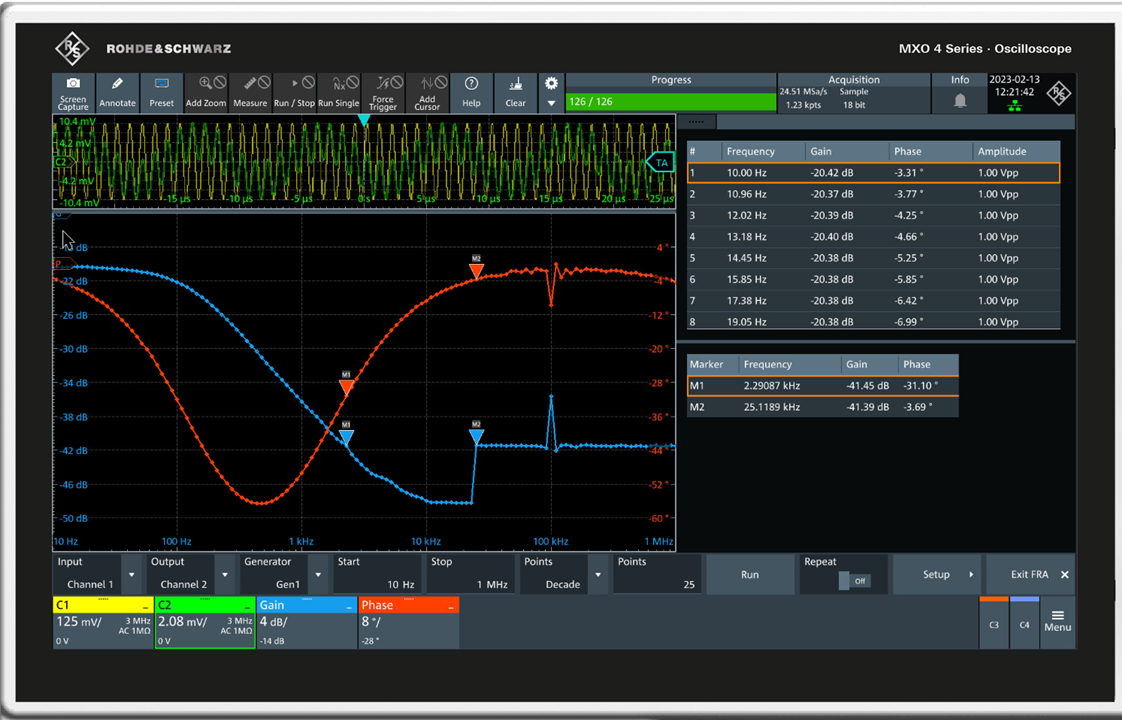
In this plot I’m letting the MXO4 data show up and the markers have been set to sensible places.
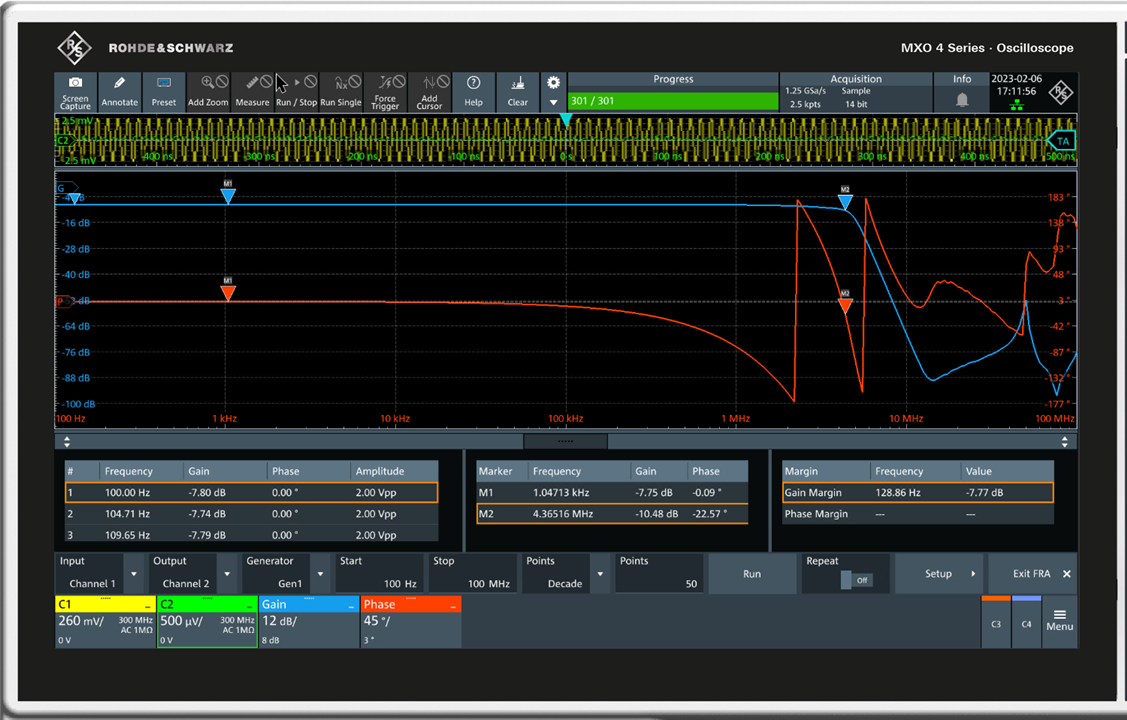
It’s not a bad filter up to 20MHz or so but that nasty peak at about 80MHz needs work !
A bug ?
There is a bug in the FRA that affects the use of markers.
In many views on the MXO4 you can click on a box containing text like this one from the screen shot above:
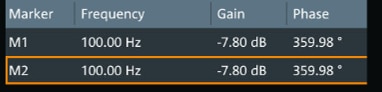
And the multipurpose control will change colour to indicate that it can alter the selected item. The control knob lights up OK when you click on the marker box but it has no effect on the marker position. If you click on the actual marker in the graph with the mouse (or by finger touch) then the multipurpose control becomes operational.
This is a real nuisance because the markers can easily move to the extreme right or left of the graph window when you change a setting. When they are at an edge it is almost impossible to select them by mouse or touch because other things get selected instead
I didn’t like the scaling much and I certainly don’t like the phase zig zags . I tried to improve matters using the FRA set up controls.
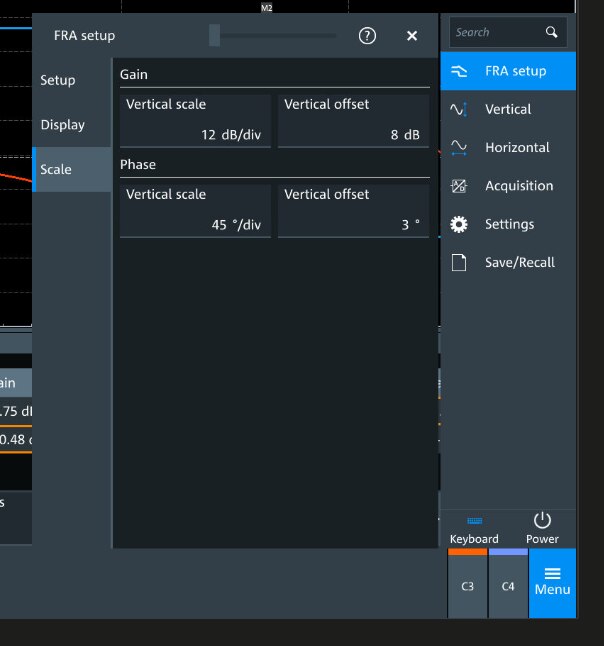
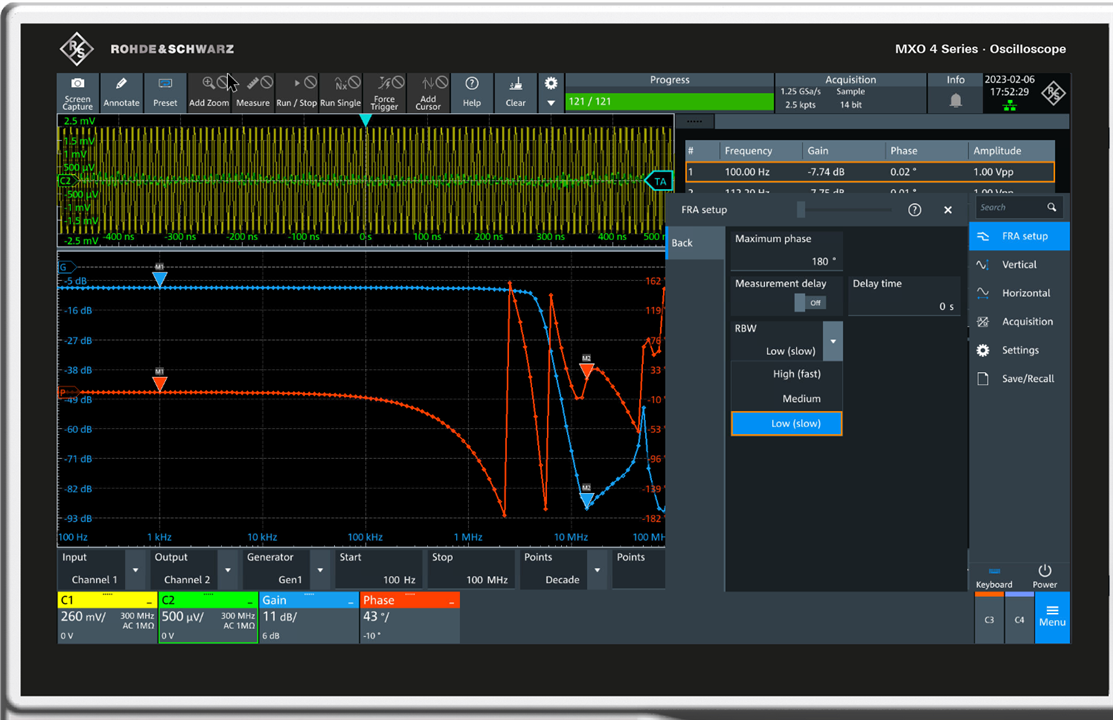
The picture of this window in the manual (version3, latest known) is different:
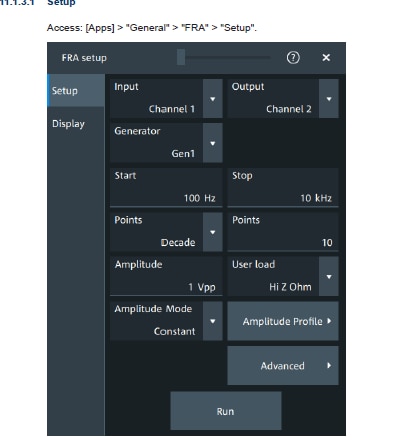
I couldn’t find a scaling option for phase that I liked.
You can use the R&S “smart screen” to re-position the sub windows on the screen.
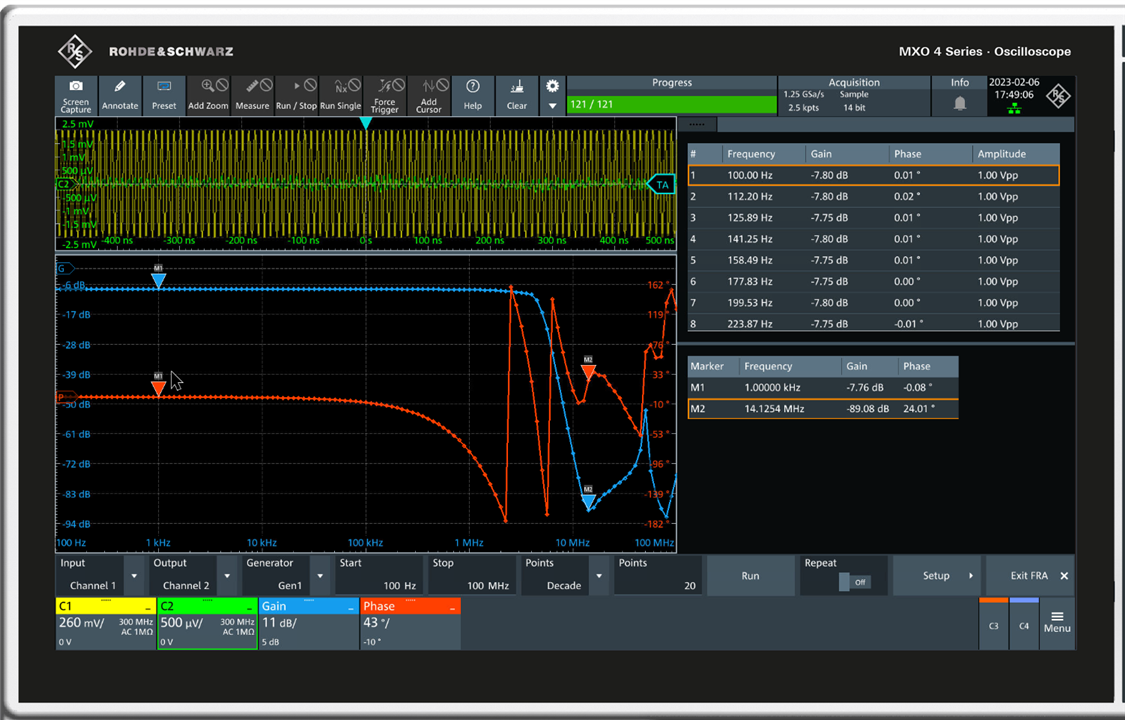
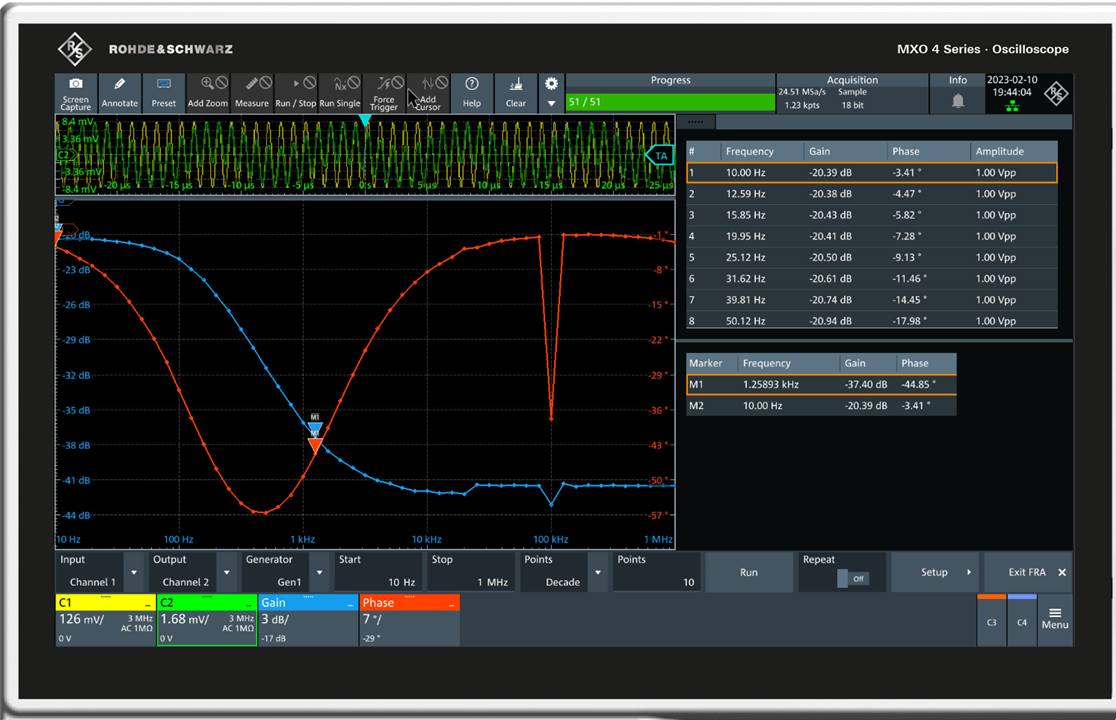
I’ve set the markers to allow me to measure the depth of the filter minimum. It would be nice to get a display of the difference between markers and/or to be able to set a marker as the amplitude reference point but there doesn’t seem to be a way of doing this.
I had another go at tweaking the phase display and found the RBW control. This sets the measurement bandwidth. The manual doesn’t say much:
RBW
Sets the resolution bandwidth.
Remote command:
FRANalysis:MEASurement:RBW on page 518
Well, at least it tells us what RBW stand for!
What it doesn’t say is what the bandwidth is actually set to, other than Low, Medium or High.
A Noisy Wein Bridge Filter
I’m interested in attempting to make a lower distortion replica of my HP654A signal generator. So I’ve been collecting multi gang air spaced rotary variable capacitors to make the required Wein bridge oscillator.
There’s plenty of stuff about them on the web if you want all the gory details.
The basic circuit is:
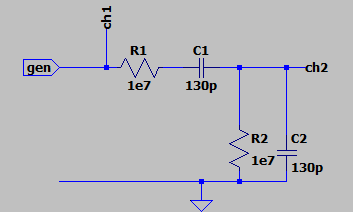
A standard multi gang variable capacitor has all the sections commoned on one side to ground. This is a pity because that means that the centre of my bridge (at ch2) is the chassis of the capacitor and it’s going to be very sensitive to picking up mains hum. The values on the diagram will oscillate at about 120Hz.
If a 10M scope probe is used at CH2 then R2 is omitted and the probe resistance forms part of the filter.
The built circuit looks like this:
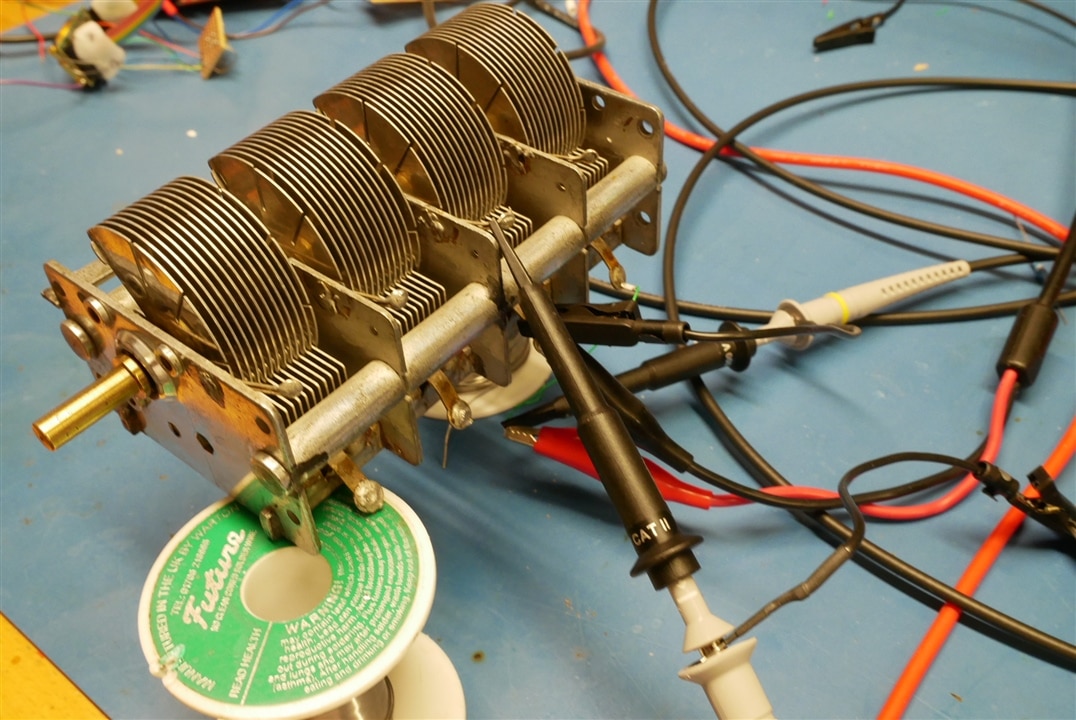
The 10M resistor is just visible (attached to a green wire) at the far end of the capacitor.
We expect this to be noisy but hope that the filtering on the FRA will sort things out.
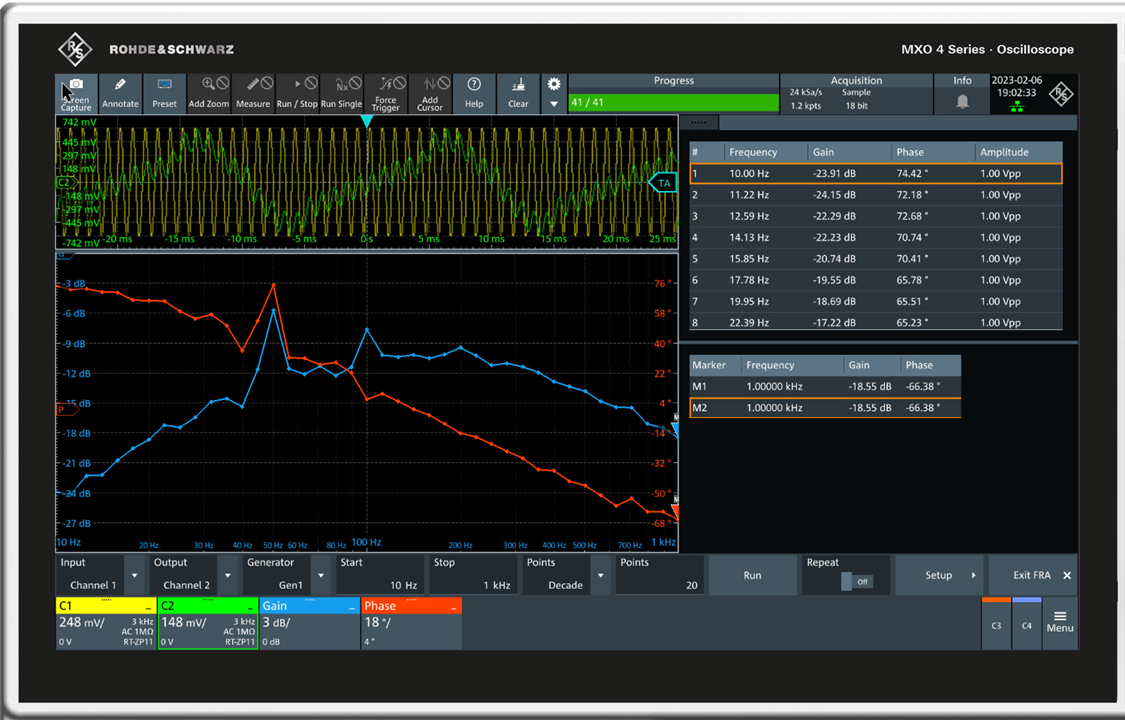
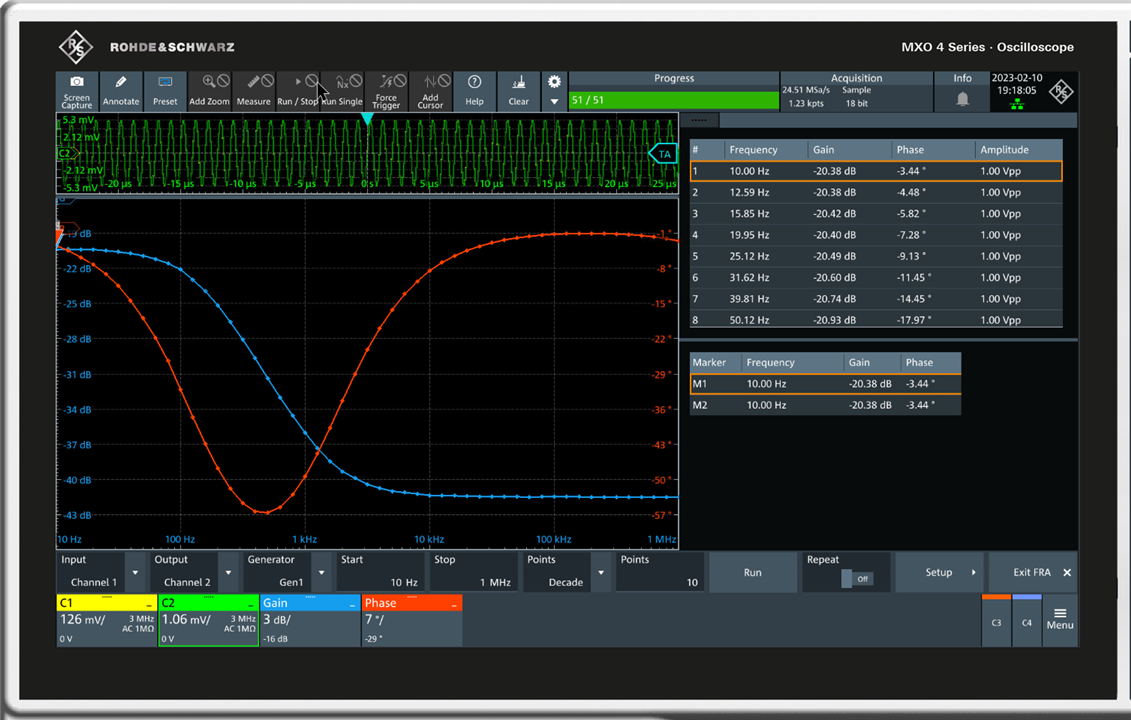
The shape of the filter is visible but it does look rather horrible.
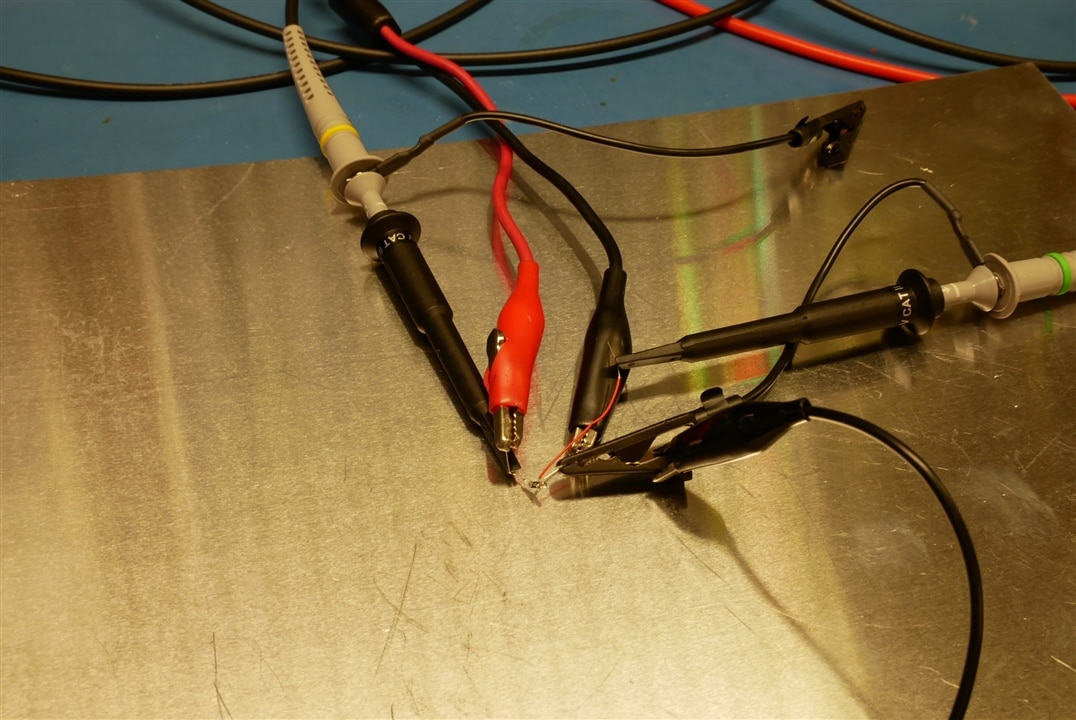
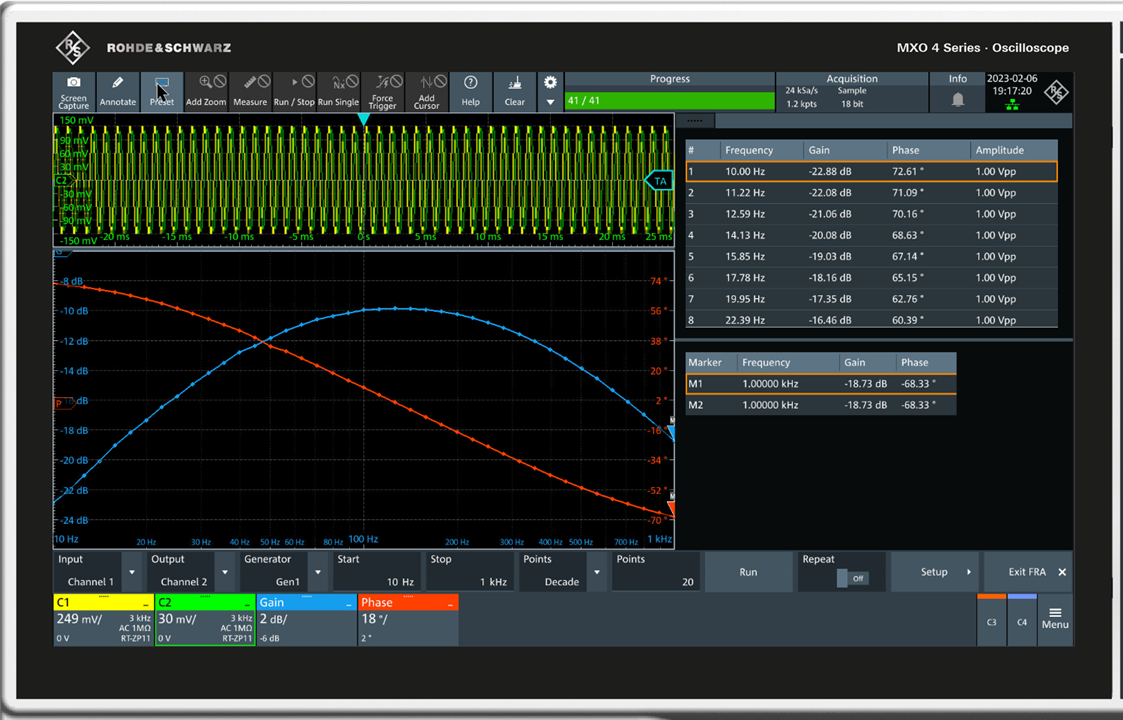
I made a new filter using fixed components and screened it on a metal plate.
This looks a lot better.
Susceptibility of FRA to noise signals
I wasn’t entirely happy that I’d got to the heart of how good the filtering of the FRA is so I decided to build a much better test rig to investigate.
It looks like this inside:
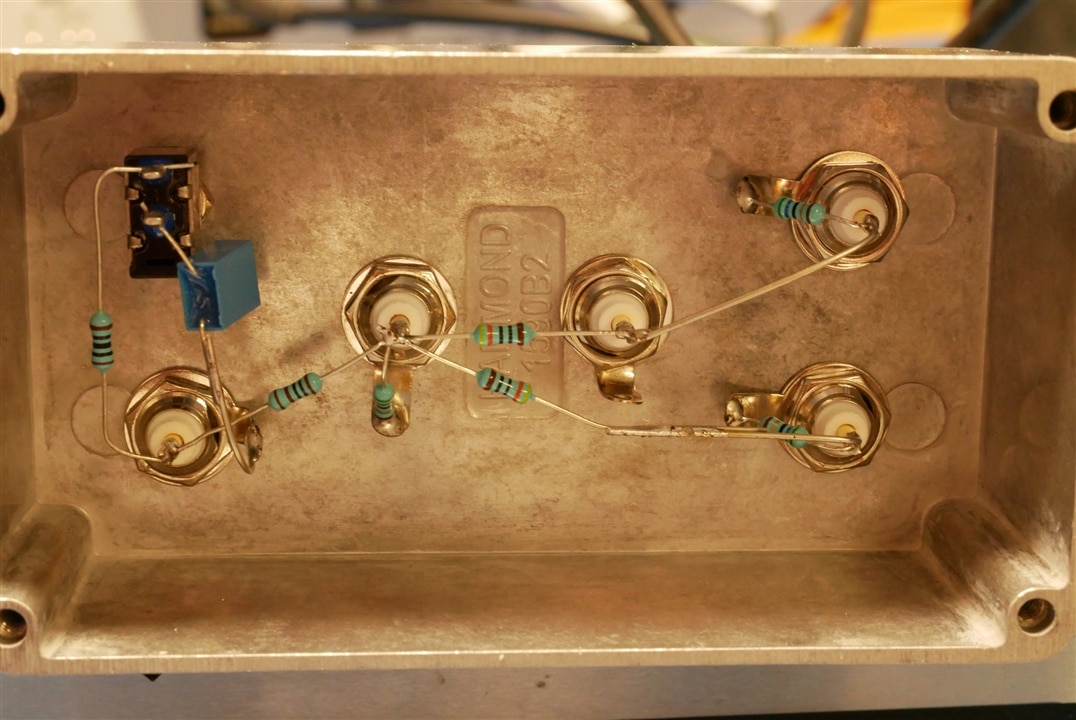
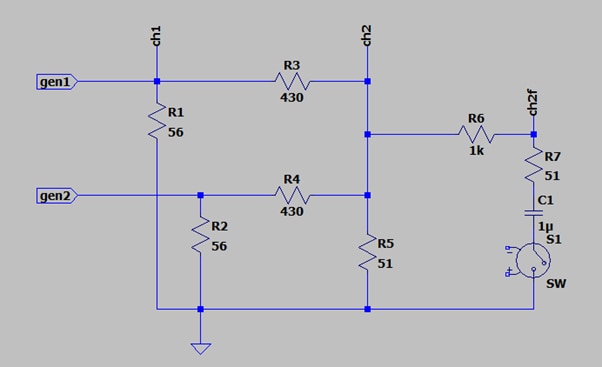
The FRA signal goes in at gen1. An interfering signal goes in at gen2. R3 and R4 with R4 attenuate the signal by about 20dB. An impedance of close to 50 ohms is presented to the generators and the amount of cross drive is reduced by R3 and R4.
The output can be taken from ch2 with S1 open or ch2f with S1 closed. (S1 is actually a toggle switch).
When there is no interfering signal gen2 input must be terminated by 50R so that amplitude comparisons are valid.
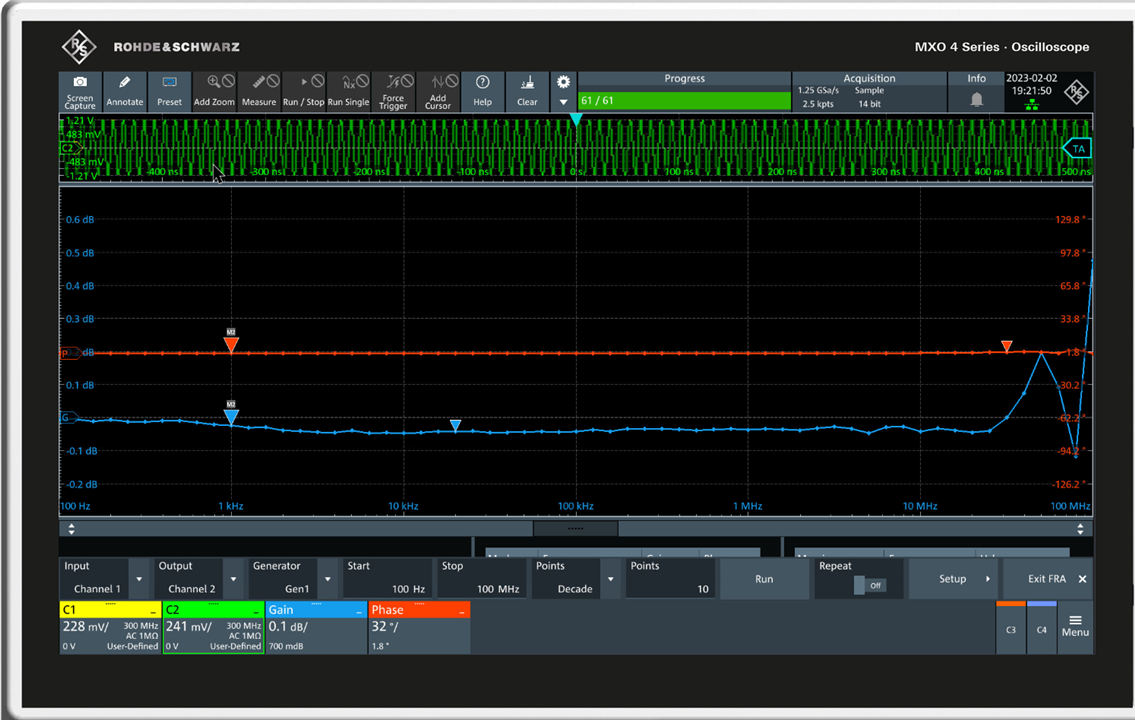
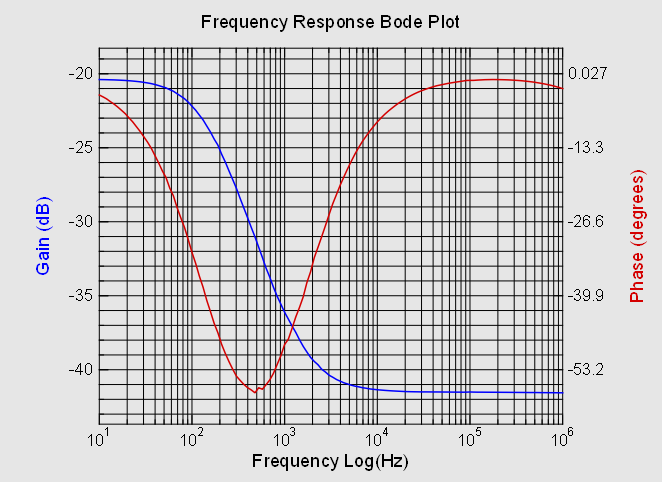
The basic response at ch2, S1 open is:
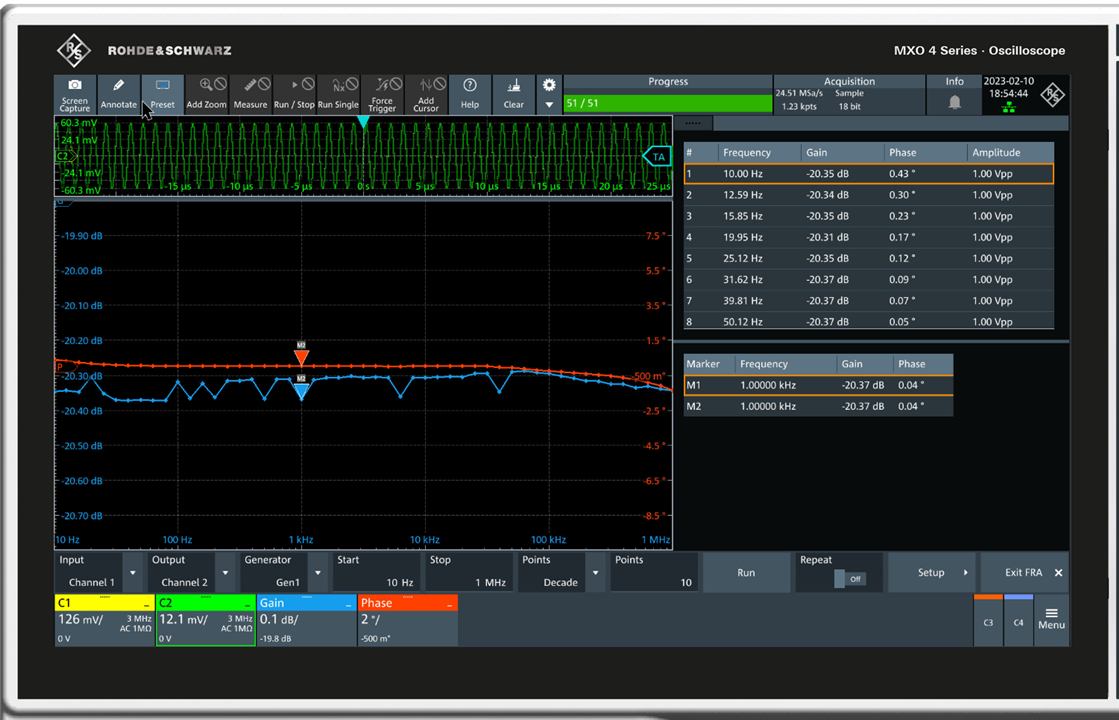
I would be happier not to see those 0.05dB quantised jumps – it’s not that they are wrong – just that they look like some internal numerical rounding not done quite right.
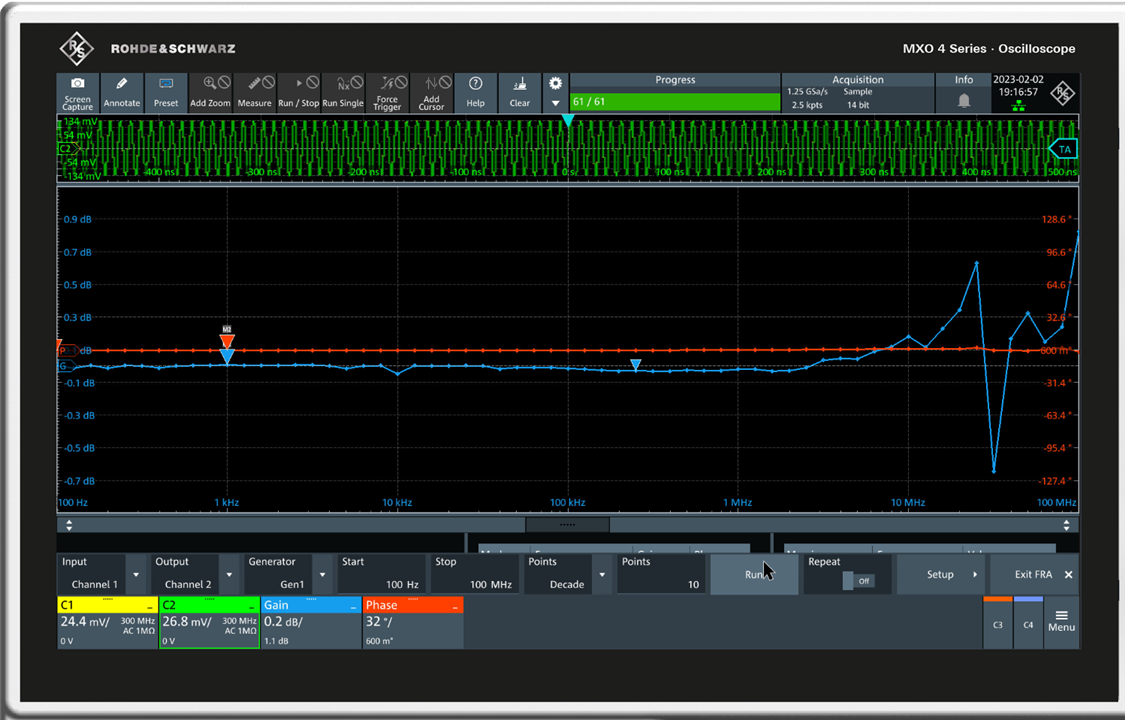
Next we inject 1Vpp of interference (same level as the scope generator signal) at 1kHz.

The error at the interfering frequency is inevitable and harmless – but why do we get 7dB of error at 1MHz ? This is with a the RBW set to low.
Now with the filter switched to on and using the ch2f port, no interference.
Everything looks just as it should.
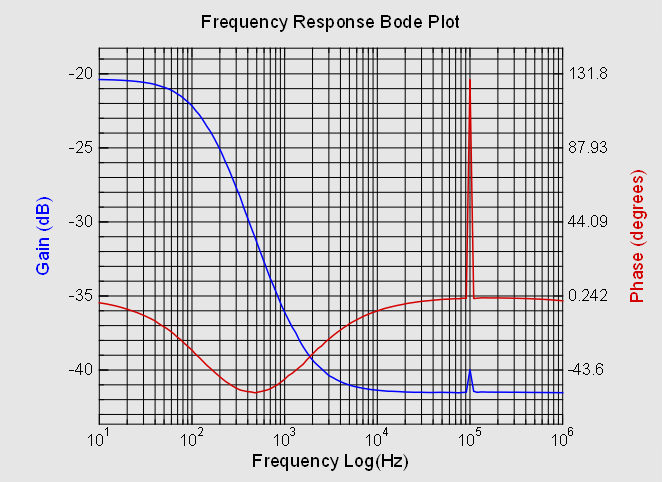
So, let’s try interference at a higher frequency of 100kHz, 1Vpp same as the scope generator.
Eeek ! Not what we expected.
If we scale down the interference amplitude to 100mV pp.
This is unexpected.
You could argue that an interfering signal of amplitude equal to the stimulus signal is a bit extreme (although stand alone FRAs can often cope with signal to noise ratios of -60dB or more ( and I do mean noise 1000x the signal amplitude)).
But 100mV is 20dB below signal level and not at all unreasonable. The interference is within the sweep bandwidth – it really ought to work OK .
Comparing with other Scopes with FRA
I slept on this and realised that I couldn’t leave it here.
The trusty test box was applied to a Picoscope 6424E with the free open-source FRA software, a Keysight DSO-X 3024T and an R&S RTA4004.
Picoscope and FRA software, test box no interference signal
Picoscope and FRA software, test box 1Vpp interference signal
Keysight DSO-X 3024 and FRA app, test box, no interference signal
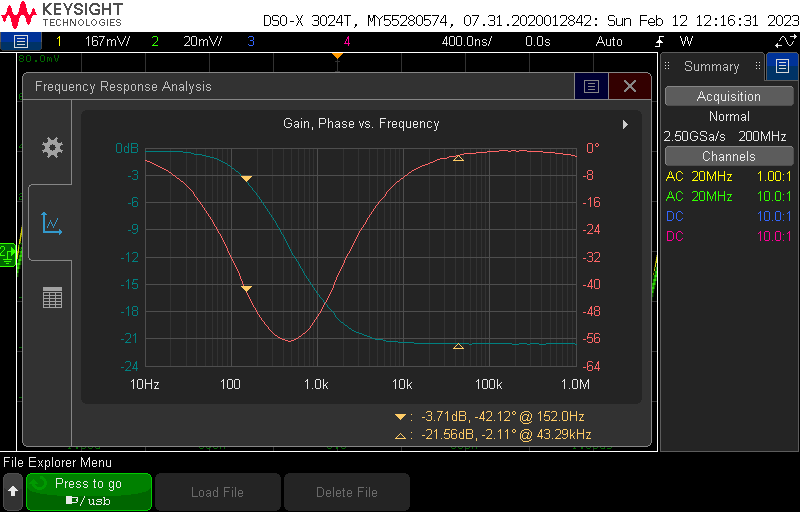
Markers work OK on Keysight, but it doesn’t show difference between them. Of the four devices test it’s the only one that shows the insertion loss of the test box correctly. All the others show loss ref. the generator signal.
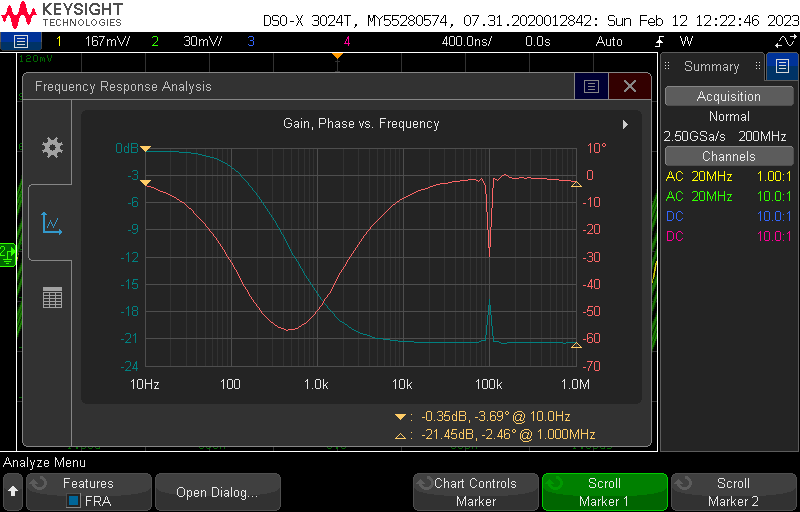
Keysight DSO-X 3024 and FRA app, test box, 1Vpp interference signal
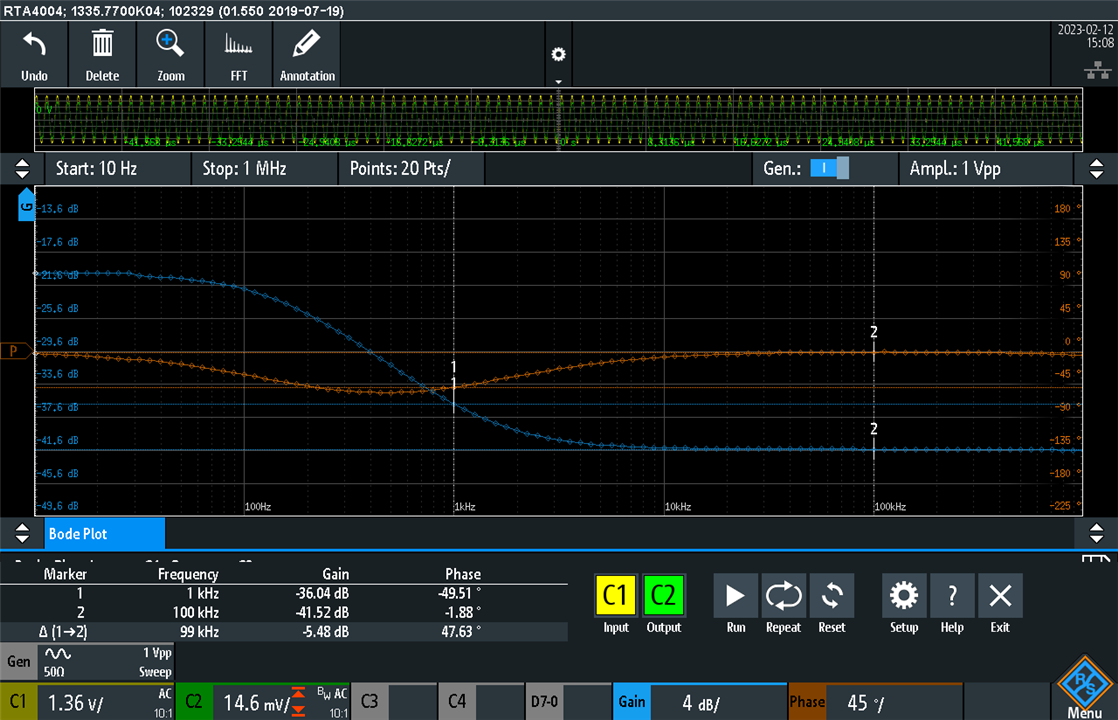
R&S RTA4004 and FRA app, test box, no interference signal
R&S RTA4004 and FRA app, test box, 1Vpp interference signal
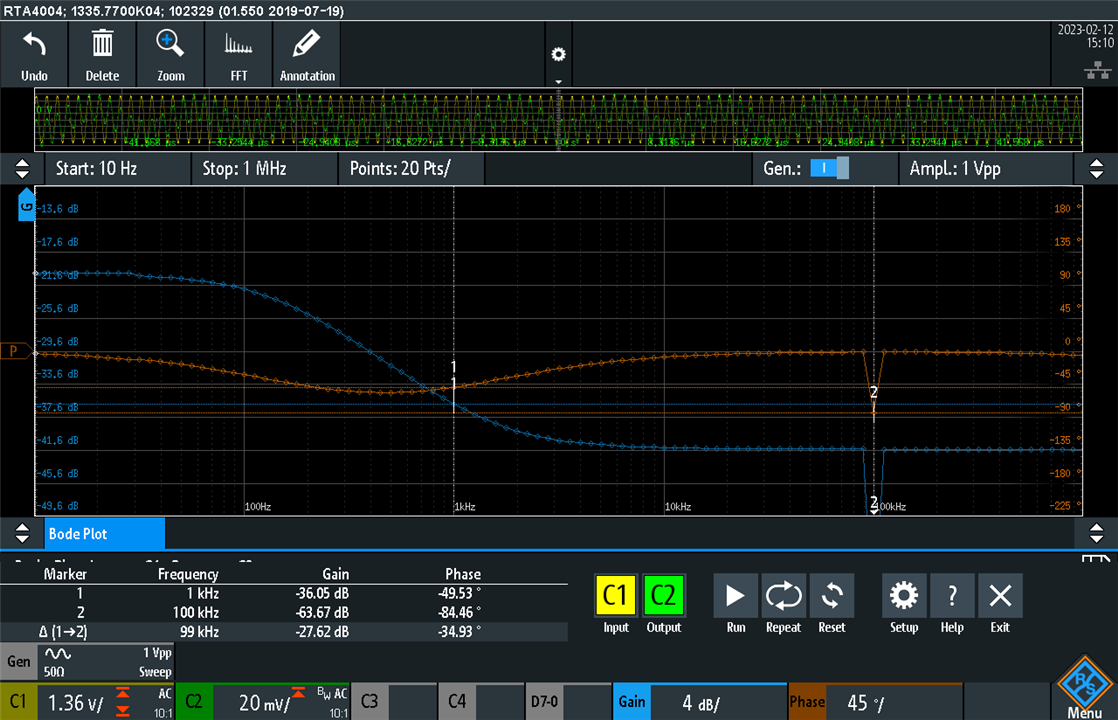
Ok, so now we know – the test box procedure is fine – its just that the MXO4 with FRA can’t cope with it, but three out of three other scopes with FRA options get it right.
Just to be absolutely sure I tried the MXO4 again:
Same as before – so as far as the FRA is concerned that’s a show stopping bug. For example, one of the applications promoted for in-scope FRAs is checking the closed loop characteristics of switching power supplies.
A 100kHz high power switcher is likely to have lots of 100kHz noise around while you try to measure a feed back loop response in the 2-10kHz region – the MXO4 FRA just couldn’t be trusted to get this right.
Summary
The FRA feature of the MXO4 ought to be great. It has a 100MHz bandwidth, moveable markers, optional table display and is based on low noise, high resolution scope data acqisition system.
But in practice its sadly let down by one irksome and one terminal bug:
- markers can't be moved by muti function knob unless pre-selected by touch or mouse
- unexplained large amplitude errors in the presence of interference signals
It also has some unecessary restircions and omisssions:
- can't unwrap the phase display to cover a wider than 360degree range
- no linear frequency sweep otpion
- no adjustable amplitude reference
R&S have been informed of these issues but haven't come back with a response (other than acknowledgement) yet. As soon as they do I'll ammend this blog.
MK


