


Introduction
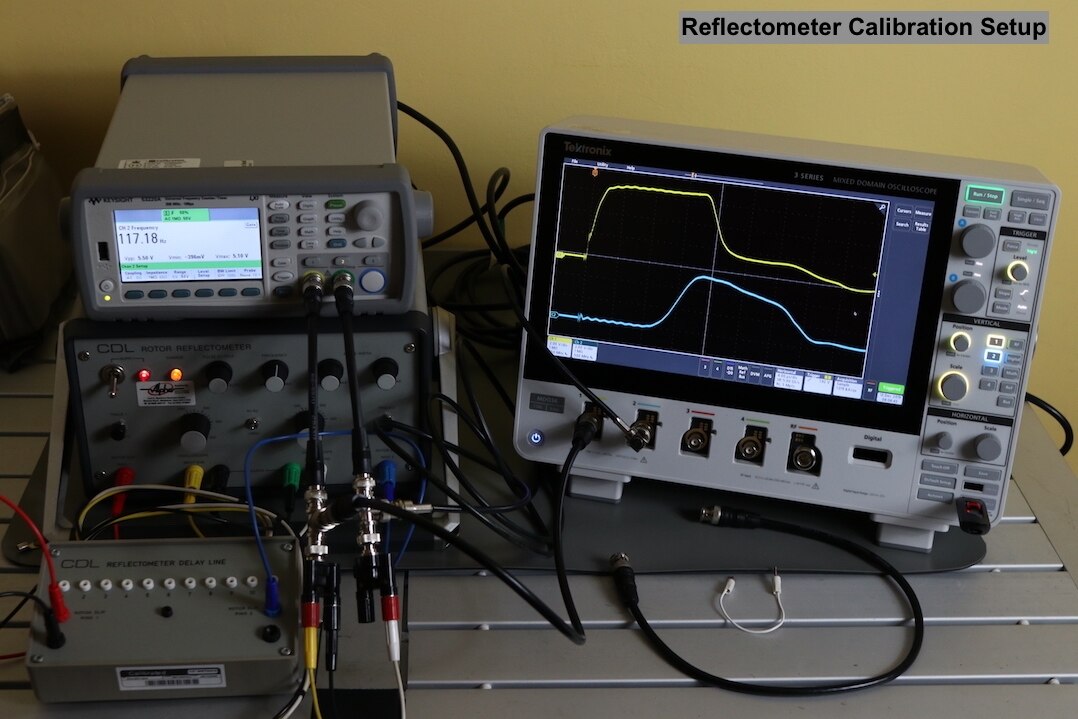
For this blog I am going to use the 3 Series MDO to check the performance of a rotor reflectometer. This instrument is utilised on generator rotors to determine the presence of interturn faults within the rotor winding.
To do this the reflectometer applies pulses to each end of the rotor winding in alternating manner and an oscilloscope compares the reflected pulses. If the reflected pulses match, then there are no faults. If the reflected pulses are different then a fault is present. The location of the fault can be determined by measuring the time to the reflected pulses and calculating the delay in terms of winding length.
The performance of the rotor reflectometer is generally checked with a Keysight 53220A53220A counter, but I will aim to collect the readings alongside this with the 3 Series MDO and compare the results obtained.
Calibration Checks
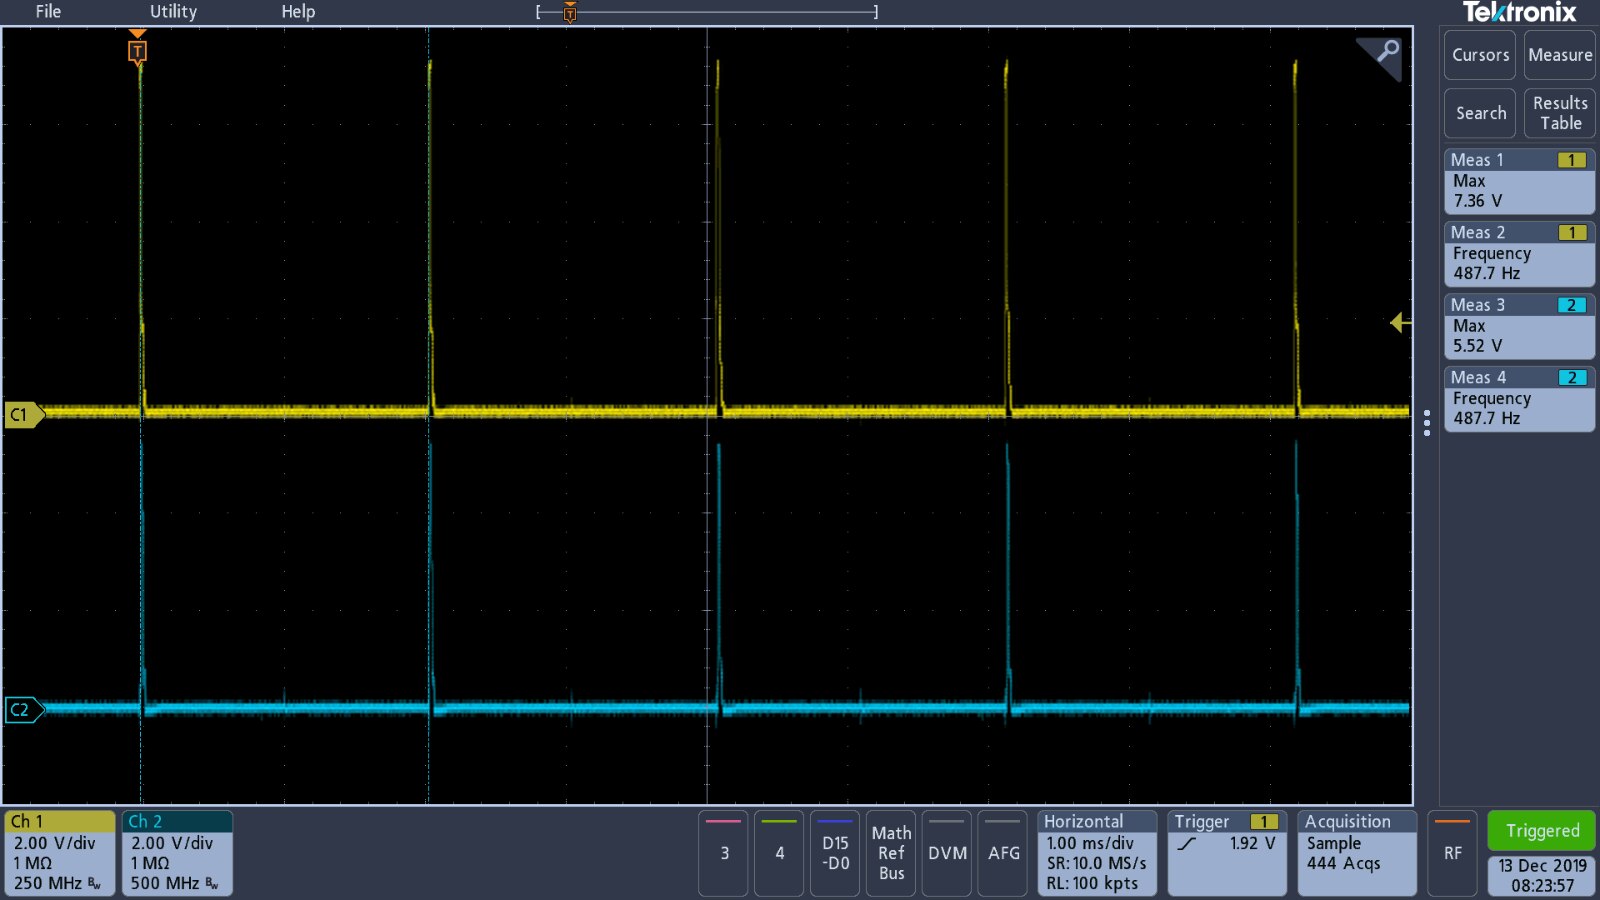
Checks are made on the reflectometer to ensure that the frequency of the pulses, the pulse widths, the pulse amplitudes and the interval between the input and output pulses are within expectations. I will also reflect on which methodology provides the most efficient way to carry out the checks.
The reflectometer has two outputs, the first is the single transit which is the pulse fired from one end of the winding to the other. The second is the double transit which is the reflected pulse seen at the end where the single transit pulse is fired from. As the counter is two channel, I connect the double transit output to channel one and the single transit to channel two. These are then paralleled to channels one and two of the oscilloscope.
The oscilloscope does not need any specific setup in terms of bandwidth or memory depth, the input impedance is set to 1 MOhm to avoid loading the reflectometer. The amplitude and timebase are adjusted to suit as the tests are progressed. As I am working with two channels, the measurements are changed dependent upon the tests due to the limitation of four measurements on screen at any one time.
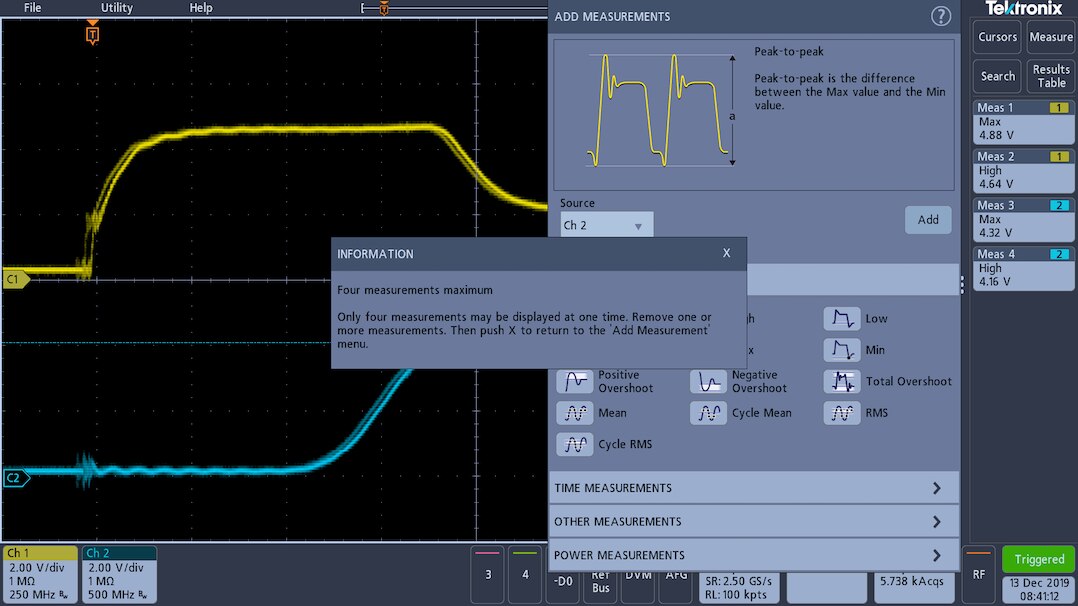
Examples of signals captured and measurements made on oscilloscope
| {gallery} Rotor Reflectometer Measurements |
|---|
Maximum Pulse Frequency Measurement |
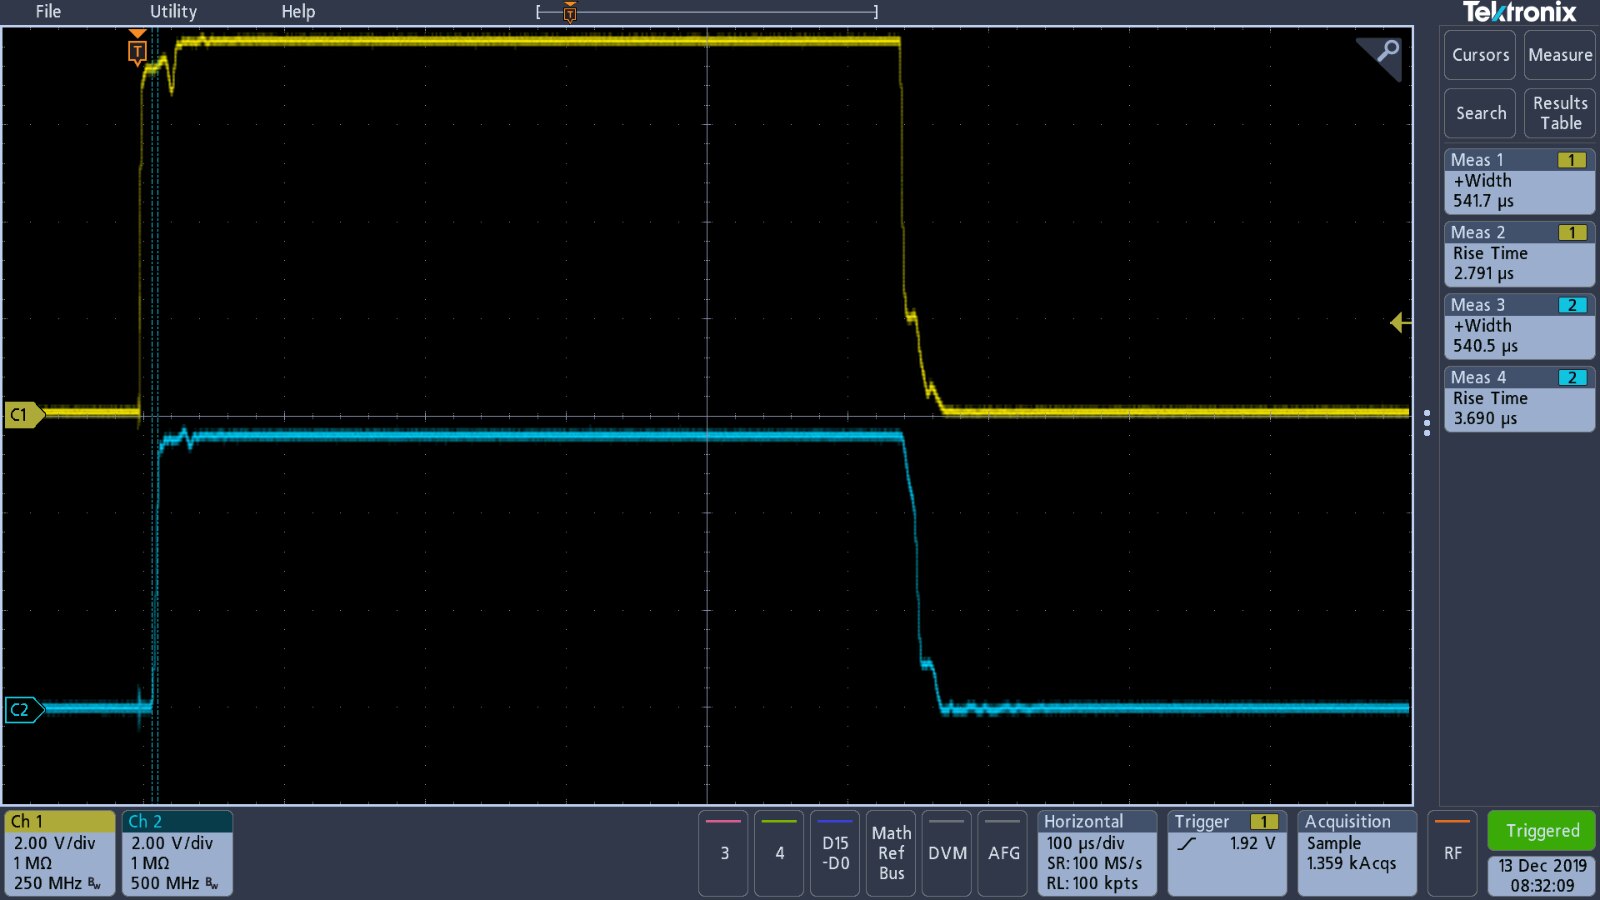
Minimum Pulse Width Measurement |
Maximum Pulse Width Measurement |
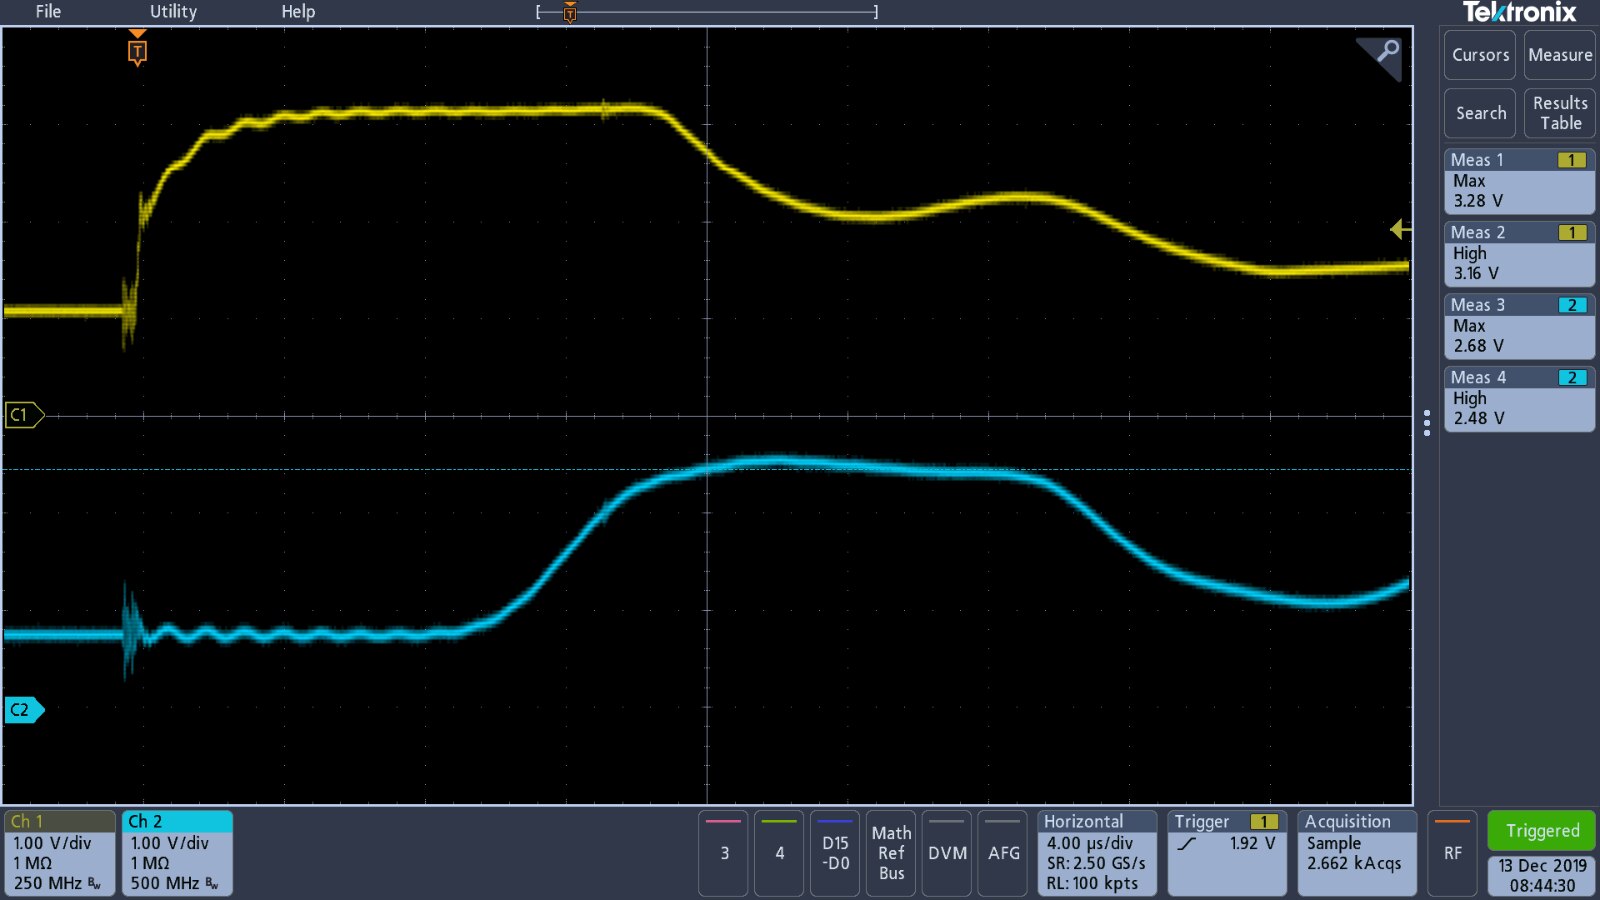
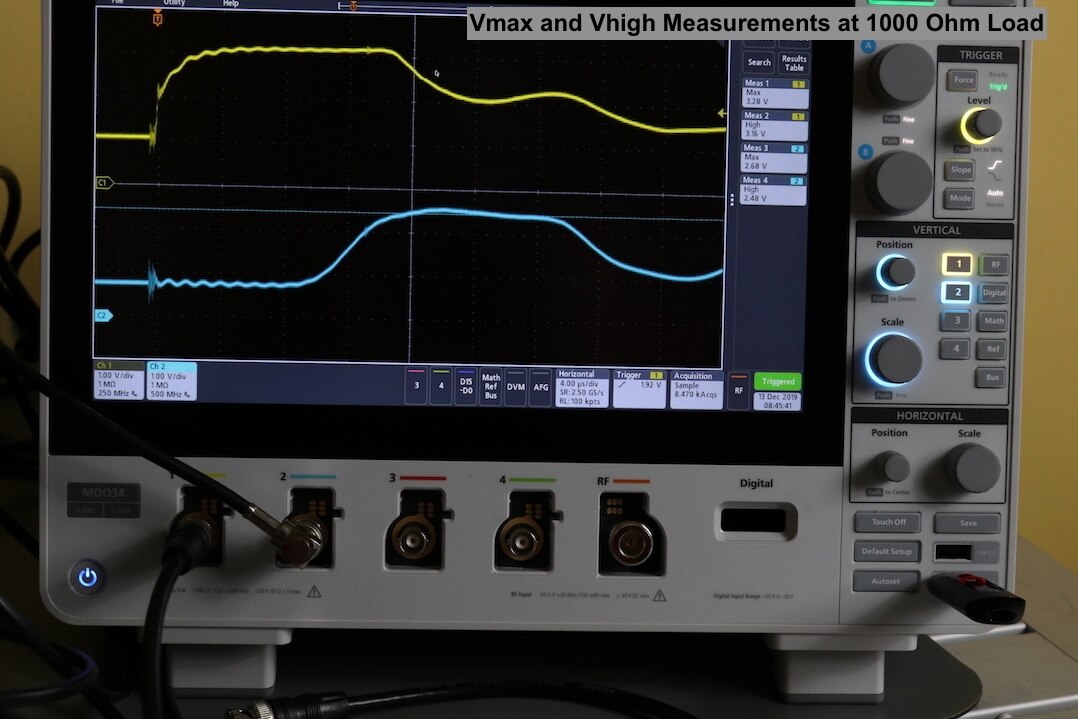
Pulse Amplitude at 50 Ohm Load |
Pulse Amplitude at 1000 Ohm Load |
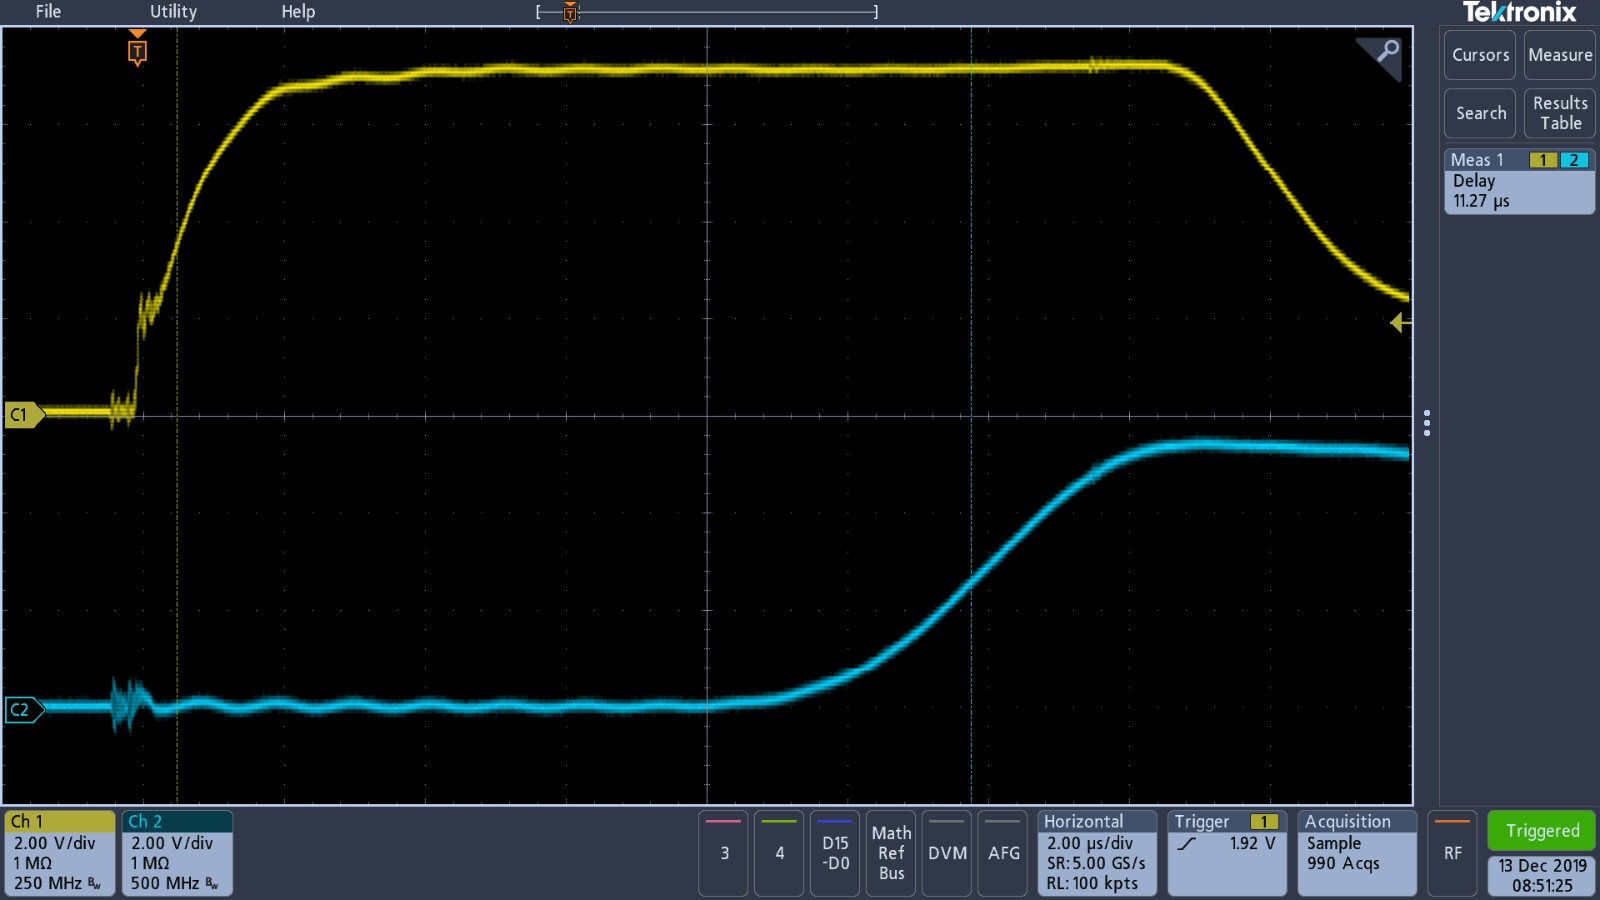
Interval Measurement between Single and Double Transit Pulses |


The largest difference between using the oscilloscope and the counter is that the information for both channels is available on the oscilloscope at the same time, where as on the counter, there is a constant need to switch between the two channels to obtain the readings for the test settings. This makes the checks more convenient and a little quicker, there is also less risk of confusion between the channels and writing down the wrong reading. However, the counter does offer a higher level of accuracy than the oscilloscope.
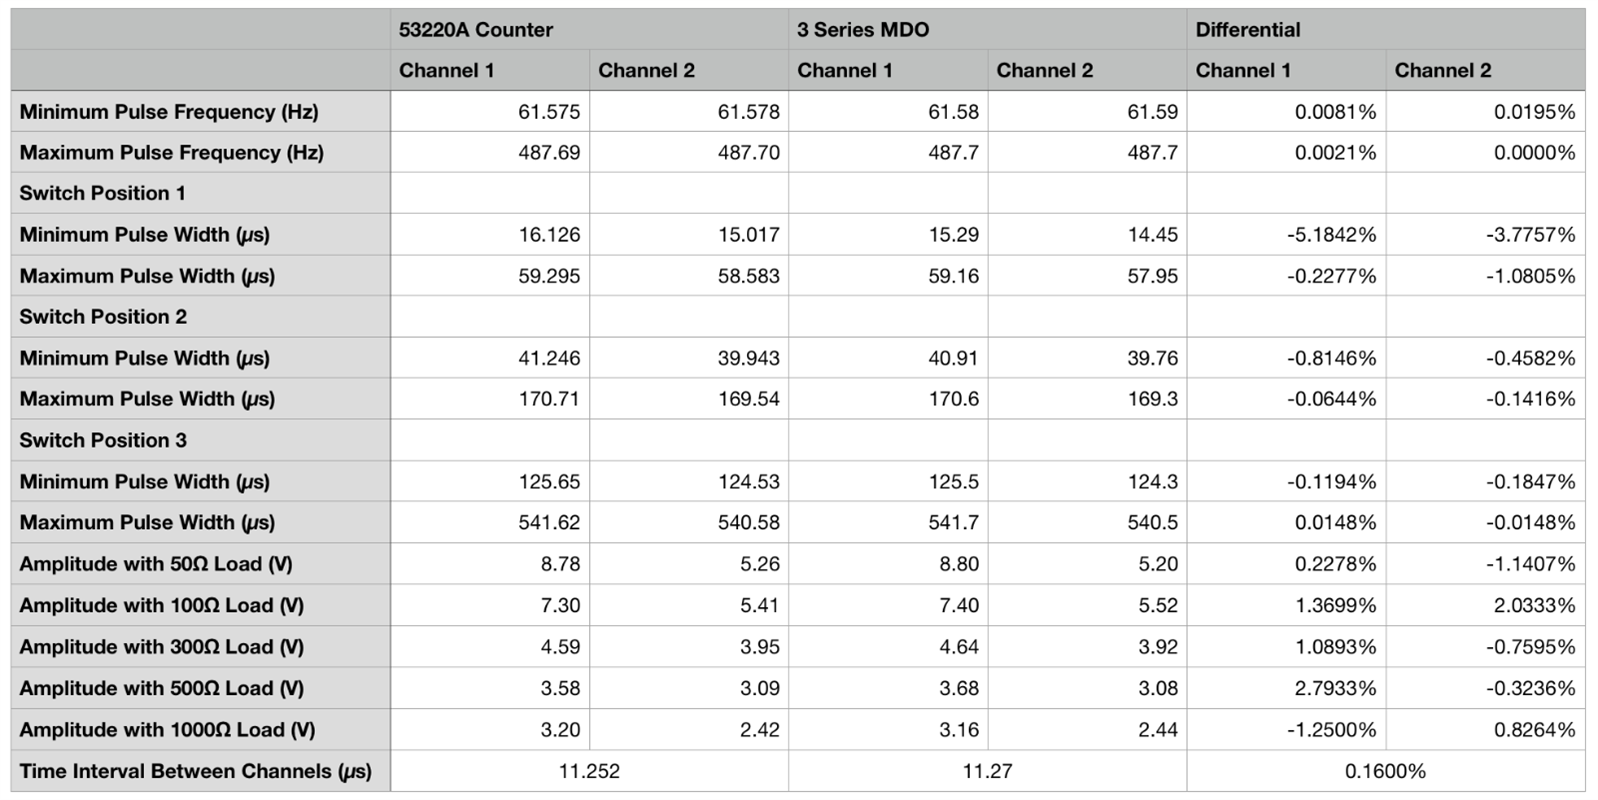
The frequency and pulse width measurements between the two instruments were comparable. The largest deviation was around 5% for the lowest pulse width measurement, this seems out of characteristic with the other time based measurements, so I need to go back and double check that there wasn't a reading or setup error.
Amplitude measurements also showed good comparison between the counter and oscilloscope, the largest deviation being a little under 3% at the 500 Ohm load. Sometimes ripple is observed on the output waveforms and it may be this that has caused some of the error.
Resolution for the amplitude measurements was the same between the counter and the oscilloscope. Again, the checks were a little faster using the oscilloscope as there was no need to flip between channels to record the values.
The time interval between the input and output pulses proved to be more accurate on the oscilloscope when the timebase was set to expand the waveforms more across the screen. The initial measurement with a higher timebase provided a slightly lower reading in comparison to the counter.

Overall the checks went well. Although the oscilloscope is less accurate, the reflectometer is not in itself the most accurate of instruments and therefore the speed and convenience of the oscilloscope out weighs the accuracy, but slower operation, offered by the counter.
Measurement captures
The next stage after the checks was to utilise the test delay line to record some reflectometer measurements. These were for comparison against the Rigol DG1052E oscilloscope currently used to capture the traces. The test box utilised during the performance checks has the ability to simulate both inter-turn and earth faults, that will change the reflectometer output.
Initially the reflectometer is set up and the width of the double transit pulse recorded, this was easy to do with the cursor function of the oscilloscope. The second channel is then enabled and the time to the start of the single transit pulse measured. These two values are important as they can be used to calculate the distance to a fault should one be observed.
| {gallery} RSO Measurements |
|---|
Double transit pulse measurement |
Single transit pulse measurement |
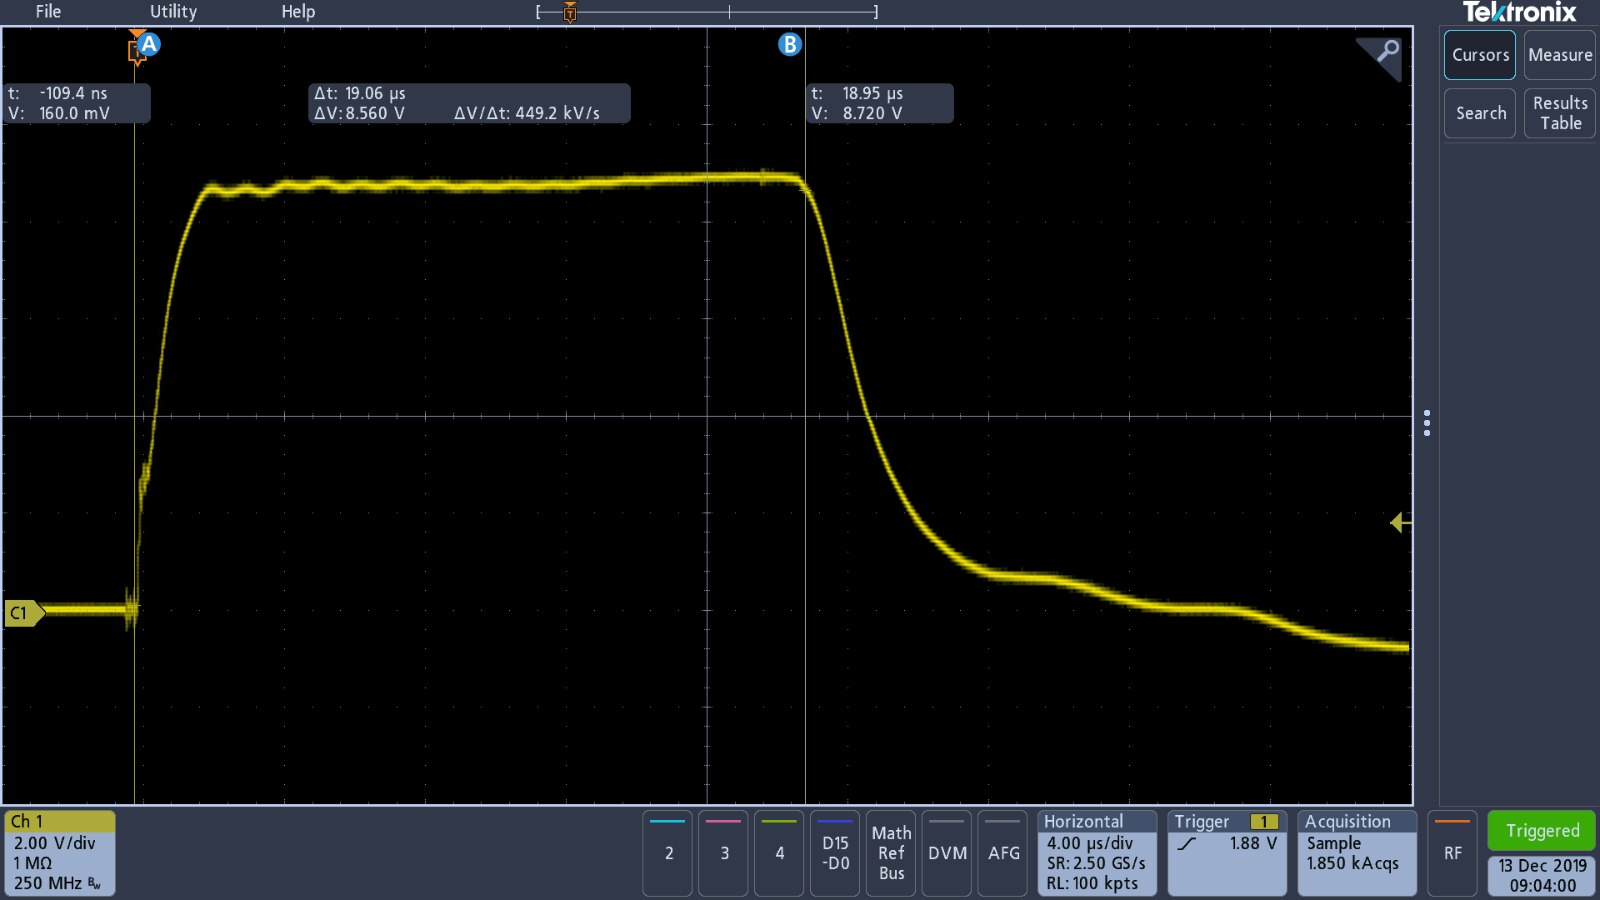

Faults can then be placed and the screens captured. The first fault applied is a short between two adjacent turns of the winding. This results in a double deflection in the waveform.
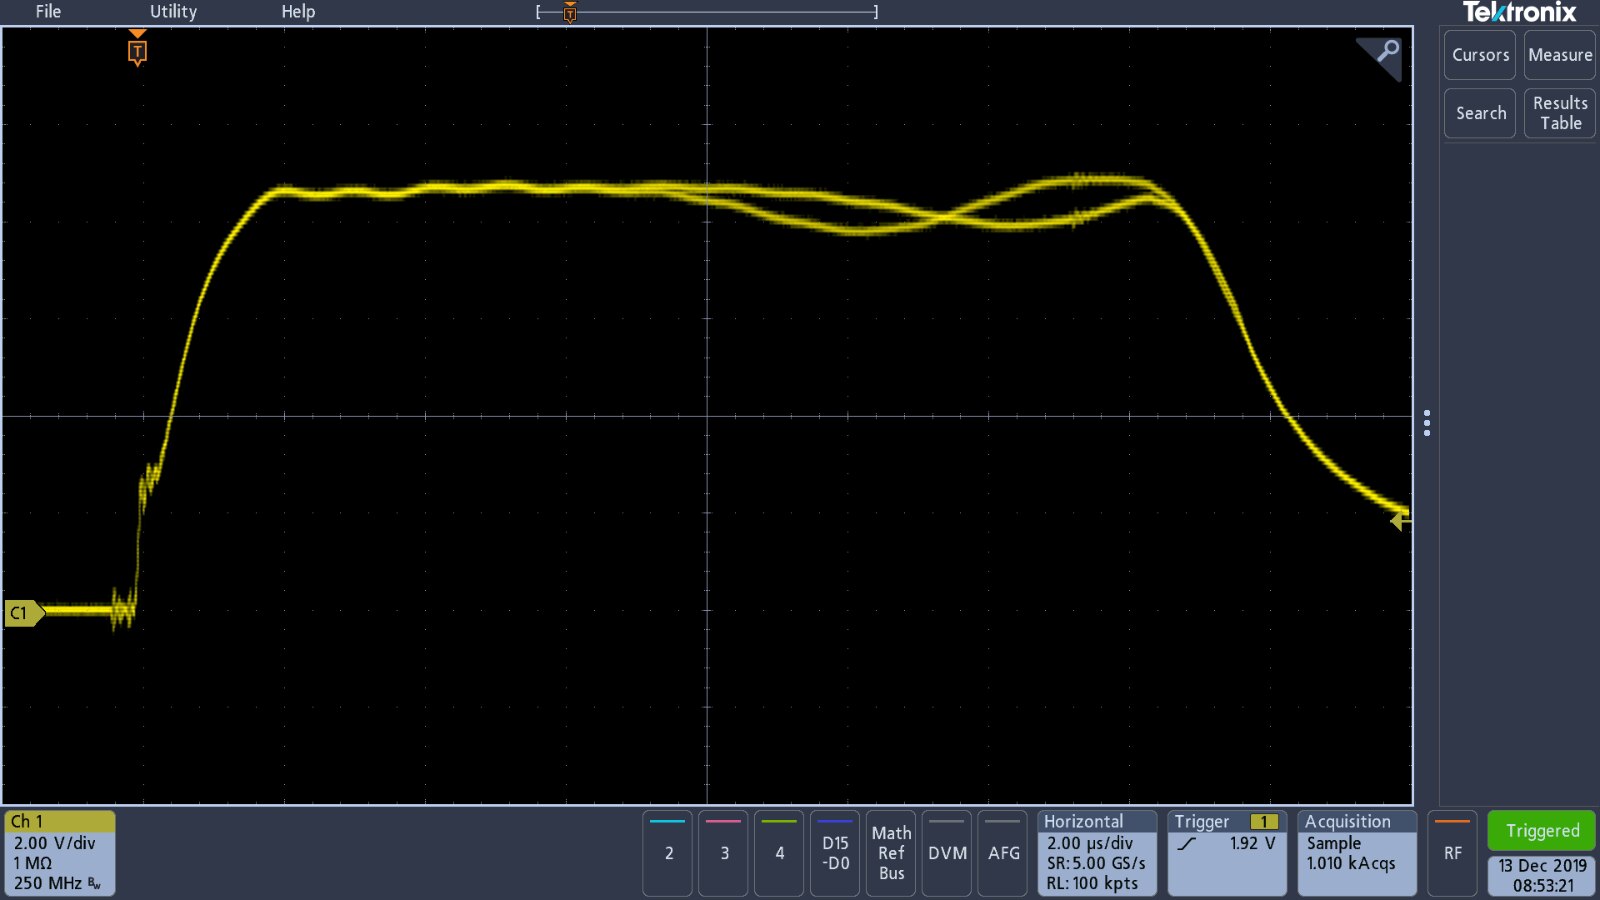
This shows up quite clearly on the oscilloscope, here the advantage of such a large screen can clearly be seen. There is another significant improvement though, the screen capture has recorded both of the deflections. For some reason, the Rigol oscilloscope does not record both deflections, so I have to save one deflection as a reference waveform and then screen capture this alongside the channel waveform.
| {gallery} Rigol Screen Captures |
|---|
Rigol scope measurement of double transit pulse |
Rigol scope capture of first deflection |
Rigol scope capture of second deflection |
Rigol scope display of both deflections using a reference waveform |


This offers a huge advantage over the Rigol oscilloscope when carrying out reflectometer measurements with a rotating generator shaft. As the generator shaft slows down from 3000 rpm, the shape of the waveform changes slightly, using the Rigol, I have to repeatedly correct the reference waveform to get accurate readings, but with the 3 Series MDO this is not required and I can record the screen much more easily.
Lets simulate an earth fault and also record the pulse starting point.

Here one of the signals is dragged down, but the other signal remans relatively unchanged and just looses its sharp corner at the end of the waveform. The cursors can easily be moved to the start of the fault, the adjustment has both coarse and fine control to allow the cursor to be placed quickly and accurately. I can only have two vertical cursors on the screen at a time, as I am only interested join one point on this waveform, the second cursor is moved off screen, but the location label for this cursor and the differential calculation remain on the screen. It would be really nice if the cursor menu could include the selection of a single cursor and disable the other labels for this type of measurement.
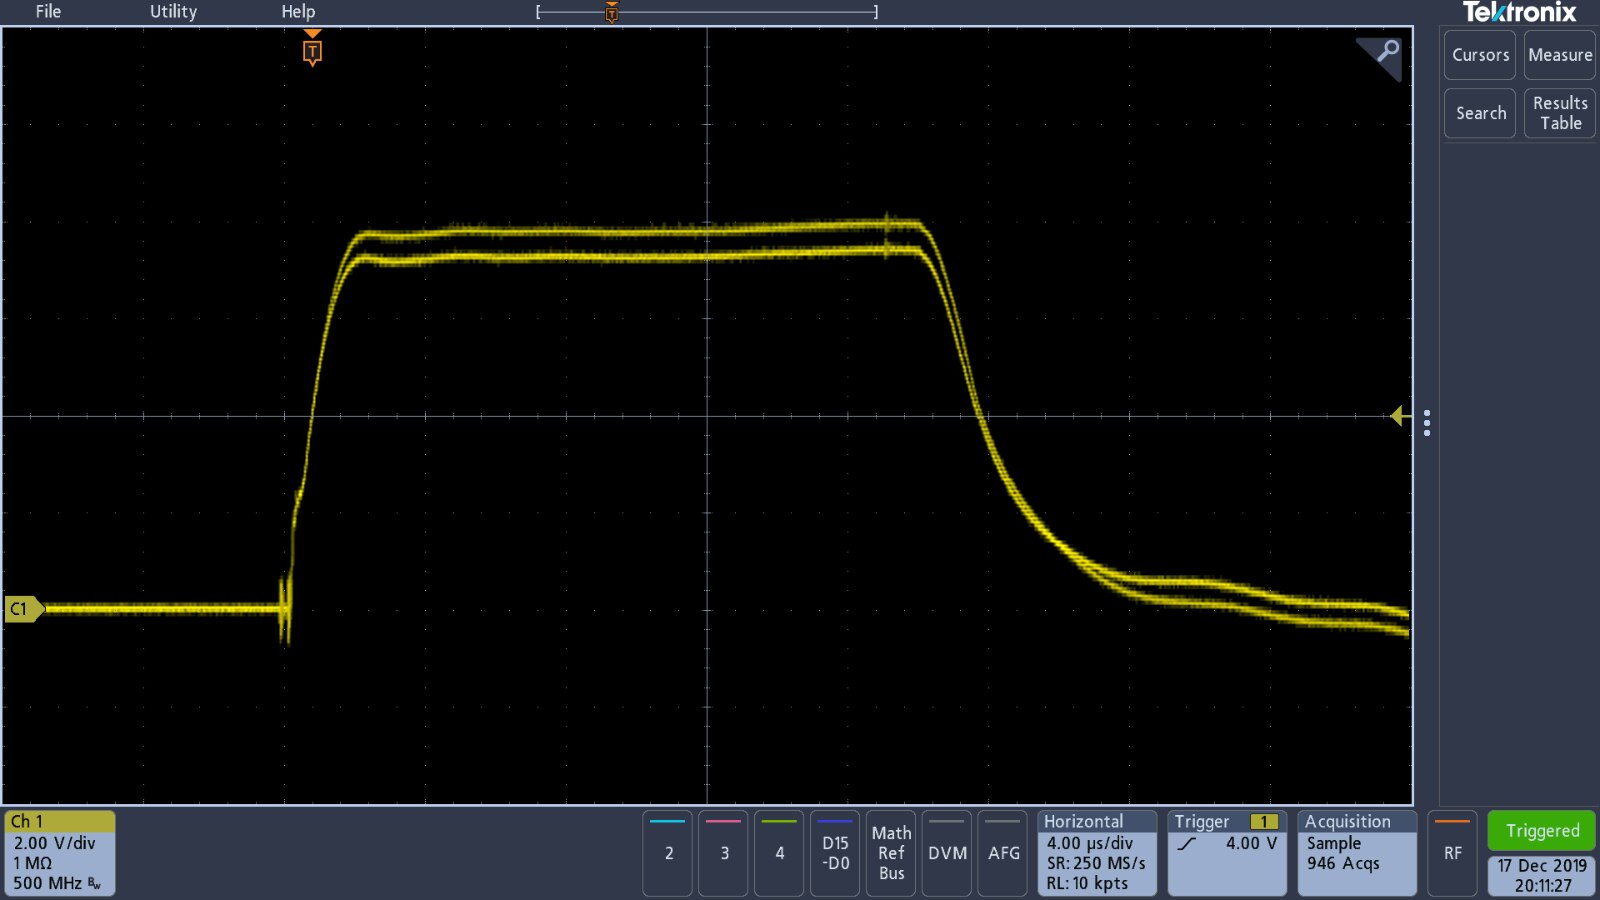
So when faults are present it is easy to see both the traces, but when they aren't the traces overlap one another as seen below.
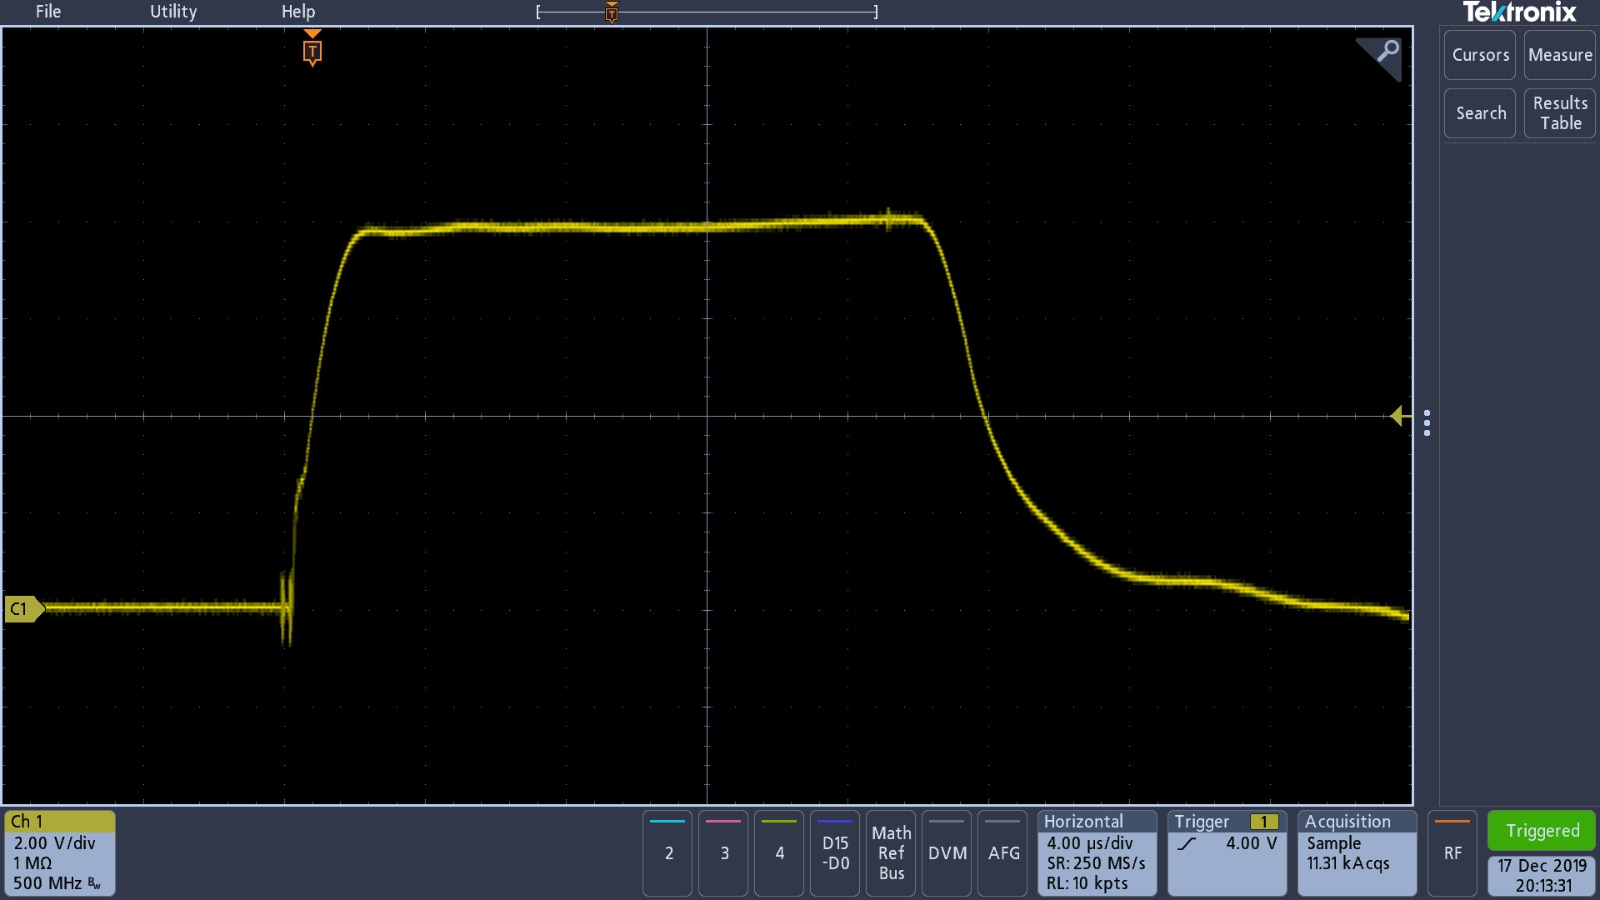
To show that both traces are present, the rotor reflectometer has a push button that will split the traces whilst pressed to give confidence that there are no faults. As you can see, this is easily captured by the oscilloscope. Using the Rigol, I would have had to use the reference waveform again and manually moved one of the traces using the vertical position function on the oscilloscope.
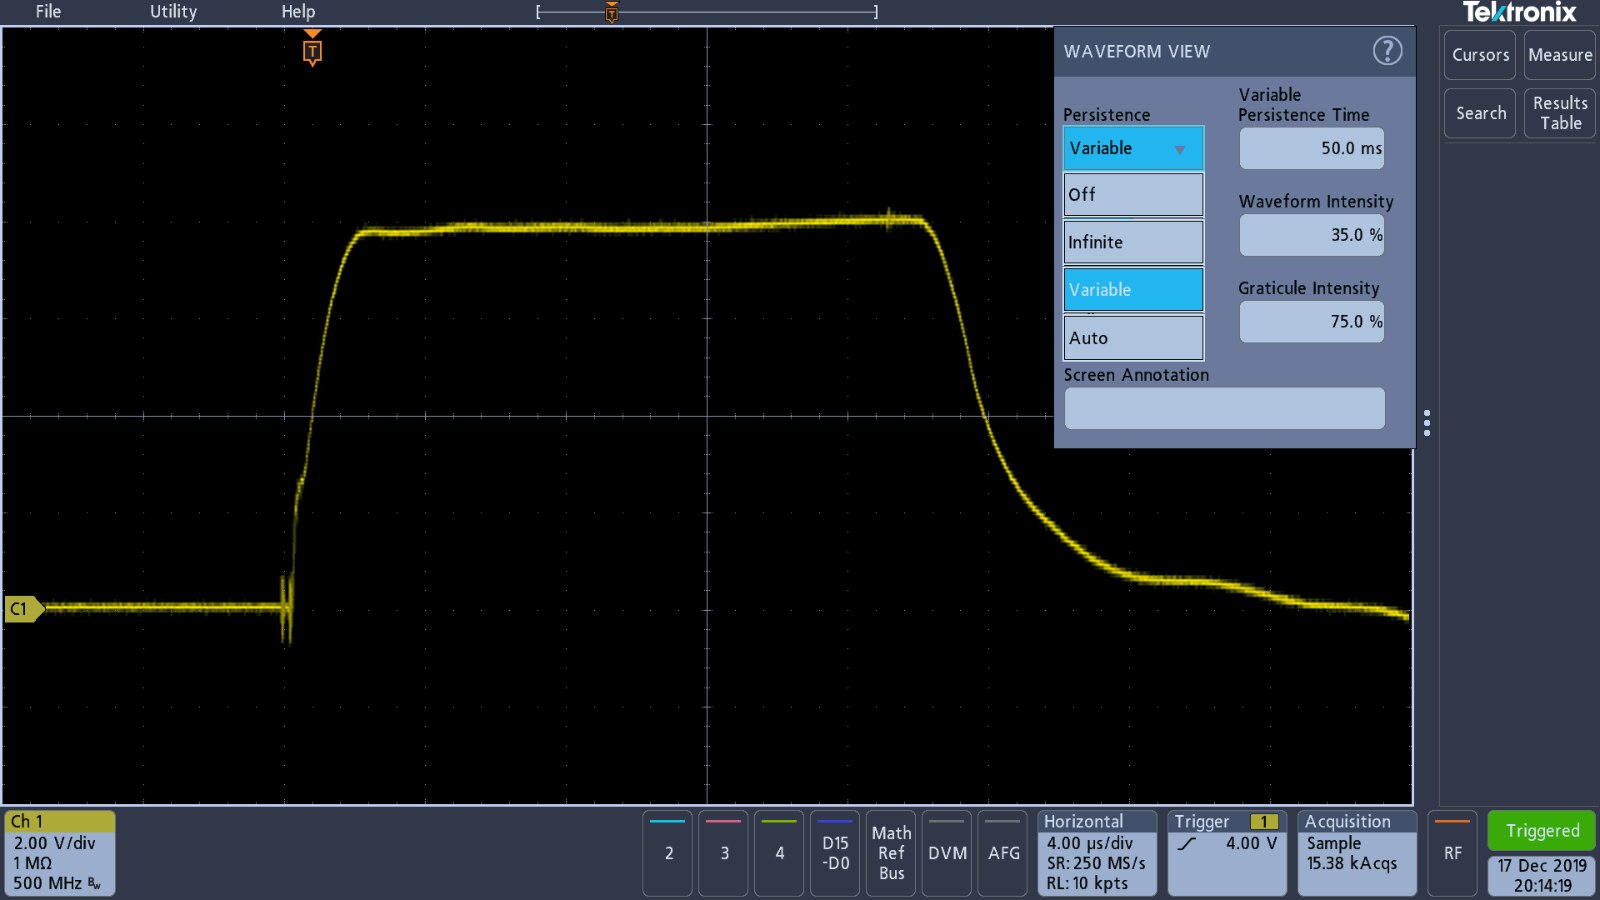
These traces are being captured due to the persistence function, that can be altered by tapping onto a blank part of the screen. The persistence mode always seems to default to 'auto' when the unit is switched on, so automatically captures the traces. You also have the option to turn it off if required.
| {gallery} PScreen persistence functions |
|---|
Screen persistence modes |
Auto persistence options |
Infinite persistence options |

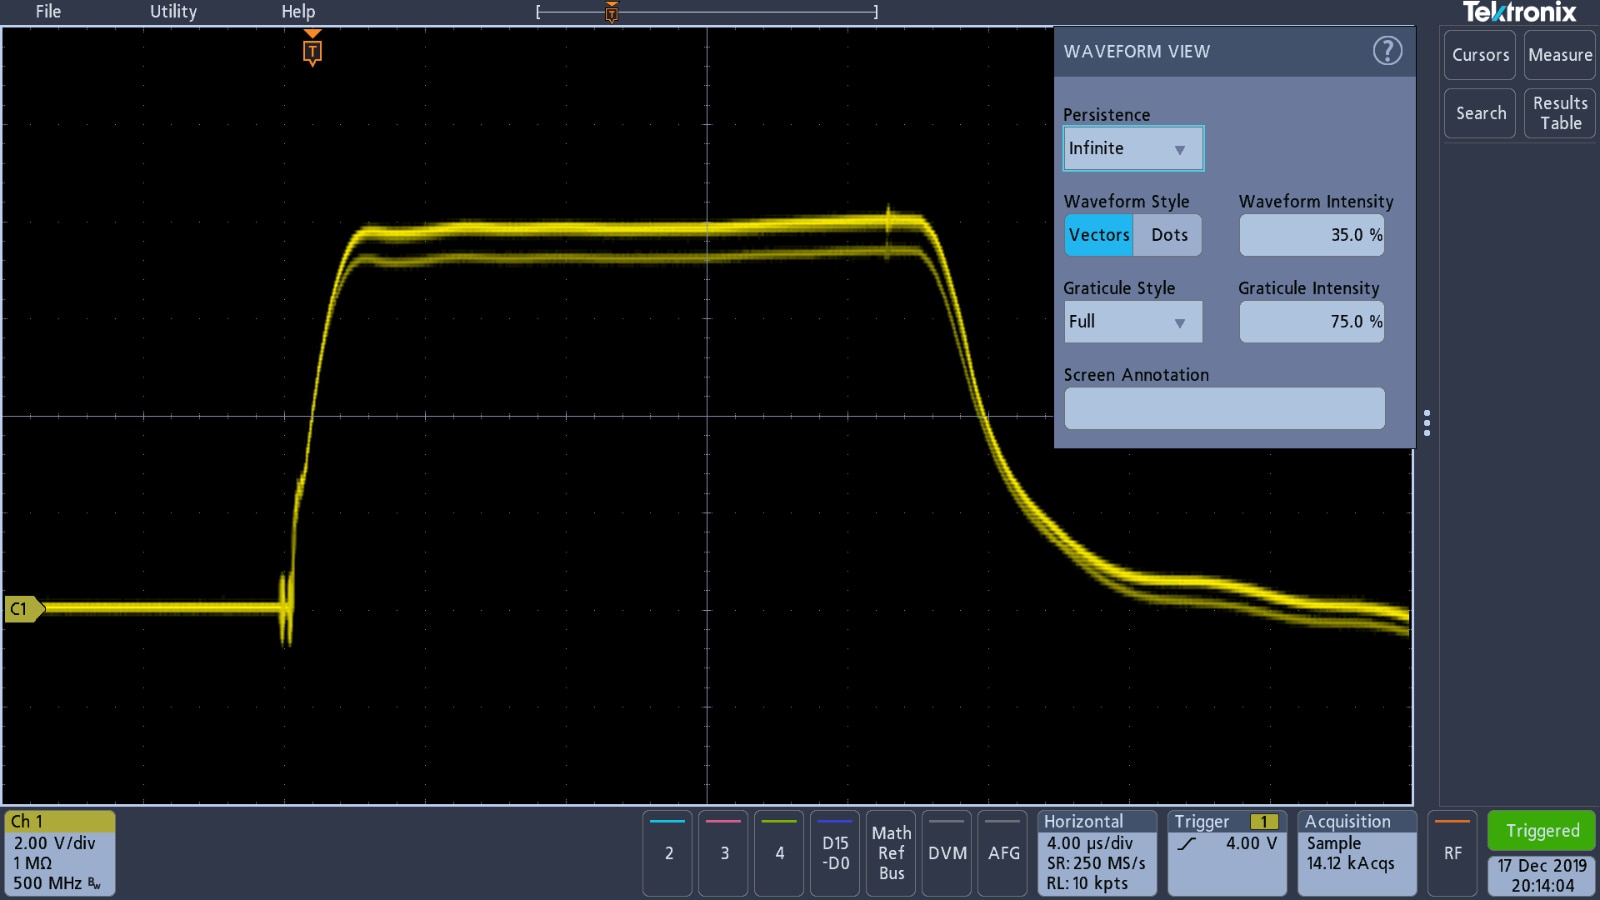
Using the auto function, the screen persistence does sometime produces noise, so does need to be turned off. If left in auto the traces come and go with the push button operation. If switched to 'infinite' mode the split trace is captured and remains there until the screen is cleared, or a new measurement started.
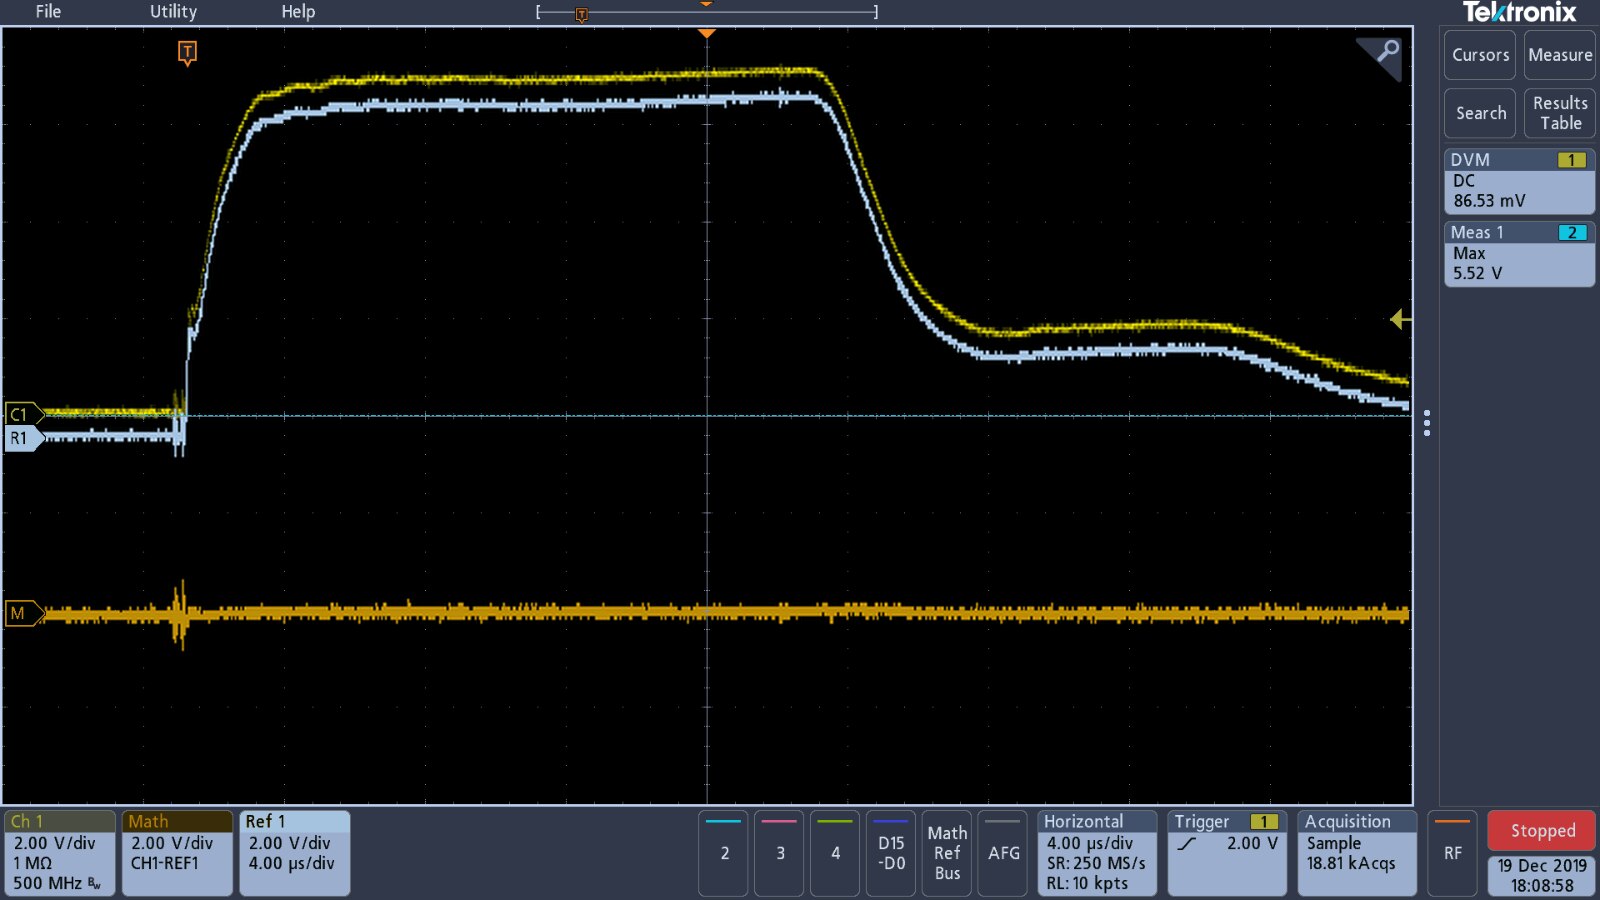
The alternative to using the screen persistence is to save the channel into one of the reference waveforms that can be displayed on the screen at the same time as the channel. The oscilloscope has the advantage of being able to carry out maths functions using the reference waveforms as well as the channels, so a subtracted waveform can then be displayed.
| {gallery} Using the reference waveform |
|---|
Reference waveform split from channel and maths channel added |
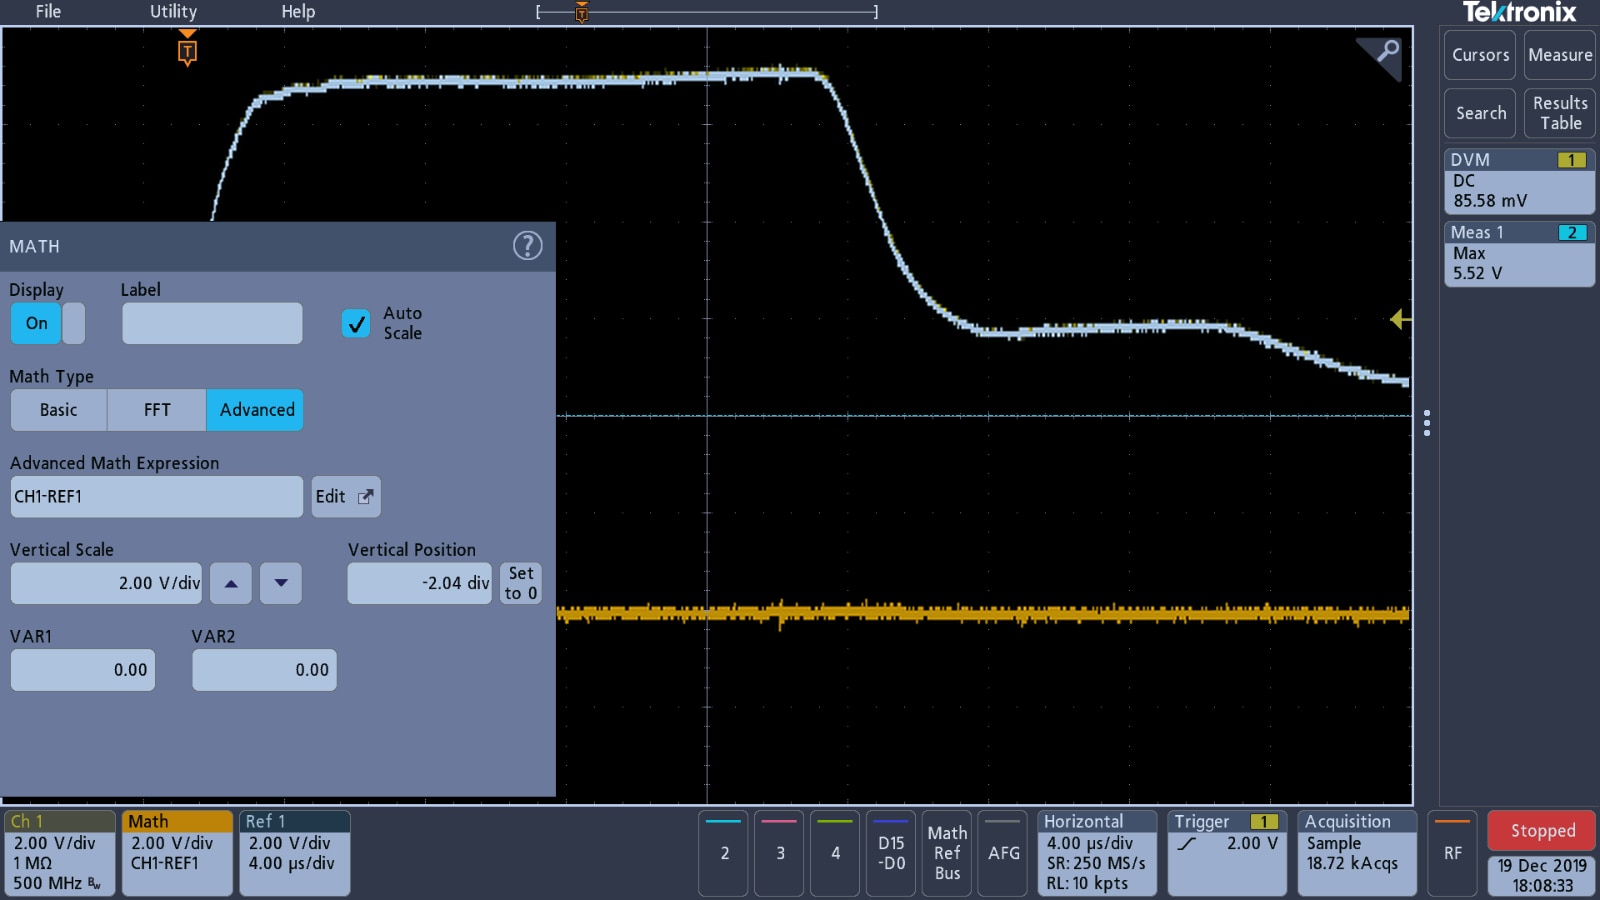
Maths channel setting for waveform analysis |
Analysis with inter-turn fault added to simulator |

The reflectometer I have is an old style single channel unit, so this is the only way I have found to carry out an analysis on the scope. More modern reflectometers have a dual channel output and so the double transit trace can be split over two channels on the oscilloscope and then a live analysis carried out by subtracting channel 2 from channel 1. A new dual channel reflectometer costs close to this oscilloscope though, so I won't be seeing one of them for a while.
The following video shows the measurements above actual being carried out.
Generator Test
The original plan was to take the rotor reflectometer and 3 Series MDO up to a generator and capture the tests on an actual generator rotor. Unfortunately, I am currently working on some switchgear issues at multiple sites, so this test has had to be delayed, probably until the new year. When I have had chance to complete this test, I will finalise this blog. Since I know that the scope will easily capture the traces from the tests already completed, this aspect was always really about how portable the unit was and how it would handle being away from the workbench.
Update 18th January 2020
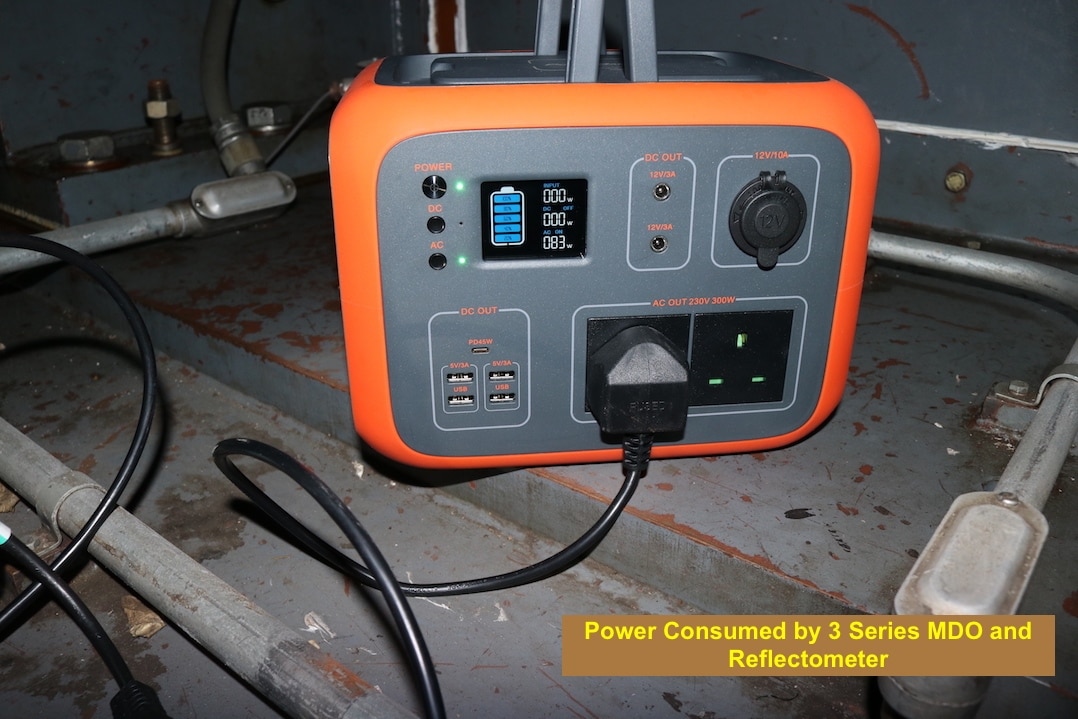
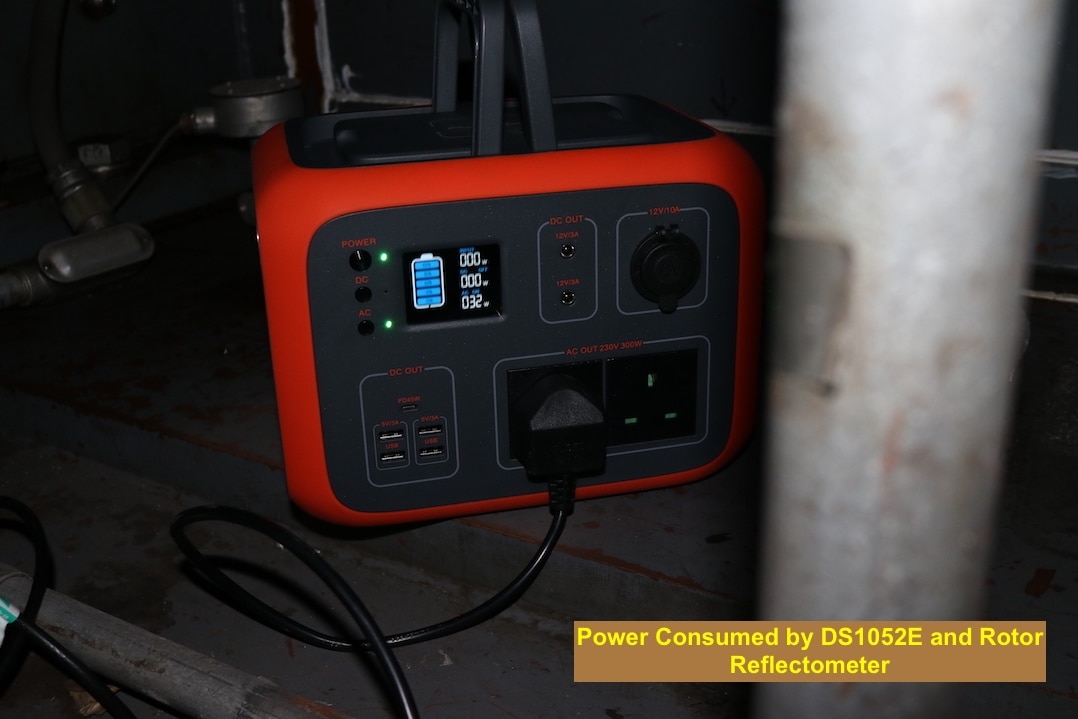
This is the update from the actual test carried out on a generator rotor that is currently in preservation. As with all these assets that enter preservation, parts get borrowed for other installations and maintenance performed is minimal. As a consequence, a lot of the lights are out around the area, so the photography is not the best, the power sockets have also been removed, so I decided to test out the 3 Series MDO with a Power Cube to provide the 230V supply.
As the generator has quite a large bedplate, finding an area to setup the instrumentation is very easy.

With the rotor reflectometer and oscilloscope powered up, the power drawn from the supply was 83W as seen below. The cube has a 300W capacity, so it will quite happily run this test setup for some time.
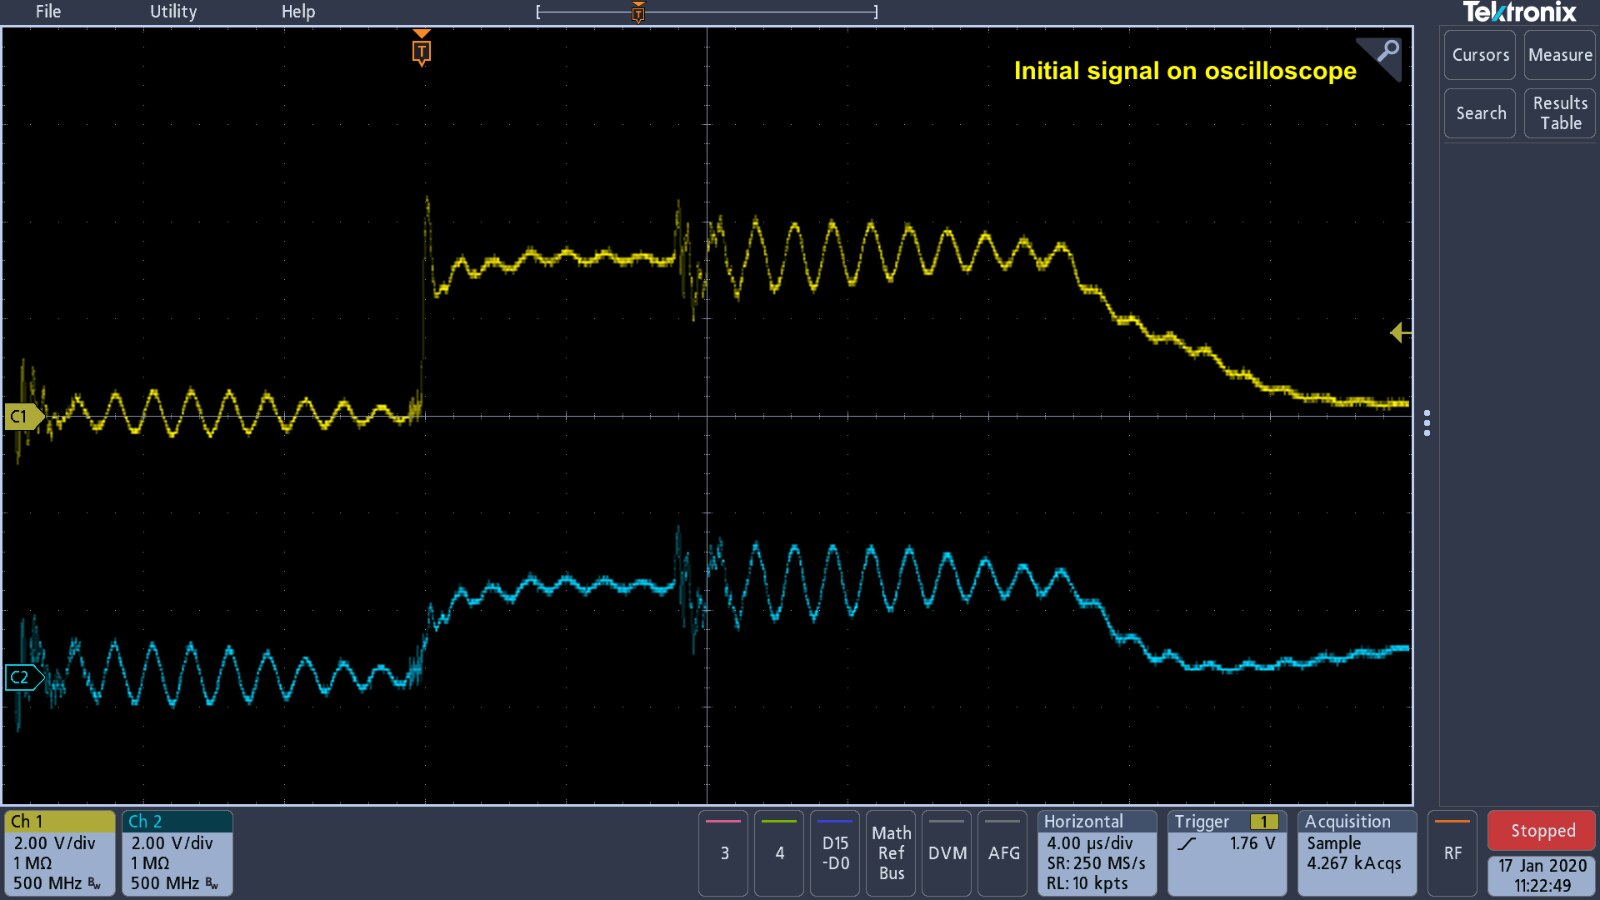
The initial signal on the oscilloscope contained a high level of noise and was virtually unreadable. I assume that the noise is coming from the Power Cube and filtering through on the common earth from the cube to the oscilloscope, as the supply is effectively floating and is not connected to a solid earth. The instructions for the Power Cube, do contain a warning that noise may be present on televisions and media players.
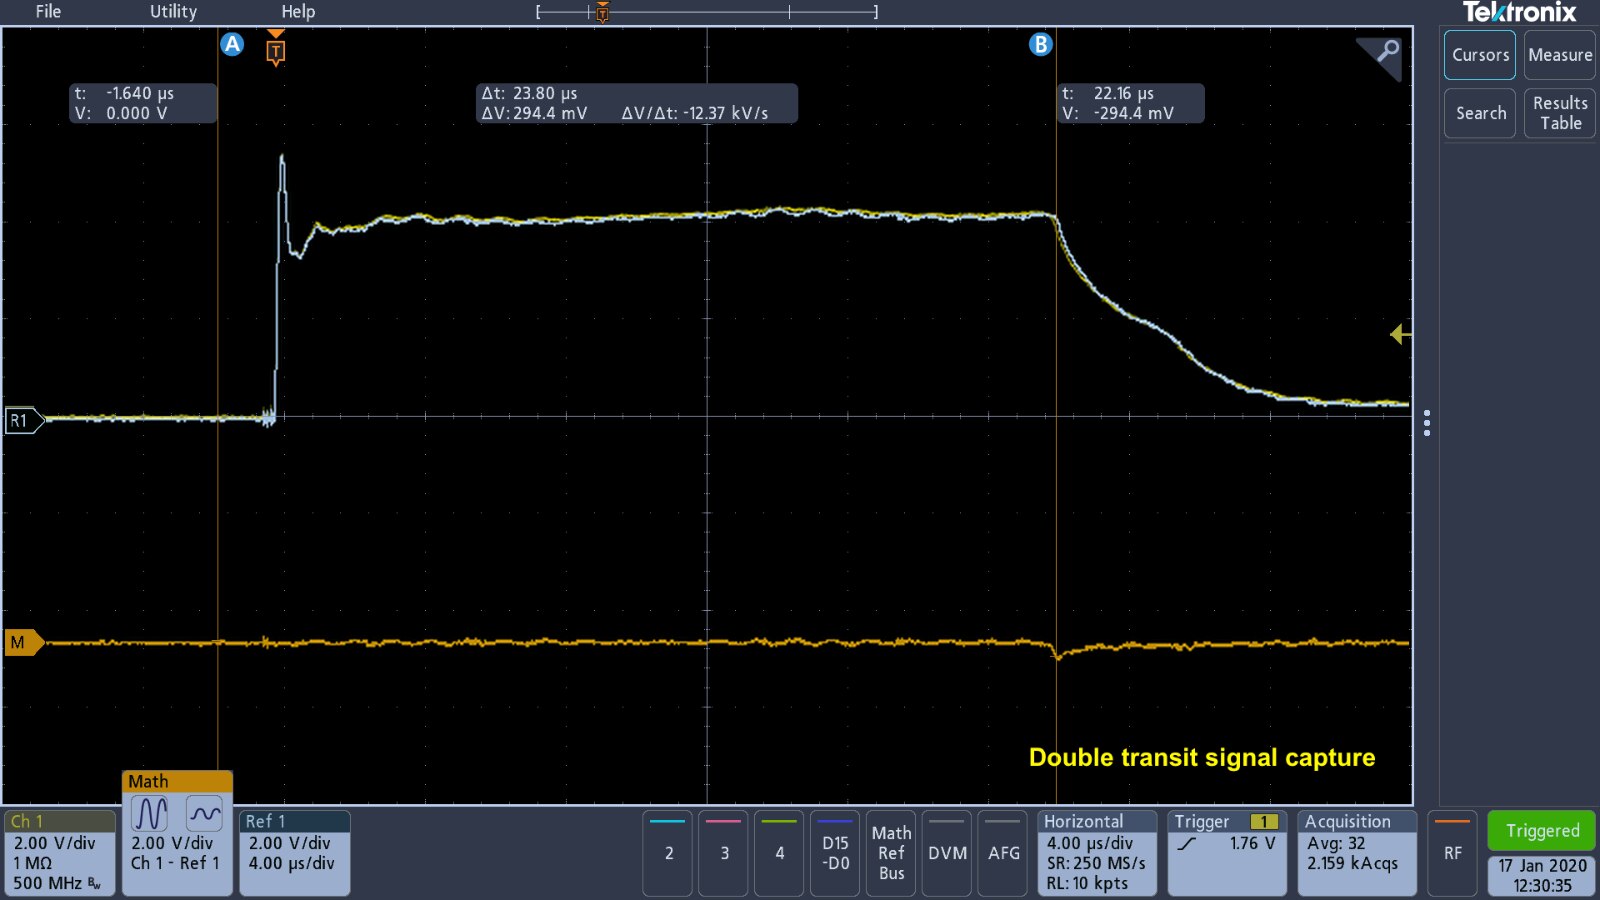
I struggled to get the oscilloscope to trigger in a stable manner, even with average sampling turned on. I managed to capture a reading for the double transit trace, but could never get a reading for the single transit trace, due to the noise on the signal. I did manage to carry out the maths analysis with the reference signal and the 23 us transit time is similar to previous tests carried out.
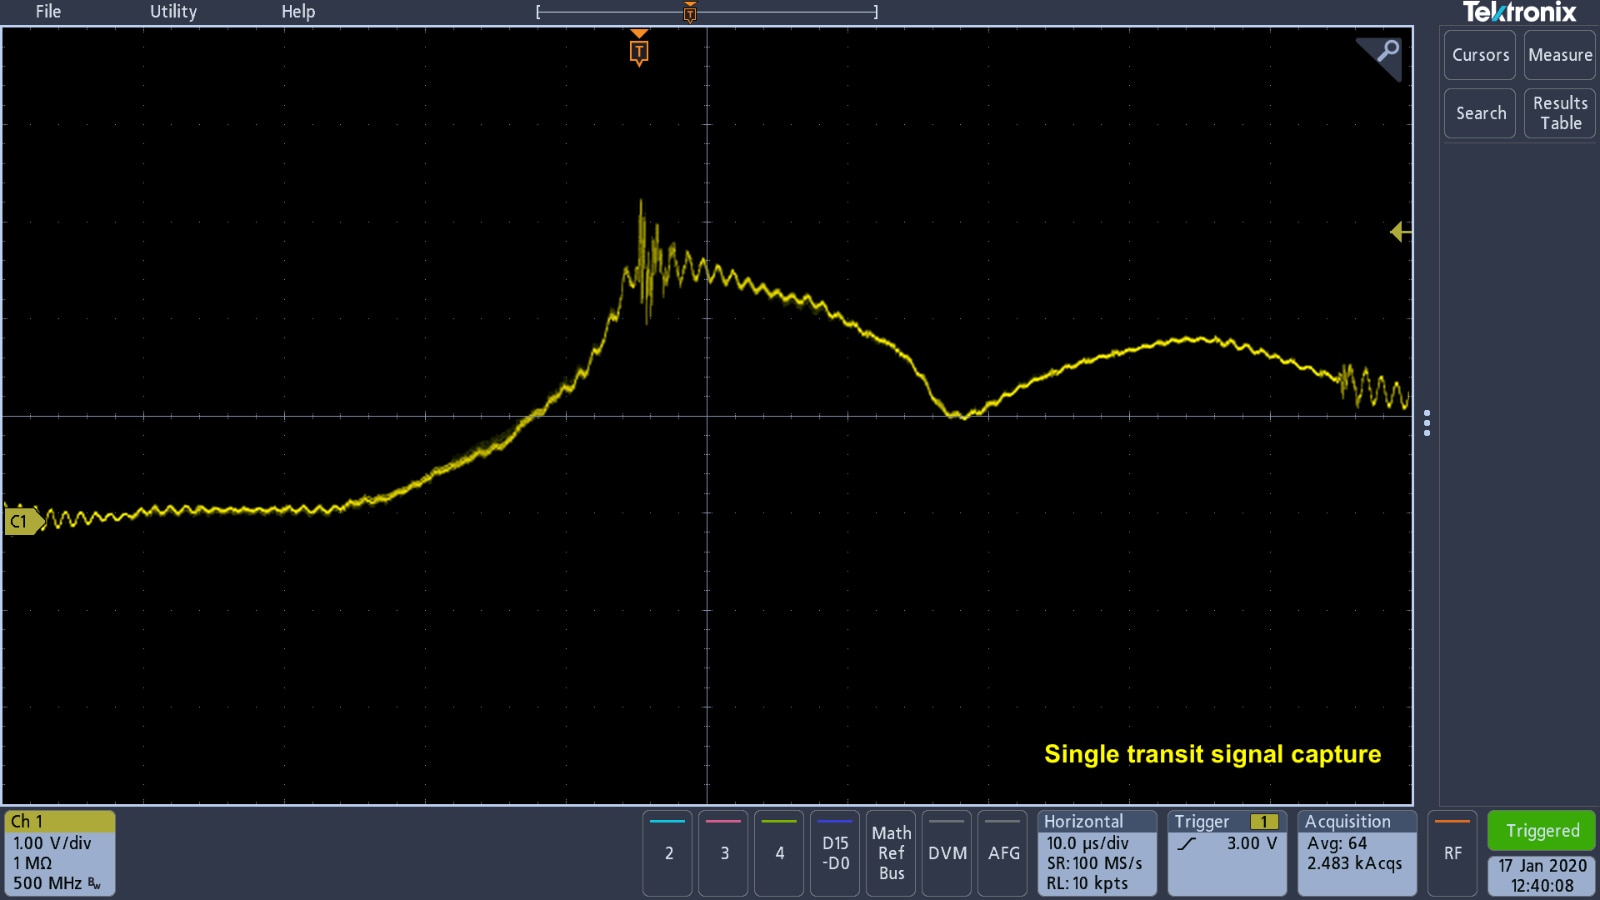
The single transit signal above, is unreadable and the noise on the signal prevent me from taking any accurate measurements.
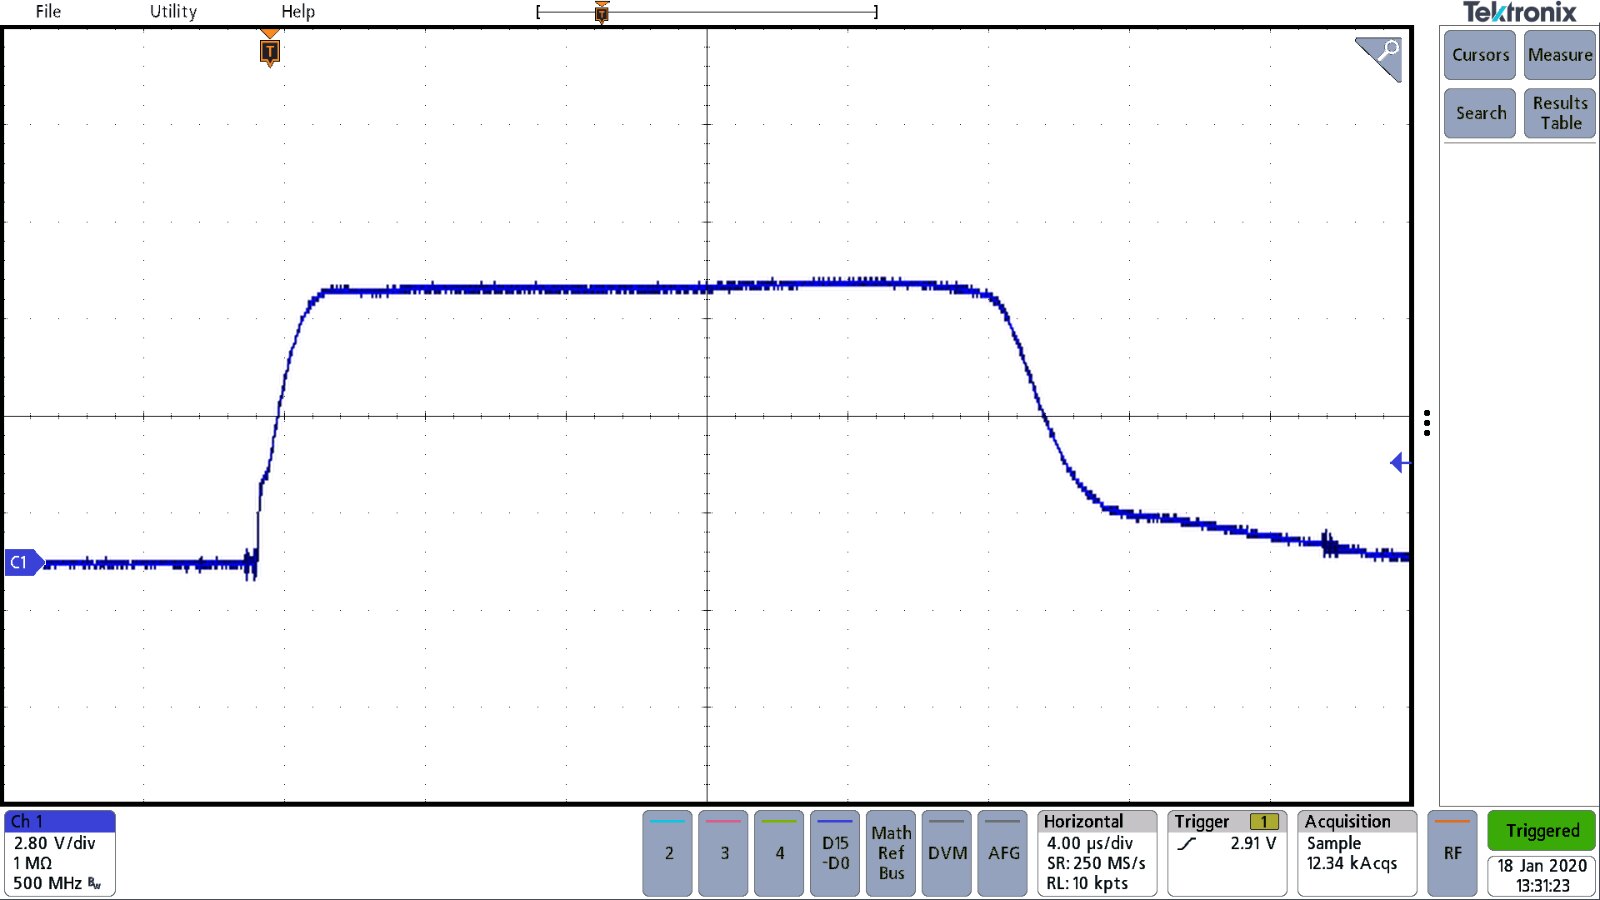
For comparison, I carried out the same test with the Riglo 1052E supplied from the Power Cube and it to showed a high level of noise on the signal.
| {gallery} RSO Test with Rigol DS1052E |
|---|
RSO Signal capture on Rigol DS1052E |
32W Power Drawn by Rigol and Reflectometer |
Screenshot of RSO Signal on Rigol |
Low Pass Filter applied to RSO Signal by Rigol maths function |


The one difference between the two oscilloscopes is that the Rigol does have a Low Pass filter function built into it, that I could use to get a more stable signal, than on the 3 Series MDO. However, once this is activated, a lot of functionality is then lost within the scope as the filter will be turned off as soon as any adjustments are made.
You can also see a huge difference in the quality of the screenshots between the 3 Series MDO and the Rigol, that will make a huge improvement to report writing in the future.
Whilst the test setup has worked, I need to do some more investigation and work to see if I can overcome the noise generated by the Power Cube. I did try the same test with the rotor reflectometer and its test delay away from site and a similar amount of noise was picked up. For some reason, when capturing the screenshots during this test, the 3 Series MDO screen flashed white and I lost a lot of detail in the screenshot as seen below.

I then altered the test setup, so that the oscilloscope was powered from the mains and the reflectometer from the Power Cube and could easily capture the RSO traces, so the noise only appears to be an issue when I power the oscilloscope from the Power Cube.
Conclusions
I think that the 3 Series has worked reasonably well in this application. Calibration checks went according to plan and the majority of the results were comparable to the usual method of using the 53220A53220A counter. Only being able to have four measurements across the two channels was a bit of a hinderance, it would be nice to be able to have a few more, especially if less than four channels are being utilised.
Capturing the traces of a test for a report were extremely easy, the size of the screen makes it much easier to see faults in comparison to the old Rigol oscilloscope. Measurements are easy to add and the coarse / fine control of the cursors makes them easy to position. For this particular test, it would be nice to have the option of just one cursor for fault marking and have the calculation and cursor B information boxes disappear from the screen if the B cursor is moved out of view, or have the option to turn it off.
Update 18th January 2020
The tests out on site were a little awkward, but this appears to be because I powered the oscilloscope from a Power Cube and not a direct mains supply. I will need to do some more work on this to see if I can find a resolution as the Power Cube is actually quite useful for power test apparatus. However the noise picked up occurred on any oscilloscope I used and not just the 3 Series MDO, so it is a global issue and not specific to the Tektronix oscilloscope.
Top Comments