RoadTest: PICOSCOPE 5444D MSO - USB Oscilloscope
Author: nermash
Creation date:
Evaluation Type: Test Equipment
Did you receive all parts the manufacturer stated would be included in the package?: True
What other parts do you consider comparable to this product?:
What were the biggest problems encountered?:
Detailed Review:
First of all, I would like to say thanks to E14 and Pico technology for giving me privilege to test this great and valuable piece of test equipment.
So far, I have only been involved in standalone scopes/DSOs and USB Logic analyzers, and I must admit that I was a little weary about USB based DSO/MSOs.
I don't like to cite all the specs, but here are some of the highlights that are interesting IMO:
* 200 MHz analog BW
* 1 GS/s sampling rate at 8 bit resolution
* Switchable resolution 8 to 16 bits
* 512 MS of sample memory
* Built in AWG
* Free serial decoding (18 major protocols)
* Waveform update rate of 130k of waveforms per second max
NOTE:
Laptop used for testing was Lenovo T570 with i7 CPU, 8 GB of RAM, and 512 GB SSD.
Please refer to titles of pictures in galleries for additional info.
In this part of reviews I usually go over the unboxing, initial overview of overall look and feel, weight, robustness, build quality, supplied accessories.
And also other impressions, calibration certification, quick guides, manuals, and of course setup and SW installation process.
MSO comes fully equipped with all the usual accessories:
4x 200MHz switchable 1x/10x probes which have a quality feel to them, although coax cable is a little stiffer than I prefer.
2x 10 min grabbers with male 0.1" headers
20 pin IDC breakout cable with female 0.1 headers for the logic analyzer
USB 3.0 cable
External power supply with all relevant adapters for worldwide use
Carrying bag
PICOSCOPE 5444D itself is well built and sturdy unit, with nicely designed rubber bumpers on front and back. No objections there.
| {gallery} Unboxing |
|---|
On the bench |
Front view |
Back view |
Switchable 1x/10x probe and accessories. |
The only thing I would like to see supplied with the probes is the grounding attachment for high speed measurements.
Software is freely downloadable from Pico technology web, it is less than 200 MB in size, installation went without any problems.
Picoscope sw is pleasant to use, and it is obvious that UI has gone through lot of refinement to get it to be this simple and straightforward when needed, and yet have a lot of options for fine tuning.
The software itself is what makes or brakes the USB oscilloscope package, and this is example on how it should be done.
Updates are free, and even before hardware arrived I played with it in demo mode.
https://www.picotech.com/downloads
In the following sections I will present examples and experiments I used to roadtest this MSO, in order to try to show it's strengths and weaknesses.
Some experiments and setups are basic demonstration of capability and some are more elaborate, depending on my own personal preference and my interests.
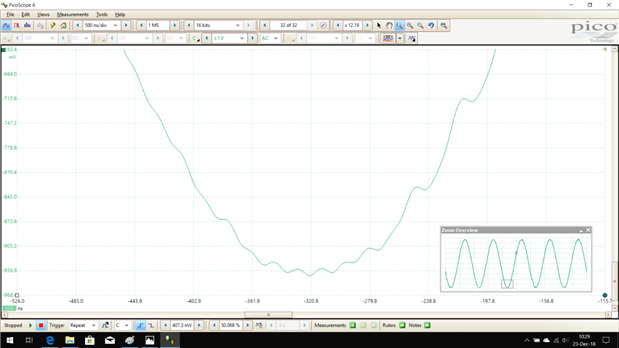
In this demo I used a 1 MHz sinewave signal with some noise or distortion appearing on the negative period.
It clearly shows the difference between 8 bit sampling and 16 bit sampling, with all other settings identical.
| {gallery} Normal vs HighRes |
|---|
8 bit sampling |
16 bit sampling |
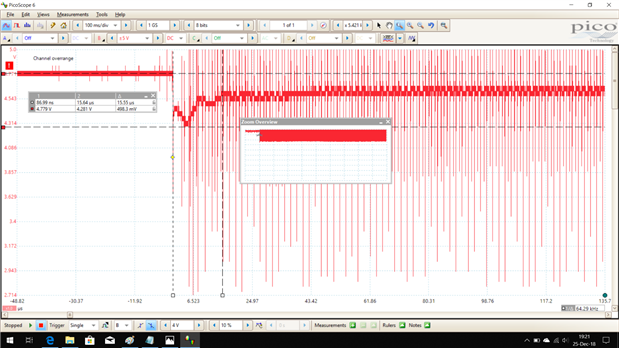
I used Picoscope 5444D to capture and evaluate startup, shutdown and 2A load transient response of a small and cheap SMPS DC-DC buck converter from Ebay (shown on fist picture).
This SMPS was fed with 12V DC, output set to 5V DC. Maximum output current is specified at 3A. EN port on the SMPS is fed with 0.1 Hz signal.
| {gallery} SMPS |
|---|
Ebay buck converter |
Startup without load. EN signal on CH1 (blue). |
Startup with 2.6A load. EN signal on CH1 (blue). Heavy noise on signals. |
Startup with 2.6A load. 1 kHz low pass filtering enabled on CH2. EN signal on CH1 (blue). |
Load transient from 0 to 2.6A. Huge levels on noise. |
Shutdown with 2.6A load. 1 kHz low pass filtering enabled on CH2. EN signal on CH1 (blue). |
No load noise on output with 20 MHz BW limit. |
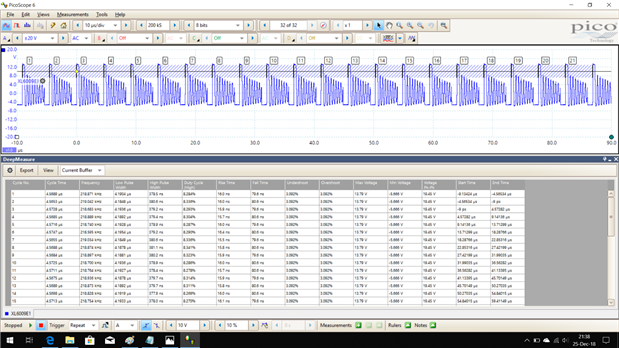
Another interesting feature of Picoscope software is the ability to display set of measurements for each cycle in a waveform captured after the trigger.
I tested this with boost SMPS module based on the XL6009E1 controller, with one analog channel connected to the SW (switching) pin.
It is possible to define the exact area of signal level and hysteresis that will be measured on each cycle.
This MSO has 3 main persistence modes: Analog intensity, Digital color and Fast. Each of them can be adjusted.
I used a AM signal of 1 MHz carrier wave modulated with 1 kHz signal to demonstrate each one of them.
However, the result is still not on par with proper intensity graded displays that are now ubiquitous even in the low end DSO market.
Still very usable representation though, for example eye diagram of high speed serial bus with both edge triggering.
| {gallery} Persistence |
|---|
AM 1 MHZ carrier 1 kHZ signal Analog intensity |
AM 1 MHZ carrier 1 kHZ signal Digital color |
AM 1 MHZ carrier 1 kHZ signal Fast |
I must admit that I had a plan to test this claim, and create a table of maximum update rates at various timebases and memory depths.
However, there is no trigger out on this scope so that I could use external counter, nor there is an option in Picoscope software to extract trigger count data.
I also tried to perform this measurement via a very clever method devised by Mark Madel (explained in details here: Simple Technique to measure Waveform Update Rates: DSOs w/either Edge Triggering - Page 1 ), however I could not get it work on the 5444D.
I am not sure whether this is because of the specific capture modes inside the hardware and then the subsequent transfer to the PC, but in any case if I manage to get this to work I will update this section.
Picoscope 5444D comes with several options for advanced triggering, beyond simple edge triggers you get:
* Advanced edge
* Window
* Pulse width
* Window pulse width
* Level dropout
* Window dropout
* Runt

On the picture above, I used window dropout trigger to get a stable representation of 1 MHz AM carrier with 1 kHz signal.
This was my first negative experience with Picoscope, I was instinctively aiming for trigger holdoff, but there is none!?
I have done extensive research, and although there were several request on the Picoscope support forum, this was never implemented.For me it is not a deal breaker, but instead of spending 10 seconds to get a stable AM signal, I spent 10 minutes searching for appropriate advanced trigger.
Also, I have made one experiment where Mbed LPC1768 is generating a 50 kHz square wave and every 5000 cycles rising pulse has a dropdown in duration of less than 1 uS.
I used pulse width trigger set to catch negative pulse with less than 1 us of duration, and it worked as it should.

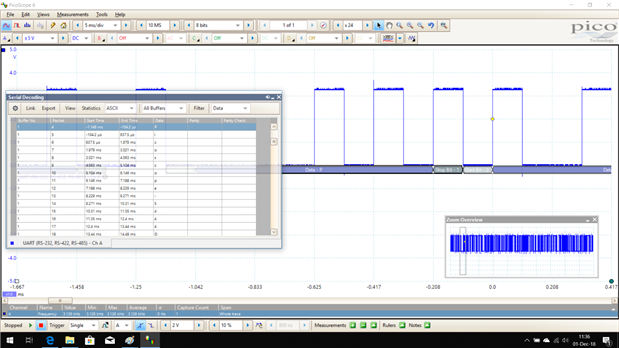
For this setup I used a Mbed LPC1768 programmed to output serial stream with string "Picoscope-5444D-RoadTest".
I used one analog channel for this, and built in UART serial decoder.
You can check out the result in the gallery bellow, in a nutshell it performed flawlessly.
| {gallery} UART Decode |
|---|
Mbed LPC1768 setup |
Decoded view |
Decoded view with table view |
Live decoded view |
In the same example as above, I used Mbed LPC1768, but this time I programmed it to read data from 24C02 serial eeprom.
Eeprom is filled with values that translate to ASCI characters "Picoscope5444D".
I used digital inputs from the 5444D to monitor the clock and data line, and built in I2C decoder with event table view.
I also monitored the data line with one analog input to spot any signal integrity issues.
In this example I used 5.6k pull up resistors
Second picture shows zoomed portion of capture with 16 bits of resolution.
While 5444D can be setup with combination of logic and digital pattern triggers, it is missing a feature that would be nice to have, and that is to trigger on a decoded serial word.
{gallery} i2c 5.6k pullup |
|---|
Mbed LPC1768 with serial eeprom |
I2C decode digital+analog with event table view |
I2C decode digital+analog with event table view + Zoom 16 bits |
Same setup as above, but this time with 150 Ohm resistors.
On the analog view it can be seen that rise time is fast, but that fall time is slow, probably due to limited current sink capacity of signal drivers on mbed, which probably caused violation of timing requirements, and thus causing the incorrectly decoded events in the table.
This example IMO is displaying a huge advantage of 5444D used in both analog and digital domain, correlation of events in domains, with high resolution, measurements and all of that displayed on a large screen.
| {gallery} i2c 150R pullup |
|---|
I2C decode digital+analog with event table view |
I2C decode digital+analog with event table view + Zoom 16 bits |
Using the same i2c decoding setup as in above two examples, I tested the segmented memory feature of the 5444D.
Segmented memory is feature on scopes enabling sequential captures of data each time when trigger conditions is met.
In this way, memory is segmented, and thus allowing for a greater number of event of interest to be captured than just letting it fill the entire memory after the first trigger.
In Picoscope this actually turned on by choosing Rapid trigger type and selecting the amount of segments you want to capture.
Here I had it set to use the maximum available memory size, totaling 3216 segments.
Scrolling and searching is easily done either via forward or back arrows, or jumping straight to the desired segment by entering the segment number.

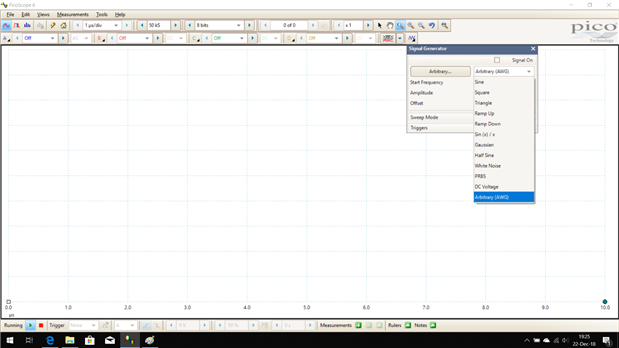
Picoscope 5444D is equiped with built in 20 MHz function and AWG, with BNC connector output on the back of the unit.
Supported functions are: Sine, square, triangle, DC voltage, ramp up, ramp down, sinc, Gaussian, half-sine.
AWG clock is 200 MHz, with 14 bits of resolutions and 32 kS of sample memory.
Usage is straightforward, with few clicks you can easily select the function, frequency, level, offset.
Sweep mode is also available, and generator can be triggered from another event in Picoscope software, allowing for all kind of setups.
Arbitrary generator is also complete and pretty to easy solution, you can import CSV file with defined waveform points, copy a waveform straight captured on on of the channels, select predefined templates, create a bitstream, or you can even create waveform by free hand.
| {gallery} AWG |
|---|
Function generator |
Arbitrary waveform generator |
Picoscope 5444D has one of the nicest FFT functionalities I have ever seen on DSOs.
It can be used as a very decent and capable spectrum analyzer up to 200 MHz.
FFT view is easily switched on, and can be adjusted in details.
I will just mention ability to choose between 128 and 1048576 spectrum bins for FFT.
This is something not seen on many other scopes.
There is also a selection of all usual and less usual windowing functions: Rectangular, Gaussian, Triangular, Blackman, Blackman−Harris, Hamming, Hann, Flat-top.
Here are couple of sceenshots of 1 kHz sine wave coming from my old generator, with THD, SFDR and SINAD measurements.
| {gallery} FFT |
|---|
1 kHz sine wave 16 bits resolution with 1024 spectrum bins |
1 kHz sine wave 16 bits resolution with 16384 spectrum bins |
Even though I spent a lot of time reviewing the 5444D, due to other things (life and familly) I never got around to play with myriad of other features available, such as ETS, mask testing, alarms, advanced math channels, custom probes configurations, etc.
But, I feel that I have spent enough time reviewing to be able to identify key strengths and weaknesses.
PROs:
CONs:
YES, for my own needs this USB scope fits the bill almost perfectly. I have already started shopping for a nice 27" monitor that can be used as a scope screen.
I can see where this scope might be less suitable for some tasks (high voltage for example), but that is to be expected with any device, there is no perfect solution for everyone.
Once again, thanks E14 and Picotech for this unique opportunity, and I wish you all a very Happy New 2019!


Top Comments
Thank you for the comment Gene, it is a well rounded and versatile combination of quality hardware and excellent software. Sorry for the late reply, I was away for the hollidays