


Table of Contents
- Introduction
- What Problems are Being Solved?
- What are Debug Probes and Serial Wire Debug (SWD)?
- Protocol Engines: Proprietary vs CMSIS-DAP
- Which Protocol Engine Should You Use?
- OpenOCD: What Is It?
- Board Connections
- Flashing Firmware into a Microcontroller with OpenOCD
- Making a Debug Probe from a Dev Board
- Using the GNU Debugger (GDB)
- Using the Debugger in VS Code
- Using PyOCD
- Summary
- For Reference
Introduction
With early microcontrollers, it was very difficult to program up the memory inside them (often it was one-time programmable, requiring unusual voltages), and troubleshooting could require using something known as an emulator which would attach in place of the real microcontroller, with a large umbilical cord to a huge external box holding the emulation circuitry for an entire processor.
Eventually, chip manufacturers resorted to producing weird-looking integrated circuits with connections on the top; these were called bond-out chips, and what they did was bring out extra connections to the surface, so that attached external circuitry could do things like read CPU registers, not normally exposed on the microcontroller’s usual connections.
All this was greatly simplified with the introduction of JTAG, which was a standardised system of serialising a load of internal connections into a format that could be read or written over just a few spare pins on the usual microcontroller package, thus no longer requiring bond-out connections placed on top.
SWD or Serial Wire Debug, which is discussed in this blog post, can be considered an ARM based fewer-wire alternative that is approximately similar to JTAG.
Technically you don’t have to use SWD, which, like JTAG, requires a small external adapter (called a debug probe) between the microcontroller and PC. Nowadays, there are many tools and methods to write to the on-chip Flash memory (and possibly to debug) ARM Cortex-M microcontrollers.
With some microcontrollers, including some ARM Cortex-M based ones, you can even omit any additional hardware tools, and use a UART connection to write to flash.
This blog post discusses what debug probe tools are, and how they can help working with Cortex-M microcontrollers. I’m going to demonstrate with just a few different products, but the information applies to nearly all Cortex-M based microcontrollers from all manufacturers, such as the RP2040 used in the Pi Pico for instance, Texas Instruments MSPM0 (Click here for detail from TI; on the left, select Arm-based Microcontrollers->training->MSPM0 Academy), and the ST STM32 microcontrollers to give another example.
What Problems are Being Solved?
At a high level, to perform things like programming Flash, or for controlling and monitoring the CPU state inside microcontrollers (so that the software developer can see how their code is running, with granularity), you need a way to interface the PC with the microcontroller, both physically, and logically at a software level. And to complicate things for hardware and software engineers, there are several methods to do it, and multiple offerings from various manufacturers.
Once code has been compiled and built (to something like a .hex file for instance, often colloquially known as a binary), there are two main problems; the first is getting binaries (i.e. your target microcontroller app firmware) into the microcontroller’s program storage space (usually Flash memory). The second is troubleshooting the application once it is inside the microcontroller.
As touched upon in the intro, the first problem can often be addressed in other ways; for instance, by using a serial bootloader that can sometimes be built-in (in ROM) into microcontrollers; the bootloader allows for users to push the binary into the microcontroller over interfaces like UART or perhaps even USB, and the microcontroller bootloader program will automatically burn it into Flash for you. This is especially useful in the field, where a user may not have many tools apart from a USB cable.
The second problem might not actually always be present! Nowadays, microcontroller software development kits (SDKs) and libraries (such as Arduino libraries) may be very well-tested, to the point where it might be unlikely that you’ll need to troubleshoot at a very low-level. You may be able to use a print library (known as stdio, short for standard input/output) and just display debug information over a UART connection onto the PC. This is not always the case, especially if printing output over UART takes too long for a real-time system.
As will be seen several times in this blog post, the end-to-end chain of hardware and software between the user and the microcontroller is complicated enough that not all combinations may work first-time, fully bug-free. It’s good to be aware of the different options, so that different things can be tried if the first chosen approach doesn’t work.
What are Debug Probes and Serial Wire Debug (SWD)?

Regarding the physical connections, at the PC end, USB is very typical. At the microcontroller end, most ARM Cortex-M based microcontrollers have physical connections called SWDIO and SWCLK, together known as a Serial Wire Debug interface (SWD). SWD instructions are all very low-level, not really of use to embedded system software developers directly. There is a specification, called ARM Debug Interface (ADI) which details the instructions, and the Architecture Reference Manual details the specific address values that are used to (say) perform an operation such as to stop or start the CPU, read the CPU registers, and so on.
Physically, a hardware tool (known as a Debug Probe) is needed to attach between USB and SWD. Most debug probes contain a microcontroller with a USB interface on one side, and buffer circuits with level translators on the other side, so that you can attach to the SWD connections of your target microcontroller, at the same voltage level as your target microcontroller uses.
The photo shows an example debug probe called MCU-Link. You can see the USB connector on one end, and the 10-pin SWD connector on the other. The other pin connections are not essential.

Here’s another example; this time, the debug probe is contained on a portion of printed circuit board (PCB) belonging to a microcontroller dev-board. ST boards tend to use a 6-pin header instead of the usual 10-pin connector mentioned earlier.

Important to note; notice there is a pin labelled VCC on the debug probes. That pin doesn’t typically supply any output. It is intended to connect to the VCC supply of the target microcontroller board, so that the debug probe can recognize that power is applied to the target, and to translate (i.e. adjust) the logic voltage levels on the SWD connections to suit the target. Not all debug probes may contain this feature, some may be fixed to (say) 3.3V logic levels.
Importantly, debug probes do not simply encapsulate/de-encapsulate SWD instructions. That would be really slow. Instead, the debug probe performs interworking, between high-level commands from the PC, to all the dozens or hundreds of low-level SWD or JTAG instructions and interactions needed to execute a single high-level command. There’s an entire protocol engine of sorts, running inside the debug probe.
Protocol Engines: Proprietary vs CMSIS-DAP
It’s up to the manufacturer of the debug probe to decide what kind of high-level commands will be accepted via USB, and how to interwork that to the SWD instructions.
There are debug probes with SWD connections from many manufacturers, and generally you can choose whichever one you like the look of, but sometimes manufacturers restrict them in some ways to particular microcontrollers, or to interact with particular software drivers or particular applications on the PC.
A very popular but proprietary debug probe family is called Segger J-Link, they can cost a fair bit (there is a non-commercial, educational version that is cheaper). Another very useful debug probe is TI’s XDS110, and that is a great choice if you’re using TI microcontrollers and TI software tools.
ARM has created a protocol engine called CMSIS-DAP that many manufacturers have adopted. The downside is that it is likely not as high performance as the proprietary choices from Segger or TI or some other manufacturer tools perhaps. The Segger J-Link can technically be switched to run in a CMSIS-DAP mode if desired, as I understand.

Which Protocol Engine Should You Use?
I believe it’s best to:
(a) use the debug probe from the manufacturer of the chip you’re using (and hence the probe will be using whichever possibly proprietary protocol engine the manufacturer chose), especially if you intend to use the manufacturer-provided software development tools or integrated development environment (IDE), or,
(b) use a Segger J-Link debug probe (usually expensive) which uses Segger’s own proprietary protocol although it may be possible to switch to CMSIS-DAP, or
(c) use an ARM ULINK debug probe (they are expensive!), or
(d) use a CMSIS-DAP debug probe (ideally CMSIS-DAP v2, because that’s faster than v1).
Incompatibilities are more likely to occur if you mix semiconductor manufacturer debug probes with different manufacturer microcontrollers as target devices. For instance, while in theory I can use ST-Link to program TI microchips, in practice there are corner cases where things may not work, and you’ll then be left wondering if it is a configuration issue, or a PC software issue, or a debug probe firmware problem.
OpenOCD: What Is It?
At the PC end, there exists an open-source piece of software called OpenOCD which can be used to talk to various different debug probes. OpenOCD supports CMSIS-DAP, J-Link and XDS110 protocol engines, amongst others. There’s an interface folder within OpenOCD software installations, which contains several dozen configuration files, to select the desired debug probe.
OpenOCD accepts even higher-level commands, and then translates them to the CMSIS-DAP or Segger or TI XDS110 relatively high-level commands. As a result, you’re able to command OpenOCD to (say) upload firmware to the microcontroller, and OpenOCD will translate that to CMSIS-DAP instructions (if say you’re using a CMSIS-DAP based debug probe), send them via USB, and then the debug probe will translate those into lots of SWD instruction interactions with the microcontroller’s internal SWD “engine” (known as a Serial Wire Debug Port). Note: the SWD engine in the microcontroller will operate regardless of what firmware the CPU is expected to run, because it’s a completely separate engine, however, it is possible for some microcontrollers to disable SWD (perhaps for security reasons, or for going into very low power modes) so the documentation for the microcontroller usually needs to be consulted.
Obtaining OpenOCD
It’s possible to find ready-built versions of OpenOCD, and sometimes it is necessary to use those if the manufacturer has made a modification to the source code. The entire debugging process from end-to-end is sufficiently complex that sometimes a tweak may be needed in OpenOCD, so it is good to be aware how to build OpenOCD yourself, just in case you need to make a change. On Windows (assuming x64 and a modern version of Windows), it’s possible to install MSYS2, then open a MINGW64 terminal, and then build OpenOCD from there, following the instructions at the OpenOCD GitHub repository. With Linux you may already have the GNU compiler installed, all ready for building apps like OpenOCD, or pre-built OpenOCD may be within a repository for your Linux distribution.
Board Connections
Ordinarily, a microcontroller board has a 10-pin connector on-board, or it may have a different connector labelled DEBUG or SWD. See the earlier diagrams for the pinout.
At a minimum, you’d connect the GND, SWDIO and SWCLK connections.
You may need to attach the nRST (*RST) wire too (it depends on the microcontroller, but it doesn’t hurt to attach it even if it was not essential).
Also, it’s very likely you need to attach a microcontroller supply rail to the VCC pin on the debug probe; that connection is used by the debug probe to set its internal level translators to match your microcontroller circuit. As mentioned earlier, some debug probes may default to 3.3V if that connection is not wired up, but you’d need to check the probe documentation.
Flashing Firmware into a Microcontroller with OpenOCD
Here’s an example of how OpenOCD can be used to flash firmware into a microcontroller. This example uses a CMSIS-DAP probe, and the target microcontroller happens to be a TI MSPM0 device.
Once the debug probe has been attached to the target microcontroller board and the board is powered up, attach the debug probe USB cable to the PC. At a command prompt, in my example scenario, the following command would be issued:
.\bin\openocd.exe -f .\share\openocd\scripts\interface\cmsis-dap.cfg -c "transport select swd" -c "adapter speed 500" -f .\share\openocd\scripts\target\ti\mspm0.cfg -c "init; program slowblink_L1105.hex verify reset exit"
That’s a long command, but it can be explained as follows;
(a) The first part of it specifies that OpenOCD is to use the CMSIS-DAP interface, and that it will be used in an SWD mode (some debug probes support JTAG instead).
(b) The adapter speed 500 requests that the SWD interface on the debug probe is to run at 500 kHz (in theory you can go much faster usually; for instance, with the XDS110, you could use a value of 10000).
(c) The target mspm0.cfg file is part of the OpenOCD installation, and is provided by the device manufacturer (TI in this example). It contains any specific configuration that may be an addition to the usual Cortex-M debug specification that OpenOCD already internally supports.
(d) Next, the init command makes OpenOCD initialize itself, connect to the debug probe and instruct the debug probe to issue some SWD instructions to attach to the target microcontroller. This command will also make OpenOCD start listening on a port (3333) for commands from external software known as GDB (GNU Debugger). GDB provides one of the optional methods for interaction with OpenOCD.
(e) Next, the program command does the bulk of the work; it results in Flash memory being erased, and the new firmware being written to the memory. After verification (comparing checkums or the written content), the reset command resets the target microcontroller so that the program can start execution. The exit command makes OpenOCD to terminate.
You can place most of the instructions into a file in the boards sub-folder in the OpenOCD installation. For instance, in my case, I am using a board called easyL1105, so I could create a file called easyL1105_cmsisdap.cfg and place the following in it:
source [find interface/cmsis-dap.cfg]transport select swdadapter speed 500source [find target/ti/mspm0.cfg]
Now the command line is simplified to:
.\bin\openocd.exe -f .\share\openocd\scripts\board\easyL1105_cmsisdap.cfg -c "program fastblink_L1105.hex verify reset exit"
Making a Debug Probe from a Dev Board
Check out Jan Cumps blog post where he describes a Cheap debugger ($6) for EasyL1105 MSPM0 board which takes advantage of the fact that TI placed a complete XDS110 debug probe on a low-cost dev board.
Here’s another example, this time using the ST-Link debug probe that is built-in to ST Nucleo dev boards. There are some color-code conventions for SWD, but they are not of much use if everyone has different-colored wires at hand usually, so as far as I’m concerned it’s best to choose something you won’t forget. I like using yellow for clock signals, and blue for reset, for instance. I also used a low-cost P-Touch label printer and printable heatshrink from AliExpress in this example.

Note that unlike CMSIS-DAP based probes, the ST-Link ones require a device driver, or other messing about. The ST-Link driver for Windows is here (download and extract the zip file, then when you insert the USB connector into your PC, you’ll see ST-Link Debug appear in your Windows Device Manager with an exclamation mark; double-click it and let Windows install the driver, by selecting the folder where you extracted the zip file).
It is also highly recommended to perform a firmware upgrade of the debug probe; they are complex enough that there’s a high chance there is a firmware fix in-between the time the probe goes to the distributor/reseller and the time you purchase it. In the case of ST debug probes, the firmware can be updated by running the ST-Link updater software here.
When using OpenOCD, if the debug probe doesn’t use CMSIS-DAP internally, then you’ll need to select a different interface on the command line, for instance:
.\bin\openocd.exe -f .\share\openocd\scripts\interface\stlink.cfg -c "transport select swd" -c "adapter speed 500" -f .\share\openocd\scripts\target\ti\mspm0.cfg -c "init; program slowblink_L1105.hex verify reset exit"
Using the GNU Debugger (GDB)
If you have a debug probe, it is also worth being aware of GDB!
GDB (PDF guide/cheat-sheet) is one of the flagship pieces of open-source software created in the past few decades, used throughout industry, during software development and debugging.
In brief, GDB can provide the engineer with a command-line interface that allows them to run the software they have developed, and halt it, step through instructions one-at-a-time, and see the CPU registers and memory content down to individual bits and bytes. GDB can allow the user to step through each line of code and see the results and inspect variables. It’s actually more powerful than this; even without a debug probe, GDB can allow you to explore how software crashed, by letting the engineer decipher the contents of RAM (it’s up to you how you get the contents of RAM sent to GDB to explore; it could be in a file, known as a core or crash dump for instance). GDB is used for low-level troubleshooting of massive industrial or enterprise systems as well as of smaller embedded systems.
When would you use GDB? It’s not for everyday software development, because of how low-level it is. GDB is most useful when troubleshooting software that has not reached the maturity stage where sufficient debug information is available through other means, such as printing data via UART or displaying an error message on an LCD screen. GDB is also invaluable when developing operating system kernels, or for examining crashing systems, as mentioned earlier.
For best results, the target microcontroller application needs to be built with debug flags during compilation. Here is an example makefile that could be inspected. https://github.com/shabaz123/easyL1105/blob/main/MyStarterProject/app_L1105/gcc/makefile
GDB can be run graphically (as discussed in the next section, and it's far simpler), or from the command line.
To use GDB from the command line with a microcontroller, usually OpenOCD is run first; in this example, I’ve just passed the board file as a command-line parameter:
\bin\openocd.exe -f .\share\openocd\scripts\board\easyL1105_cmsisdap.cfg
That command will result in OpenOCD opening up a port (3333) and listening for a connection from GDB.

In another window, GDB can be run; it is normally installed as part of the ARM GNU toolchain that contains the GCC compiler among other software development tools. If you’re using Windows PowerShell, you’ll need to type a command similar to:
& $env:GCC_ARMCOMPILER_MSP\bin\arm-none-eabi-gdb.exe .\app_L1105.out -ex "target extended-remote localhost:3333" -ex "monitor reset halt"
What that command is doing, is running GDB and instructing it to connect to OpenOCD, and then pass a reset halt command to OpenOCD, which (obviously) causes the target microcontroller to reset, and then halt as soon as possible (before the main() function executes).

After that, you can type various commands at the (gdb) prompt.
| GDB Command | Description |
| monitor reset halt | Send reset halt command to OpenOCD to reset and immediately halt the target microcontroller |
| load | Program the target microcontroller flash (not necessary if your microcontroller is already running the latest code) |
| break main | Insert a breakpoint at the function called main (or whichever function you specify) |
| continue | Run the code, stopping at any breakpoint. The next line of code that will execute is printed to the screen (it is yet to execute). |
| next | Run the next line of code (i.e. the line of code that is likely already displayed earlier) |
| step | Run the next line of code, but step into it if it is a function |
| finish | Run code until the current function returns (this command is useful if you’ve accidentally stepped inside a function that you wish to get out of) |
| until | A useful command if the code is looping, but you wish to run the code up to the point the code goes past the loop |
| list | Display the surrounding lines of code (useful for getting your bearings) |
| where | Display the current function name, and then the function that called it, and so on. You can alternatively type backtrace, or bt, these are the same as where |
| delete | Remove all breakpoints |
|
print i |
Prints the value of variable i (or whichever variable name you specify from your source code); if you use the ampersand before the variable name, you’ll be able to print the address of the variable in memory (you can also do this with function names) |
| info locals | Displays the values of all local variables |
| info registers | Useful in extreme circumstances where you need to see the CPU register contents rather than variables |
| disassemble /mr main | Displays the assembler code that makes up the main function (or whichever function you specify) |
| x/32xb &i x/32xb &main x/32xb 0x100 |
Displays 32 bytes (from Flash or RAM, depending on address) of the address of variable i, or the address of the main function, or from address 0x100 |
| quit | Exit GDB |
As an example, the screenshot below shows GDB being used to show the disassembly of a main function in some code:

Using the Debugger in VS Code
The excellent VS Code has a graphical interface and it can run GDB. To use it, first ensure that a VS Code extension called cpptools is installed.

You’ll need to create a file called .vscode/launch.json from your project folder. It will need to look something like this:
{
  "version": "0.2.0",
  "configurations": [
    {
      "name": "GDB via OpenOCD",
      "type": "cppdbg",
      "request": "launch",
      "program": "${workspaceFolder}/gcc/app_L1105.out",
      "cwd": "${workspaceFolder}",
      "MIMode": "gdb",
      "miDebuggerPath": "${env:GCC_ARMCOMPILER_MSP}/bin/arm-none-eabi-gdb.exe",
      "setupCommands": [
        { "text": "file \"${workspaceFolder}/gcc/app_L1105.out\"" },
        { "text": "target extended-remote localhost:3333" },
        { "text": "monitor reset halt" },
        { "text": "tbreak *main" }
      ],
      "externalConsole": false
    },

    {
      "name": "GDB with Load via OpenOCD",
      "type": "cppdbg",
      "request": "launch",
      "program": "${workspaceFolder}/gcc/app_L1105.out",
      "cwd": "${workspaceFolder}",
      "MIMode": "gdb",
      "miDebuggerPath": "${env:GCC_ARMCOMPILER_MSP}/bin/arm-none-eabi-gdb.exe",
      "setupCommands": [
        { "text": "file \"${workspaceFolder}/gcc/app_L1105.out\"" },
        { "text": "target extended-remote localhost:3333" },
        { "text": "monitor reset halt" },
        { "text": "load" },
        { "text": "monitor reset halt" },
        { "text": "tbreak *main" }
      ],
      "externalConsole": false
    }
  ]
}
In brief, that file contains two configurations, both of which have type cppdbg which are associated with the cpptools extension. The extension will launch the GDB debugger in the background for you, however, OpenOCD still needs to be run manually (this could be automated, but it’s easier to just do it manually):
C:\dev\tools\openocd_mspm0\bin\openocd.exe -f C:\dev\tools\openocd_mspm0\share\openocd\scripts\board\easyL1105_cmsisdap.cfg
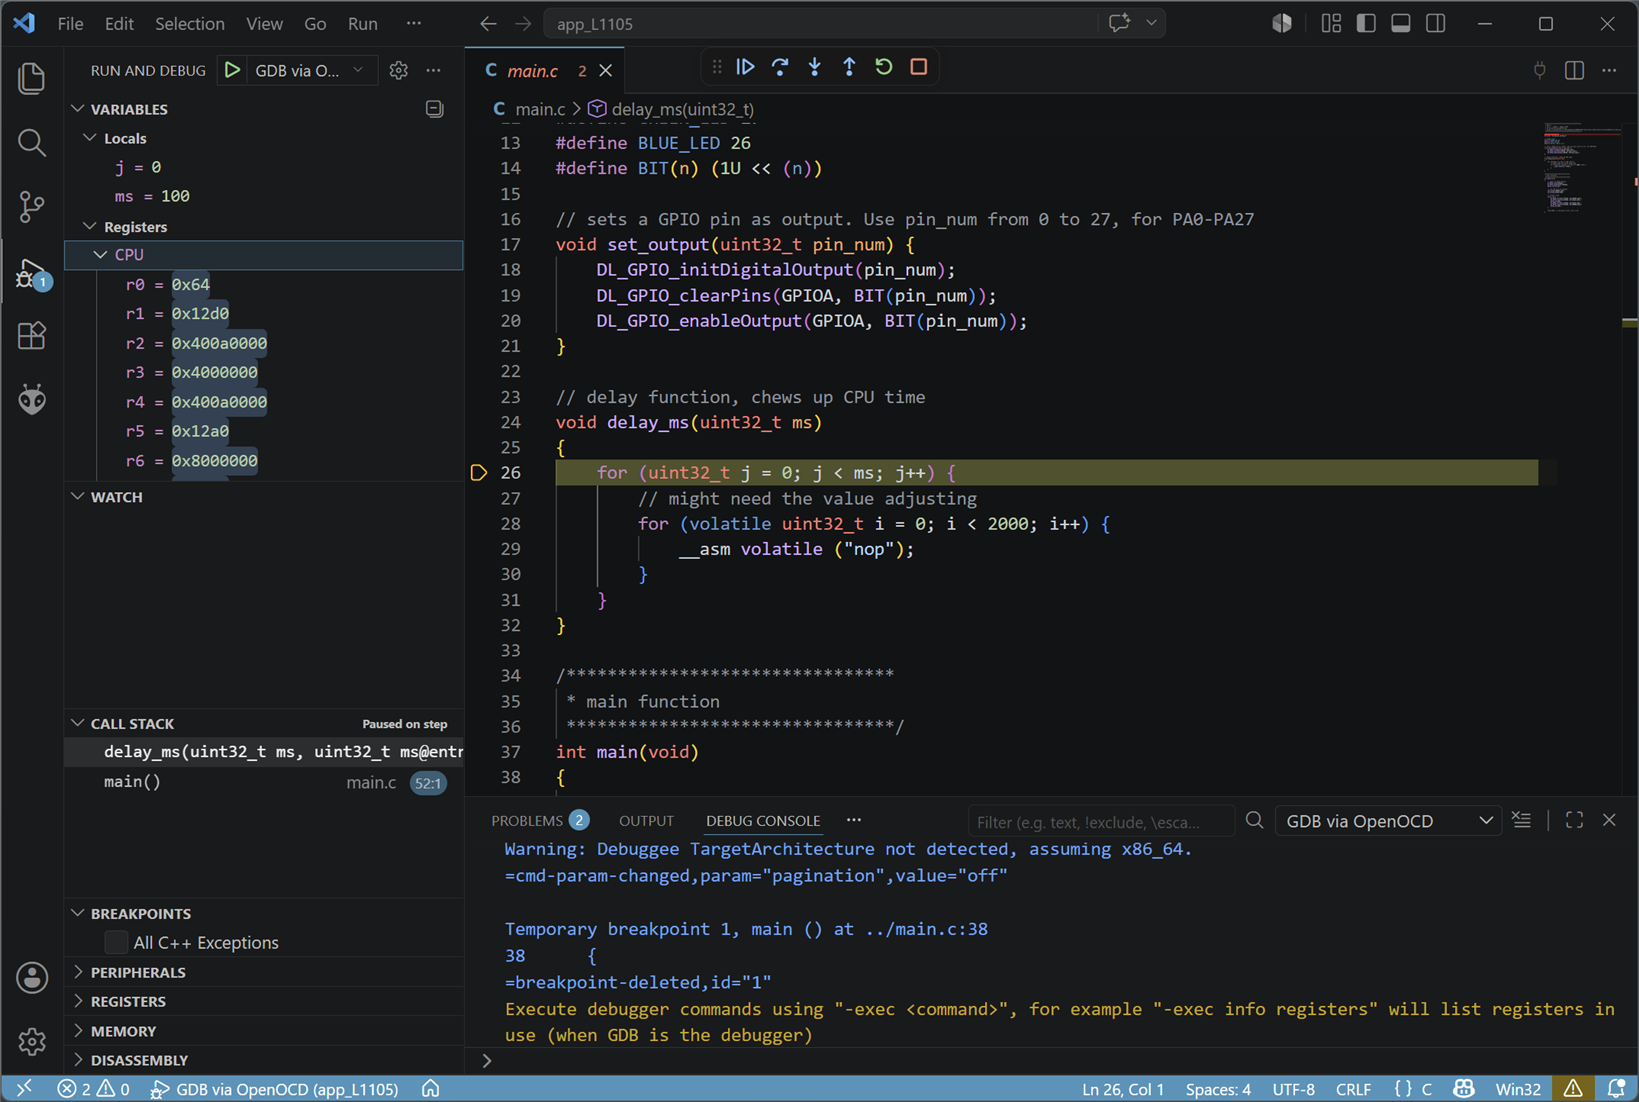
Use Open Folder to view the project source code in VS Code, and then when you’re ready to debug, press Ctrl-Shift-D and you’ll see the configuration listed alongside a green run triangle, to the left of the code pane. Click the triangle, then after some seconds, the view should display the code halted at the main breakpoint. There are buttons at the top to continue running or step into functions, and so on. Variables are listed on the left.
Using PyOCD
Instead of OpenOCD, there is alternative software called PyOCD. To use it, you’ll need to type the following on the PC:
pip install pyocd libusb-package pyusb
With the debug probe plugged into the PC, type:
pyocd list -vv
You should see something like this with a CMSIS-DAP based probe:
# Probe/Board Unique ID Target------------------------------------------------------------------------------------ 0 NXP Semiconductors MCU-LINK (r0FB) CMSIS-DAP V3.172 WKCHDS3D4NLHZ n/a
With the ST-Link probe discussed earlier, you may see something like this:
# Probe/Board Unique ID Target---------------------------------------------------------------- 0 STM32 STLink 066EFF323239524257135724 ︎ stm32f412xg NUCLEO-F412ZG
If you’re using Windows and don’t see a probe listed, you may be hitting a problem with some versions of Python, in that libusb doesn’t correctly work, even though it appears to be installed. The solution is to download libusb-1.0 from https://github.com/libusb/libusb/releases/tag/v1.0.27 (it will be a file with a name like libusb-1.0.27.7z) and extract it, then go to the extracted sub-folder called VS2022\MS64\dll and then copy the libusb-1.0.dll file from there, and paste it into the C:\Windows\System32 folder.
A nice improvement from OpenOCD is that PyOCD relies on CMSIS Device Family Packs (DFPs) which are available for almost every ARM Cortex-M microcontroller, and you can usually just refer to the microcontroller part code to find what you need to type.

You can search for the pack on the ARM website as shown in the screenshot above, or, alternatively, simply let PyOCD search and install it (the first time it takes several minutes while it processes an index):
pyocd pack find rp2040pyocd pack install rp2040pyocd list --targets | findstr /i rp2040

Now the microcontroller can be programmed using a command such as:
pyocd flash --target rp2040 .\blink.hex

PyOCD can be used with GDB. For instance, same as the earlier example, if using VS Code for a graphical debugger, create the following type of content in a launch.json file in a .vscode folder:
{
  "version": "0.2.0",
  "configurations": [
    {
      "name": "Debug with a GDB Server",
      "type": "cppdbg",
      "request": "launch",
      "program": "${workspaceFolder}/build-Debug/blink.elf",
      "cwd": "${workspaceFolder}",
      "MIMode": "gdb",
      "miDebuggerPath": "${env:PICO_TOOLCHAIN_PATH}/bin/arm-none-eabi-gdb.exe",
      "setupCommands": [
        { "text": "file \"${workspaceFolder}/build-Debug/blink.elf\"" },
        { "text": "target extended-remote localhost:3333" },
        { "text": "monitor reset halt" },
        { "text": "tbreak *main" }
      ],
      "externalConsole": "false"
    }
  ]
}
Then, on a command line, start up PyOCD:
pyocd gdbserver --port 3333 --target rp2040

Now, just as mentioned in the earlier section, in VS Code, press Ctrl-Shift-D and then click on the green debug triangle. The above example assumes that the debug build code has been flashed into the microcontroller beforehand, using (say) the pyocd flash command as already discussed.
Summary
Although you can get away with very few hardware tools nowadays for programming and debugging embedded software at a high level, sometimes you need granularity and performance, and print statements in the code may not be practical if it slows down the system too much.
The SWD connections on ARM microcontrollers allow a user to program the Flash memory, and to troubleshoot using industry-standard software called GNU Debugger (GDB). Segger J-Link and CMSIS-DAP based debug probes, amongst others, can be used to attach the PC, but often it’s best to use the same manufacturer debug probe as the target chip manufacturer, so that you have the option to use the manufacturer-supplied development and troubleshooting software (IDE). Such approaches are often the smoothest and most likely-to-work, because the manufacturer will have already tested their combination of hardware tools and software.
Alternatively, free software called OpenOCD or PyOCD can be used from the command-line, to connect to the debug probe and then program the binary file into the microcontroller. This technique is great if you have an aversion to the manufacturer-supplied tools (sometimes they are slow or bloated!) and might be especially useful for scripting thing up and for automation, perhaps if the manufacturer-supplied solution doesn’t include an interface (API).
For debugging, OpenOCD or PyOCD can be run in a server mode, ready for GDB software to attach to it. GDB can be used from the command line, although it’s far easier to just run VS Code instead, and by using a cpptools extension and setting up a .vscode/launch.json file, VS Code will automatically run GDB internally, and attach to OpenOCD or PyOCD, and will present icons for stepping through code, and observing variable contents.
Various config and command-line examples were given for a couple of debug probes and a few target microcontrollers. If you give it a shot, and have examples, or have feedback about debug probes or other tools and tricks you have found useful, please do share them, since things can be improved.
Thanks for reading!


