element14 Community
element14 Community
    Register Log In
  • Site
  • Search
  • Log In Register
  • Community Hub
    Community Hub
    • What's New on element14
    • Feedback and Support
    • Benefits of Membership
    • Personal Blogs
    • Members Area
    • Achievement Levels
  • Learn
    Learn
    • Ask an Expert
    • eBooks
    • element14 presents
    • Learning Center
    • Tech Spotlight
    • STEM Academy
    • Webinars, Training and Events
    • Learning Groups
  • Technologies
    Technologies
    • 3D Printing
    • FPGA
    • Industrial Automation
    • Internet of Things
    • Power & Energy
    • Sensors
    • Technology Groups
  • Challenges & Projects
    Challenges & Projects
    • Design Challenges
    • element14 presents Projects
    • Project14
    • Arduino Projects
    • Raspberry Pi Projects
    • Project Groups
  • Products
    Products
    • Arduino
    • Avnet Boards Community
    • Dev Tools
    • Manufacturers
    • Multicomp Pro
    • Product Groups
    • Raspberry Pi
    • RoadTests & Reviews
  • About Us
  • Store
    Store
    • Visit Your Store
    • Choose another store...
      • Europe
      •  Austria (German)
      •  Belgium (Dutch, French)
      •  Bulgaria (Bulgarian)
      •  Czech Republic (Czech)
      •  Denmark (Danish)
      •  Estonia (Estonian)
      •  Finland (Finnish)
      •  France (French)
      •  Germany (German)
      •  Hungary (Hungarian)
      •  Ireland
      •  Israel
      •  Italy (Italian)
      •  Latvia (Latvian)
      •  
      •  Lithuania (Lithuanian)
      •  Netherlands (Dutch)
      •  Norway (Norwegian)
      •  Poland (Polish)
      •  Portugal (Portuguese)
      •  Romania (Romanian)
      •  Russia (Russian)
      •  Slovakia (Slovak)
      •  Slovenia (Slovenian)
      •  Spain (Spanish)
      •  Sweden (Swedish)
      •  Switzerland(German, French)
      •  Turkey (Turkish)
      •  United Kingdom
      • Asia Pacific
      •  Australia
      •  China
      •  Hong Kong
      •  India
      •  Korea (Korean)
      •  Malaysia
      •  New Zealand
      •  Philippines
      •  Singapore
      •  Taiwan
      •  Thailand (Thai)
      • Americas
      •  Brazil (Portuguese)
      •  Canada
      •  Mexico (Spanish)
      •  United States
      Can't find the country/region you're looking for? Visit our export site or find a local distributor.
  • Translate
  • Profile
  • Settings
Experts, Learning and Guidance
  • Technologies
  • More
Experts, Learning and Guidance
Ask an Expert Forum PNBC006 WENGLOR DISTANCE LASER SENSOR RPi interfacing trouble
  • Blog
  • Forum
  • Documents
  • Leaderboard
  • Files
  • Members
  • Mentions
  • Sub-Groups
  • Tags
  • More
  • Cancel
  • New
Join Experts, Learning and Guidance to participate - click to join for free!
Actions
  • Share
  • More
  • Cancel
Forum Thread Details
  • State Verified Answer
  • Replies 21 replies
  • Subscribers 288 subscribers
  • Views 3921 views
  • Users 0 members are here
Related
See a helpful answer?

Be sure to click 'more' and select 'suggest as answer'!

If you're the thread creator, be sure to click 'more' then 'Verify as Answer'!

PNBC006 WENGLOR DISTANCE LASER SENSOR RPi interfacing trouble

AZ87
AZ87 over 2 years ago

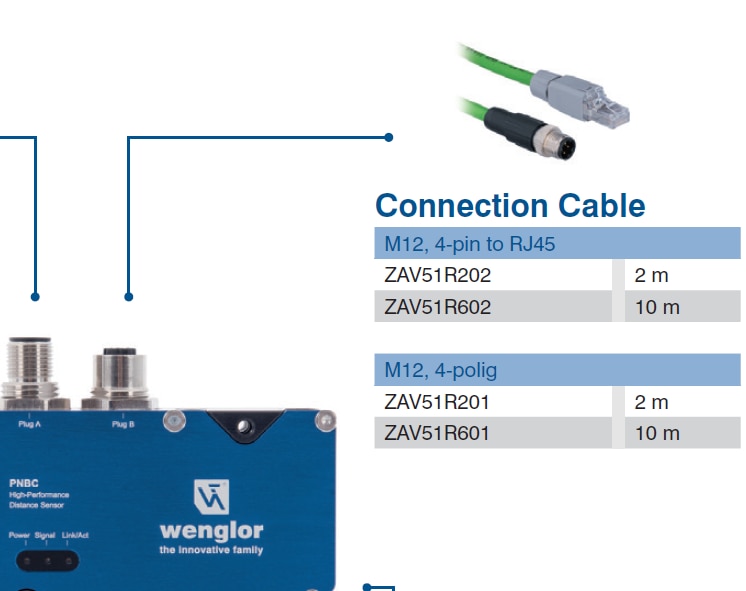
Anybody has an idea on how to read the measurements made by an industrial sensor using a raspberry pi??? I've already posted the same question somewhere in the forum but did not get any answer, so i thought Ive posted in the wrong place and here I am; first of all please don't judge me and HATE me if my question may sound ridiculous to you, i am a complete newbie to this field: i need to get the readings of this sensor through rasberry Pi and i have no clue; it is a  Wenglor PNBC006 Laser Distance Sensor and after many many days hunting on the web, i came across some documentation stating that this industrial sensor supports 2 type of connections: an M12 8pin cable AND an Ethernet cable. I figured out i can just connect it through an industrial Ethernet switch and make the communication with raspberry pi through the ETHERNET plug on it; from the official docs of Wenglor I can access the sensor settings and configuration panel through the IP address (which is provided) with a normal browser. My dilemma and biggest trouble is HOW DO I READ THE VALUES OF THE SENSOR WITH RASPBERRY PI? PLEASE HELP ME OR POIT IN THE RUGHT DIRECTION

MQNY THANKS Pray tone5

  • Sign in to reply
  • Cancel

Top Replies

  • shabaz
    shabaz over 2 years ago +1
    Hi, You've double-posted, once in "EAGLE CAD" which makes no sense. That sensor cannot interface directly to the Raspberry Pi. The sensor has an analog interface, and the Pi doesn't. You mention…
  • mp2100
    mp2100 over 2 years ago +1
    This device appears to work best with a PLC. Programable Logic Controller. The documents specifically mention Siemens PLC. Step7 or TIA Portal. The device outputs 4 to 20 mA. The industry standard for…
  • beacon_dave
    beacon_dave over 2 years ago in reply to shabaz +1
    It looks like if you connect to TCP port 3000 instead of the web server, then you can get a continuous data stream. For monitoring they appear to recommend using their wTeach software over the web…
Parents
  • mp2100
    0 mp2100 over 2 years ago

    This device appears to work best with a PLC. Programable Logic Controller. The documents specifically mention Siemens PLC. Step7 or TIA Portal. The device outputs 4 to 20 mA. The industry standard for PLCs. It can also send ethernet data through its m12 port, which is an industrial ethernet connector. But not for a raspberry pi. 

    • Cancel
    • Vote Up +1 Vote Down
    • Sign in to reply
    • Verify Answer
    • Cancel
  • beacon_dave
    +1 beacon_dave over 2 years ago in reply to mp2100
    mp2100 said:
    It can also send ethernet data through its m12 port, which is an industrial ethernet connector. But not for a raspberry pi. 

    Sounds like it uses a 100Mbps Ethernet connection just with a rugged connector.

    image

    image

    So just need the appropriate RJ45 adapter cable ?

    image

    If the OP is already connecting to it via a web browser, then I think they have established connectivity however. Slight smile

    • Cancel
    • Vote Up +1 Vote Down
    • Sign in to reply
    • Reject Answer
    • Cancel
  • AZ87
    0 AZ87 over 2 years ago in reply to beacon_dave

    First of all thank you very much for your input beacon_dave  ; Infact i  managed to connect it to access the config/settings through the web browser and i also can see the readings; the question is how do I get those readings controlled by let say a python script using RPi? Any help would be appreciated 

    • Cancel
    • Vote Up 0 Vote Down
    • Sign in to reply
    • Verify Answer
    • Cancel
  • beacon_dave
    0 beacon_dave over 2 years ago in reply to AZ87

    The Raspberry Pi Foundation created a free course on this area which might be a good starting point ?

    Networking with Python: Socket Programming for Communication
    https://www.futurelearn.com/courses/networking-with-python-socket-programming-for-communication

    • Cancel
    • Vote Up 0 Vote Down
    • Sign in to reply
    • Verify Answer
    • Cancel
  • colporteur
    +1 colporteur over 2 years ago in reply to AZ87

    Careful you getting dangerously close to the edge of doing something you didn't think you were capable of doing.

    I think this is a great project to get your feet wet. If it is something you like doing. The folks that hang out here are a great resource as you may have discovered.

    I suggest you frame how what you think needs to be done and then identify your knowledge level. Let's try and avoid it being overly complicated this first time. It will take some time to work through but I believe it is doable.

    • Cancel
    • Vote Up -1 Vote Down
    • Sign in to reply
    • Reject Answer
    • Cancel
  • AZ87
    0 AZ87 over 2 years ago in reply to colporteur

    Hi there, thank you for the input colporteur  as i mentioned previously I managed to access the web portal of the sensor where I can actually play with the values&settings& configurations...and it is all done through the IP address which is assigned to the sensor by the company itself. So for this i just needed a normal Ethernet connection and access the IP address with a normal browser. Till here worked just fine.

    Now, the real challenge and REAL TROUBLE for me at least, is  getting  those sensor readings interact with raspberry pi, i mean I have the need manage those reading in such a way that I can write down a python script using the readings values: and here I'm completely lost.

    I was thinking of actually phisically attach wires to M12 8 pin cable in such a way that i would reproduce this type of schematic: from my understanding it should work and if it doesn't the i really surrender, it has been a wild wild wild ride of frustration not being able to figure out how to interface the sensor with Pi; here is what I'm trying to do:

    image

    This is the actual https://electronics.stackexchange.com/questions/394248/how-to-connect-an-industrial-24v-sensor-to-a-3-3v-input-raspberry-pi-pin

    If you read through, the guy of this schematics intends reduce the 24V of the sensor Output to a 3.3V signal ant then feed it to the Pi: this is roughly my idea and I'm planning to do it with an octocoupler! OBVIOUSLY I AM OPEN TO ANY HELP OR SUGGESTIONS AS TO DO THIS OR ANYTHING ELSE THAT ALLOW TO get readings into the Pi

    • Cancel
    • Vote Up 0 Vote Down
    • Sign in to reply
    • Verify Answer
    • Cancel
  • shabaz
    0 shabaz over 2 years ago in reply to AZ87

    Hi,

    You don't need to do this. Dave above has provided you with the solution:

    image

    image

    • Cancel
    • Vote Up +1 Vote Down
    • Sign in to reply
    • Verify Answer
    • Cancel
  • beacon_dave
    0 beacon_dave over 2 years ago in reply to AZ87

    If you Telnet into it on port 3000 from the R Pi you should be able to issue a command like:

       get_serial<CR>

    or

       get_hwversion<CR>

    and get some sort of a response.

    However after that you are down to a bit of programming to get the data 

    Writing a TCP Client
    https://www.oreilly.com/library/view/python-cookbook/0596001673/ch10s02.html

    and then you need to plot it.

    • Cancel
    • Vote Up 0 Vote Down
    • Sign in to reply
    • Verify Answer
    • Cancel
  • colporteur
    0 colporteur over 2 years ago in reply to AZ87

    If you are getting data from the sensor in a web browser you are a long way ahead.

    Instead of displaying the data in the browser you want it written to a file?

    Can you confirm, I may be over simplifying things?

    Now for a teachable moment:

    On your Pi install an text only browser. You may not of heard of them but they exist.

    sudo apt update

    sudo apt upgrade

    sudo apt install lynx

    From the command line type lynx <website URL>. to test use microsoft.com. Take a look at the page in a regular browser and see it in lynx.

    Lynx ignores graphics and focuses on the text. I'm curious how your sensor data looks if lynx handled it.

    • Cancel
    • Vote Up 0 Vote Down
    • Sign in to reply
    • Verify Answer
    • Cancel
Reply
  • colporteur
    0 colporteur over 2 years ago in reply to AZ87

    If you are getting data from the sensor in a web browser you are a long way ahead.

    Instead of displaying the data in the browser you want it written to a file?

    Can you confirm, I may be over simplifying things?

    Now for a teachable moment:

    On your Pi install an text only browser. You may not of heard of them but they exist.

    sudo apt update

    sudo apt upgrade

    sudo apt install lynx

    From the command line type lynx <website URL>. to test use microsoft.com. Take a look at the page in a regular browser and see it in lynx.

    Lynx ignores graphics and focuses on the text. I'm curious how your sensor data looks if lynx handled it.

    • Cancel
    • Vote Up 0 Vote Down
    • Sign in to reply
    • Verify Answer
    • Cancel
Children
  • AZ87
    0 AZ87 over 2 years ago in reply to colporteur

    Thank you SO MUCH everyone involved. Assuming that Dave was right, meaning that i can telnet into port 3000(from Pi terminal) and get a continuous stream of data, would this piece of basic code be helpful on streaming the values back to my terminal?

    import telnetlib

    #here i establish the connection 

    tn = telnetlib.Telnet("192.168.1.10", 3000)

    while True:

        # a loop 4 continuous reading 

        data = tn.read_until(b"\n").decode().strip()

        # show me the received data

        print(data)


    If I ever manage to get this code running and do what it is suppose to do, then it will bi BINGO....can any body please confirm or deny this?Pray tone5Pray

    • Cancel
    • Vote Up 0 Vote Down
    • Sign in to reply
    • Verify Answer
    • Cancel
  • beacon_dave
    0 beacon_dave over 2 years ago in reply to AZ87

    The Telnet suggestion was for quick testing of the connection on port 3000 and getting text data responses from the  command line.

    If you read that data sheet you will see that once you go into continuous mode you will get mixed format data returned:

    image 

    which the Telnet protocol will be less useful for. 

    However if there is a command that returns just the measurement you are after as ASCII text, then your solution could work.

    Have you done the R Pi on-line Network programing course yet ? as that will get you up to speed with communication over TCP/IP. It is advertised as a several week course but you can cover it in a couple of hours in one go.

    How are you planning on plotting the profile from the data ? using the line drawing of Tkinter / Pygame or perhaps creating SVG and displaying it in a web browser ? 

    There is a book that uses Tkinter in Python for instrument type GUI which may be of interest:
    https://www.elektor.com/python-3-programming-and-guis

    • Cancel
    • Vote Up 0 Vote Down
    • Sign in to reply
    • Verify Answer
    • Cancel
  • AZ87
    0 AZ87 over 2 years ago in reply to beacon_dave

    Thank you so much for the fantastic resources; I am exploring for now the possibilities in front of me and definitely planning to get a deep dive into python programming in general and TCP/IP networking Pray tone5with it!Pray tone5Pray

    For the plotting part i find out that there is "matplotlib" library which is pretty straightforward in using it with python and it is also for 2D representation which what Im looking for;

    For the moment I'm focusing on how to get those data into RPi and use them as I wish...an incredibly hard and frustrating task: never thought manufacturers could make life so hard in order to get thDisappointedr product interface an other external microcontroller DisappointedPensive !!!what a sadness....Muscle tone2

    • Cancel
    • Vote Up 0 Vote Down
    • Sign in to reply
    • Verify Answer
    • Cancel
  • beacon_dave
    0 beacon_dave over 2 years ago in reply to AZ87

    As far as device control over TCP goes, that is a pretty standard implementation.

    • Connect to the IP address + port
    • Send a command (in the specified format)
    • Receive the response (in a specified format)
    • Parse the response to get the data
    • ...
    • Cancel
    • Vote Up +1 Vote Down
    • Sign in to reply
    • Verify Answer
    • Cancel
  • AZ87
    0 AZ87 over 2 years ago in reply to beacon_dave

    Do you think it would be possible to use this info (screenshot below)

    image

    manipolate the data received in order to filter out just the info relative to distance (the 16bit value) and re-use the same formula reported in order to get the conversion into mm?

    I mean, using the commands (cli ) reported in manual, i can get a ' continuous stream of data ' and among the info there should be a 16bit value which represents distance (in bits); once i know oDizzy face is among the data stream, i can isolate it and make the conversion so i will get my distance in mm....doest it make sense or am tripping in here?Dizzy face‍DizzyDisappointedDizzy face‍DizzyCall me tone2

    • Cancel
    • Vote Up 0 Vote Down
    • Sign in to reply
    • Verify Answer
    • Cancel
  • beacon_dave
    0 beacon_dave over 2 years ago in reply to AZ87

    Yes, it is possible to use that data, it is why it is provided.

    You need to parse the data returned by the sensor though to get it, as it is contained within a much larger block of data.

    Looking at the data sheet you will see that the data is sent as up to 994 bytes of data split into two packages of up to 496 and 498 bytes.

    The first 94 bytes is header information and the rest is measurement data.

    image 

    Bytes 0, 1, 2 and 3 of the header data tell you the data type and for continuous data this should match the value of 17520. If this is not the case, then discard the data.

    Bytes 66 and 67 of the header data tell you the measurement range lower limit (needed for later calculation)

    Bytes 68 and 69 of the header data tell you the measurement range (needed for later calculation)

    Bytes 94 and 95 of the header data tell you the number of distance measurements that are included in the data returned and that can vary from 1 to 450. (you may be able to set this value somewhere beforehand as part of the sensor configuration)

    Each of these measurements are 16bit data values so will be in two consecutive bytes. Note:

    image

    The low byte comes first, then the high byte, so you need to be careful of that when interpreting the data as 16bit values.  

    Then you apply the formula (using the values in bytes 66,67,68, and 69 from the header) to calculate the value in mm which you can then plot in matplotlib.

    • Cancel
    • Vote Up 0 Vote Down
    • Sign in to reply
    • Verify Answer
    • Cancel
  • AZ87
    0 AZ87 over 2 years ago in reply to beacon_dave

    THAT'S EXACT THE PLAN and I was just waiting for your confirmation Pray tone5Clap tone5V tone5TadaClap tone5Pray tone5 I'll DIVE IN!!FULL IMMERSION!! THANK YOU SOOOO MUCH!! I LOVE YOU GUYS FROM THE DEEP OF MY HEAR!!Ok hand tone5Raised handsPray tone5PrayHearts️

    • Cancel
    • Vote Up 0 Vote Down
    • Sign in to reply
    • Verify Answer
    • Cancel
  • beacon_dave
    0 beacon_dave over 2 years ago in reply to beacon_dave

    Looks like you can set the number of distance measurements per packet to 1 which might make it easier for you to work with initially, as you can treat it as 98 bytes and receive/parse it as a single block of data containing unique parameter/value pairs

    image

    You might want to dial the sample rate down to the minimum to start with as well.

    • Cancel
    • Vote Up 0 Vote Down
    • Sign in to reply
    • Verify Answer
    • Cancel
element14 Community

element14 is the first online community specifically for engineers. Connect with your peers and get expert answers to your questions.

  • Members
  • Learn
  • Technologies
  • Challenges & Projects
  • Products
  • Store
  • About Us
  • Feedback & Support
  • FAQs
  • Terms of Use
  • Privacy Policy
  • Legal and Copyright Notices
  • Sitemap
  • Cookies

An Avnet Company © 2025 Premier Farnell Limited. All Rights Reserved.

Premier Farnell Ltd, registered in England and Wales (no 00876412), registered office: Farnell House, Forge Lane, Leeds LS12 2NE.

ICP 备案号 10220084.

Follow element14

  • X
  • Facebook
  • linkedin
  • YouTube