

Building your own personal weather station is a lot easier than it used to be. With fickle New England weather, here at the MathWorks, we decided we wanted to build our own weather station and use MATLAB to analyze the data.
We needed a place that was exposed to basic elements of weather and can also safeguard the electronics from the weather, reasons which led us to choose the top floor of our parking garage. We chose a list of hardware that would help us exploit existing resources in MATLAB and IoT platform called ThingSpeak a free online data aggregator.

The parking garage was out of range of our building’s Wi-Fi and we had to transmit the data from the station to a receiver located inside a nearby building. To do this we used an Arduino Uno with a high power XBee module and transmitted data to another XBee module on an Arduino Mega located inside the building. This Arduino Mega was connected to the internet using our Wi-Fi and the full list of hardware we used in our setup is shown below -
Hardware List
- Arduino Uno plus weather shield and weather meters
- 2x XBee shields and 2x extended range XBee modules from Digi International
- Arduino Mega with Ethernet Shield
- 2x Arduino stackable header kits for mounting
- 2x 5V transformer to power Arduinos
- XBee Explorer Dongle to program the XBee transmitter

Step 1 – Programming the outdoor Arduino
- Solder header pins onto the weather shield and XBee shield.
- Insert the weather shield and XBee shield into the Arduino Uno according to the schematics provided with the shields.
- Plug the high power XBee transceiver into the XBee shield. (X-CTU software was used to program the destination address and to download the required firmware onto the XBee shield)
- Connect the anemometer, weather vane and rain sensor to the weather shield using the RJ-45 connectors provided with the weather meters.
Step 2 - Programming the indoor Arduino
This is the Arduino Mega that is responsible for: a) receiving the data from the outdoor Arduino, b) validating the data and c) posting the data to ThingSpeak.
- Solder header pins onto the Ethernet shield and XBee shield.
- Insert the Ethernet shield and XBee shield into the Arduino Mega according to the schematics provided with the shields.
We then programmed the Arduino to receive XBee messages and forward these messages once every minute to ThingSpeak using the Ethernet connection. To send messages to ThingSpeak – we setup an account and configured the channel and field information in ThingSpeak. After verifying that the station is sending data to ThingSpeak, we started the data analysis with MATLAB.
Note – Live data from this setup is available on channel 12397 of ThingSpeak.com.
Step 3 – Data Analysis
Retrieve Weather Data from ThingSpeak
Use the thingSpeakFetch command to view available fields of data and simultaneously import all the fields into MATLAB. This command also allows us to store the temperature, humidity, wind speed, and wind direction data in their own variables.
8000 points is the maximum number of points that ThingSpeak allows to be fetched in a single query. For our data rate, it corresponds to about 6 days of data.
| Code |
|---|
[d,t,ci] = thingSpeakFetch(12397,'NumPoints',8000); % fetch last 8000 minutes of data tempF = d(:,4); % field 4 is temperature in deg F baro = d(:,6); % pressure in inches Hg humidity = d(:,3); % field 3 is relative humidity in percent windDir = d(:,1); windSpeed = d(:,2); tempC = (5/9)*(tempF-32); % convert to Celsius availableFields = ci.FieldDescriptions' |
availableFields =
'Wind Direction (North = 0 degrees)' 'Wind Speed (mph)' '% Humidity' 'Temperature (F)' 'Rain (Inches/minute)' 'Pressure ("Hg)' 'Power Level (V)' 'Light Intensity' |
Compute Some Basic Statistics over the Time Period and Display
To analyze if the data looks reasonable, we found the minimum, maximum and mean values for the data and the corresponding timestamps.
| Code |
|---|
[maxData,index_max] = max(d); maxData = maxData'; times_max = datestr(t(index_max)); times_max = cellstr(times_max); [minData,index_min] = min(d); minData = minData'; times_min = datestr(t(index_min)); times_min = cellstr(times_min); meanData = mean(d); meanData = meanData'; % make column vector summary = table(availableFields,maxData,times_max,meanData,minData,times_min) % display |
summary =
availableFields maxData times_max ____________________________________ _______ ______________________
'Wind Direction (North = 0 degrees)' 338 '10-Jul-2014 05:01:32' 'Wind Speed (mph)' 6.3 '10-Jul-2014 12:47:14' '% Humidity' 86.5 '15-Jul-2014 04:51:24' 'Temperature (F)' 96.7 '12-Jul-2014 16:28:55' 'Rain (Inches/minute)' 0.04 '15-Jul-2014 13:47:13' 'Pressure ("Hg)' 30.23 '11-Jul-2014 09:25:07' 'Power Level (V)' 4.44 '10-Jul-2014 10:25:01' 'Light Intensity' 0.06 '12-Jul-2014 13:23:38'
meanData minData times_min _________ _______ ______________________
NaN 0 '10-Jul-2014 04:54:32' 3.0272 0 '10-Jul-2014 01:33:14' 57.386 25.9 '12-Jul-2014 13:39:39' 80.339 69.6 '11-Jul-2014 06:59:54' 5.625e-05 0 '10-Jul-2014 01:02:11' 30.04 29.78 '15-Jul-2014 13:04:08' 4.4149 4.38 '11-Jul-2014 09:22:06' 0.0092475 0 '10-Jul-2014 01:02:11' |
Unexpected values such as maximum barometric pressure of 40 inches or a maximum temperature of 1700 degrees can occur sometimes especially if there are transmission errors or power glitches. In Step 4, we will show some ways to handle data that you have determined is an outlier.
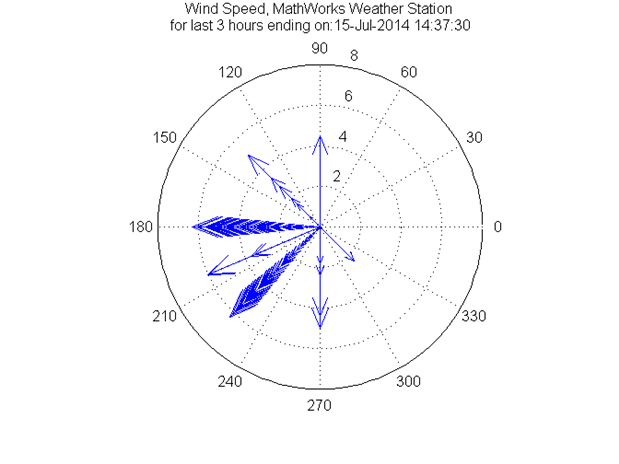
Visualize the Wind over Last Three Hours
Here we look at the last 180 minutes’ data and we are using compass visualization in MATLAB to see both the wind speed and direction over this time. In this plot read zero degrees as North, 90 as West, 180 as South and 270 as East.
Here is the code to generate the plot
| Code |
|---|
figure(1) windDir = windDir((end-180):end); % last 3 hours windSpeed = windSpeed((end-180):end); rad = windDir*2*pi/360; u = cos(rad) .* windSpeed; % x coordinate of wind speed on circular plot v = sin(rad) .* windSpeed; % y coordinate of wind speed on circular plot compass(u,v) titletext = strcat(' for last 3 hours ending on: ',datestr(now)); title({'Wind Speed, MathWorks Weather Station'; titletext}) |
|
Acquire and Process Weather Data on a Rainy Day in New England
To use the data that we have collected over a period of time we retrieved data from the weather station on a known rainy day. The rainfall gauge that we used is a self-emptying one that rotates and empties when 0.01 inches of rain have fallen. The Arduino code counts the number of times the meter has emptied every minute and sends the appropriate rainfall value to ThingSpeak.
| Code |
|---|
[d,t,ci] = thingSpeakFetch(12397,'DateRange',{'6/4/2014','6/6/2014'}); % get data baro = d(:,6); % pressure extraData = rem(length(baro),60); % computes excess points beyond the hour baro(1:extraData) = []; % removes excess points so we have even number of hours rain = d(:,5); % rainfall from sensor in inches per minute From the data it can be seen that we received 0.48 inches. To get a better idea of when the maximum rainfall occurred we can convert the data to hourly data as shown below. rain(1:extraData) = []; t(1:extraData) = []; rainHourly = sum(reshape(rain,60,[]))'; % convert to hourly summed samples maxRainPerMinute = max(rain) june5rainfall = sum(rainHourly(25:end)) % 24 hours of measurements from June 5 baroHourly = downsample(baro,60); % hourly samples timestamps = downsample(t,60); % hourly samples |
maxRainPerMinute =
0.0100
june5rainfall =
0.4800 |
Visualize the Hourly Rain and Pressure Data and Find Pressure Trend
We can use MATLAB to fit a trend line to the barometric pressure data and the data is plotted alongside the rainfall –
| Code |
|---|
figure(3) subplot(2,1,1) bar(timestamps,rainHourly) % plot rain xlabel('Date and Time') ylabel('Rainfall (inches /per hour)') grid on datetick('x','dd-mmm HH:MM','keeplimits','keepticks') title('Rainfall on June 4 and 5') subplot(2,1,2) hold on plot(timestamps,baroHourly) % plot barometer xlabel('Date and Time') ylabel(availableFields(6)) grid on datetick('x','dd-mmm HH:MM','keeplimits','keepticks') detrended_Baro = detrend(baroHourly); baroTrend = baroHourly - detrended_Baro; plot(timestamps,baroTrend,'r') % plot trend hold off legend('Barometric Pressure','Pressure Trend') title('Barometric Pressure on June 4 and 5') |
|

Once we plot this data and look at the trend, we can clearly see that the barometric pressure does indeed drop prior to our heavy rainfall event!
Step 4 – Clean up Data When There Are Outliers
One of the outliers we found was on May 30, we recorded some unreasonable temperature data. Let’s see how to use MATLAB to clean it up.
| Code |
|---|
[d,t] = thingSpeakFetch(12397,'DateRange',{'5/30/2014','5/31/2014'}); rawTemperatureData = d(:,4); newTemperatureData = rawTemperatureData; minTemp = min(rawTemperatureData) % wow that is cold! |
minTemp =
-1.7662e+03 |
Use Threshold Filter to Remove Outlier Data
Delete elements that fail the threshold test. In this case, we have some data points that are completely unreasonable such as a temperature reading of -1766 degrees F so let’s limit the data to include only temperatures that are > 0 or < 120 which is reasonable for a Spring day here in New England.
| Code |
|---|
tnew = t'; outlierIndices = [find(rawTemperatureData < 0); find(rawTemperatureData > 120)]; tnew(outlierIndices) = []; newTemperatureData(outlierIndices) = []; Plot the cleaned up data and the original data. figure(4) subplot(2,1,2) plot(tnew,newTemperatureData,'-o') datetick xlabel('Time of Day') ylabel(availableFields(4)) title('Filtered Data - outliers deleted') grid on subplot(2,1,1) plot(t,rawTemperatureData,'-o') datetick xlabel('Time of Day') ylabel(availableFields(4)) title('Original Data') grid on |
|

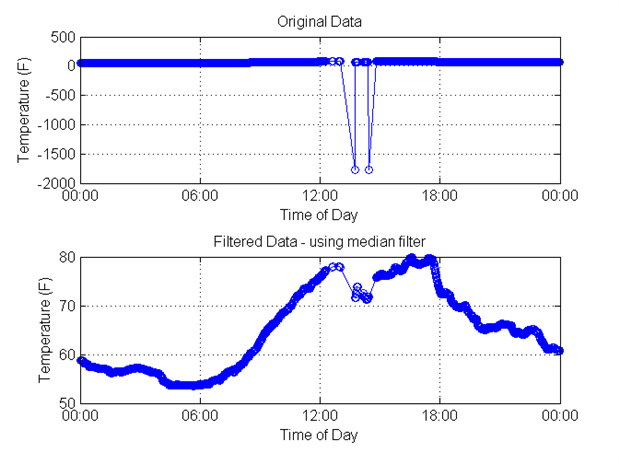
Use Median Filter to Remove Outlier Data
The median filter does not assume pre-knowledge of the data set, it uses the median of nearest neighbors to remove samples that appear to be outside. This type of filter can be used to remove noise in any signal.
| Code |
|---|
n = 5; % this value determines the number of total points used in the filter
% Choose larger values of n to include more neighboring values. For temperatures collected once per minute, we choose n = 5 because temperature should not typically change too much in 5 minutes.
f = medfilt1(rawTemperatureData,n); figure(5) subplot(2,1,2) plot(t,f,'-o') datetick xlabel('Time of Day') ylabel(availableFields(4)) title('Filtered Data - using median filter') grid on subplot(2,1,1) plot(t,rawTemperatureData,'-o') datetick xlabel('Time of Day') ylabel(availableFields(4)) title('Original Data') grid on |
|
Conclusion
Although our experiment focused on collecting data from a weather station, you may find this example useful for analyzing environmental data from other Internet of Things connected sensors with which you may be experimenting.
If you would like to reproduce this analysis and if you do not have access to MATLAB, please click here to purchase MATLAB for student use.