


Introduction
For a recent environment sensor project I wanted to make use of an analog moving-coil meter. They are still manufactured and available new from Aliexpress for very little, and are also available from what I’ve heard, from Ham radio meet-ups.
They can be driven from analog circuits, or from microcontrollers and digital sources too, by attaching a series resistor and using Pulse Width Modulation (PWM).
One downside is that the meter scale might not be suitable for the measured quantity. This blog post shows how I went about creating a custom meter dial using Python code.

The blog post will walk through how this specific meter dial was created as an example, but the information can be applied to any custom meter dial.
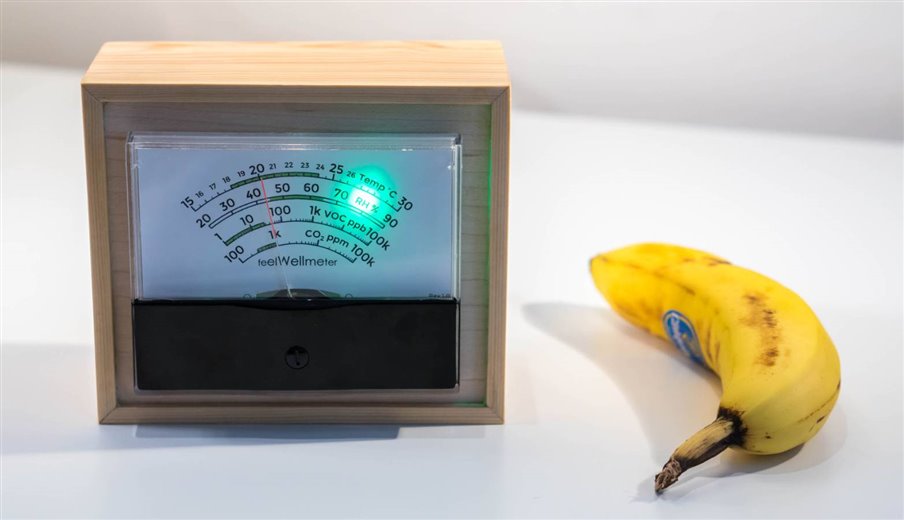
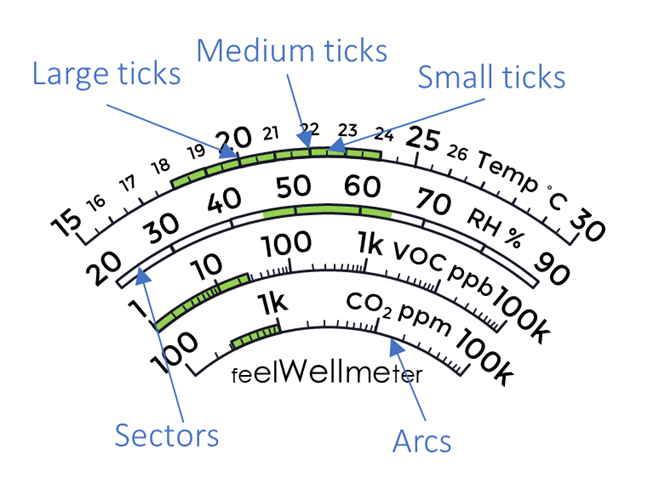
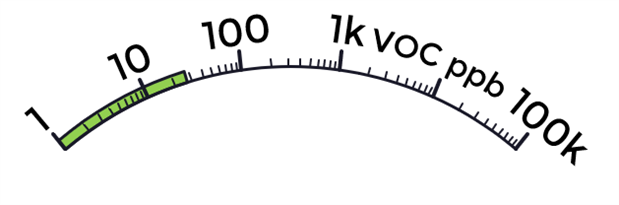
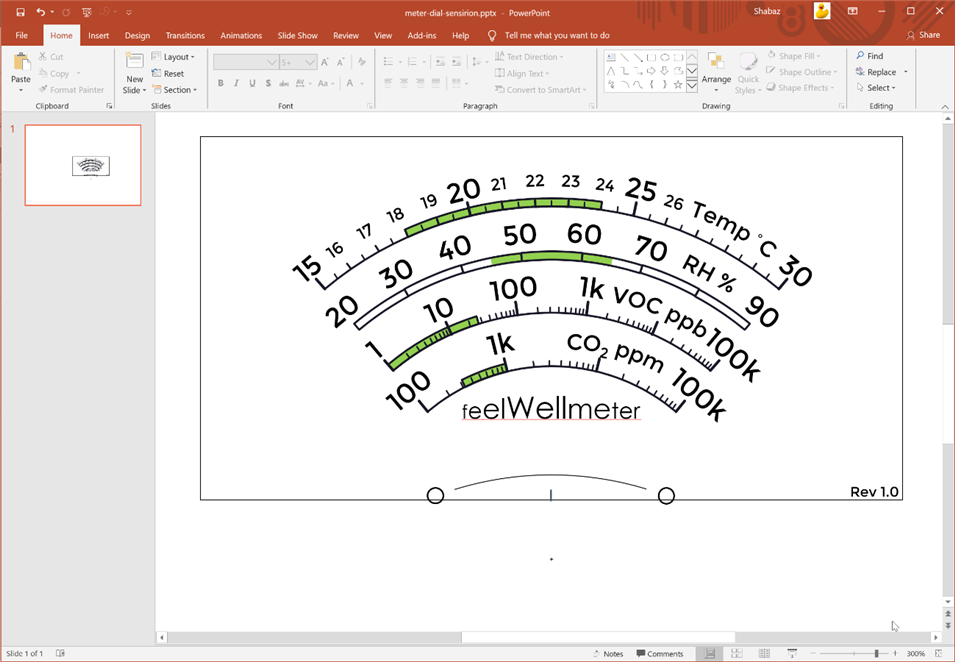
It can be seen that this meter dial has several scales, different-sized tick marks (large, medium, and small ticks), shaded regions, linear and log scales, and rotated text. The software I used allows for all of these elements to be created.
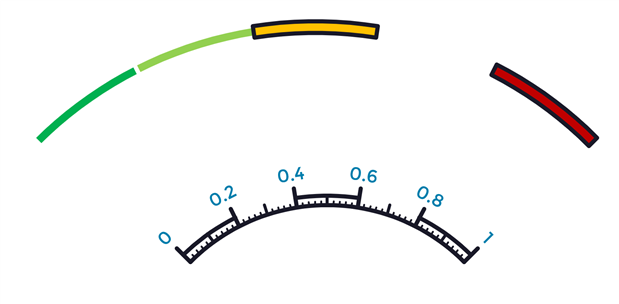
Here's another example showing some different styles possible with the Meter Dial Toolbox. These are composed of sectors, arcs, ticks, and rotated text too.
Overview
There’s software already available for meter dials; one free example is called MeterBasic, and there is a $55 paid-for version too, with extra features. Elsewhere, I found an online meter dial creator too. Apart from these examples, I didn’t find a lot else : (
I decided to try to do it programmatically as much as possible. For that, I needed a graphics library, and svgwrite seemed ideal. The end result was a small collection of functions that can be called to construct meter dials. The output from the code is a .svg file that can be opened with Inkscape and modified there or within PowerPoint, and then printed and glued onto the meter or onto the existing meter dial.
Using the Code
The Meter Dial Creator toolbox is available on github in a single file called app.py. Download it to your PC (Windows or Linux or Mac), ensure you have Python 3 installed, and then install the svgwrite library by typing the following:
pip3 install svgwrite
The app.py code can be inspected in a text editor. It consists of three main sections, in this order:
Settings Section
The main variable here is called mechangle, and it needs to be set to the maximum angle that the meter needle will traverse. For my meter, the angle was 80 degrees, so the value was set to (in radians):
mechangle=(80/360)*2*math.pi
The other variables in the Settings section are concerned with arc and tick colors and widths. They can be left at the defaults.
Functions Section
There are functions to draw arcs, sectors, ticks, and so on. None of this needs changing to use the code for the meter dial used in this example.
Main Code Section
This is where the meter dials get created! The example photo and screenshot above show a meter dial with four scales. Here is how to create the top-most scale which is intended for measuring temperatures from 15 to 30 degrees C:
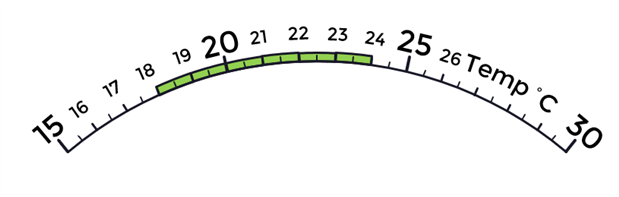
The example has a total of 31 ticks (15 to 30 inclusive, including the large, medium, and small ticks). The radius of the arc was desired to be about 47mm. The code below will draw an arc with the correct radius or height h, and composed of 31 points.
h=47*szfactor
full_arc(h, 31)
Next, to draw the ticks, the following line is used:
full_ticks(h=h, p=31, len_L=10, len_M=5, len_S=4, interval_L=10, interval_M=2)
To explain that, the ticks are being drawn at the same height (radius), 31 ticks are drawn, and the lengths of the large, medium, and small ticks are 10, 5, and 4 respectively. The final two parameters interval_L and interval_M indicate that the large ticks are spaced every 10 ticks and otherwise the medium ticks are every other tick, so the value 2 is used.
To create placeholders for the text labels, type the following:
full_label(h+12, 16)
This specifies that the labels are to be positioned at a radius of h+12, and that 16 labels are needed (15 to 30 integer degrees C inclusive).
The drawing is created by adding this line at the end:
dwg.save()
The code can be run by typing:
python3 ./app.py
The output file will be called out.svg.
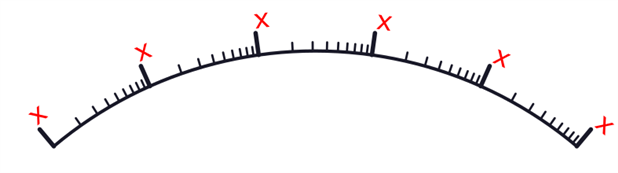
Open it by dragging it into Inkscape, and you’ll see this:
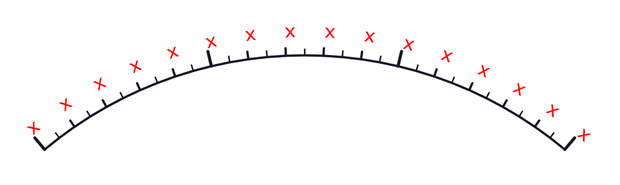
The green shaded area is missing. The shaded area is to cover 18 to 24 degrees C.
To create that, the sector-creating function can be called several times. The full span of the arc covers 15 degrees C, which can be 15 separate integer sectors, of which six are to be drawn, between 18 and 24.
Type the following just before the dwg.save() line:
sectors=15
for i in range (0,sectors):
    if ((i+15)>=18) and ((i+15)<24):
        sector(h=h, p=10, l=6, n=i, t=sectors)
The code above draws sectors between 18 and 24 degrees C, creating curves with 10 points (this is arbitrary; just enough points are needed to make the shape look smooth), at a radius between h and h+6.
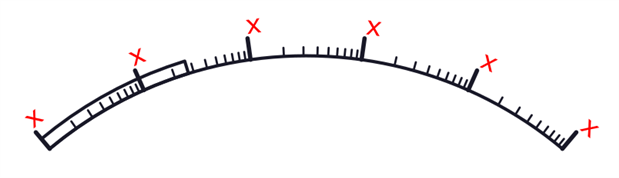
Now when the code is run, the output looks like this:
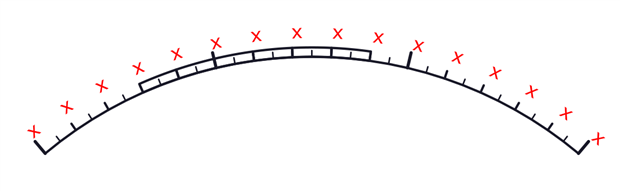
Next, the second scale can be drawn underneath the first. It needs to look like this:
This scale shows humidity from 20 to 90 percent. To create it, the sector function was used multiple times. The radius (from the bottom part of the sectors) was to be 40mm.
h=40*szfactor
sectors=7
for i in range (0,sectors):
    sector(h, 10, 6, i, sectors)
The code above creates 7 sectors, each composed of 10 points (this is arbitrary, just enough for straight lines to look like curves), with the top part of the sectors at a radius of h+6.
Text label placeholders are placed in the same way as for the previous meter dial. There are a total of 8 text labels, at a radius of h+12:
full_label(h+12, 8)
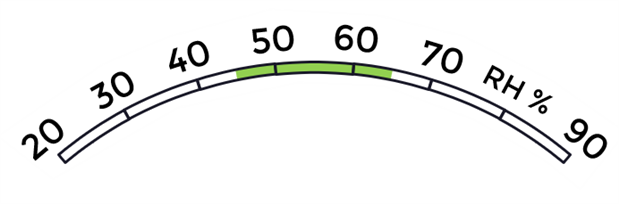
To create the green shaded area which covers from 45 to 50 percent, 50 to 60 percent, and 60 to 65 percent, one way is to consider these regions as more sectors, just with a different fill and outline.
Create the two small sectors (45 to 50 and 60 to 65 percent) using this code:
sectors=14
sector(h, 10, 6, 5, sectors)
sector(h, 10, 6, 8, sectors)
This is the generated output:
All fill and actual text will be done later!
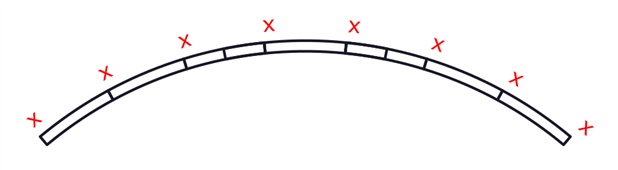
Now come the logarithmic scales : ) The first log scale is to look like this:
The scale is to be drawn at a radius of 33mm. Pick a number of points (just enough for straight lines to look like a curve). I chose 51:
h=33*szfactor
full_arc(h, 51)
Now that the base arc is drawn, the log ticks are needed. A total of five decades are to be drawn (starting at 1, 10, 100, 1000 and 10000).
The log_full_ticks function is used. The parameters indicate 5 decades are to be drawn with the large ticks having a length of 10, and the medium and small ticks both having a length of 4. When using log_full_ticks, the medium tick indicates the half-decade positions (i.e. 5, 50, 500, and so on) and the small tick indicates the tenths within the decade. In this example, I didn’t want to differentiate between medium and small tick positions.
log_full_ticks(h=h, d=5, len_L=10, len_M=4, len_S=4)
There are a total of six text label positions (for 1, 10, 100, 1k, 10k, and 100k) drawn at a radius of h+12:
full_label(h+12, 6)
This is the result:
Next, the shaded area is needed and it is drawn using the sector function used earlier. By trial-and-error, I determined that if I set the number of sectors to 3.5, then a single sector command would draw the desired area from 1 to 27 on the log scale. To do it more formally, the sector calculation would be 5/log(27) where 5 is the number of decades.
sectors=3.5
sector(h, 10, 6, 0, sectors)
That results in the following:
The second log meter scale is created in a near-identical manner; the details can be seen in the app.py file.
Putting it all Together
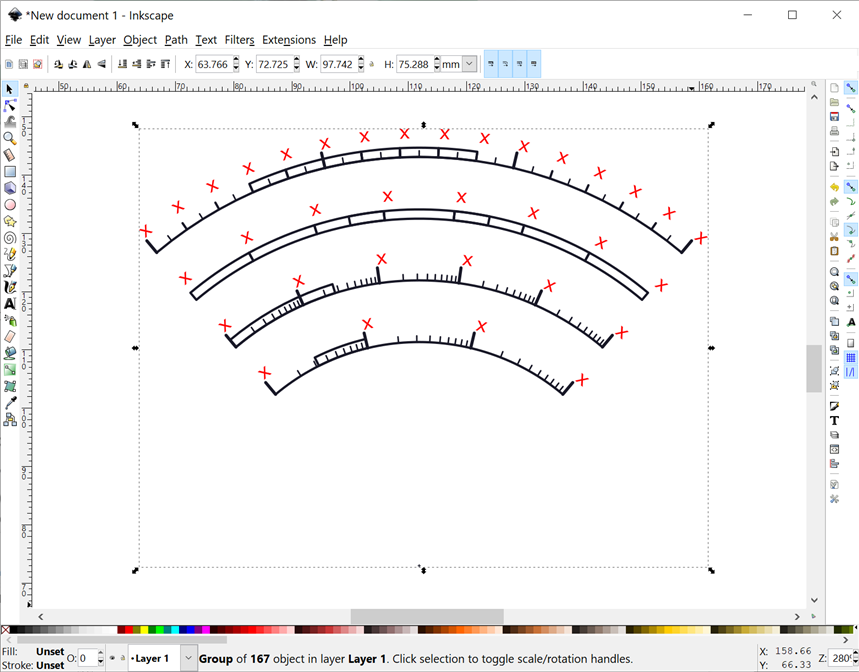
When the final app.py file is run by typing python3 ./app.py the generated out.py file can be dragged into an empty Inkscape window:
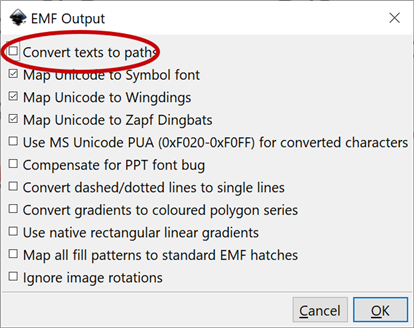
Next, click on File->Save As and set the file type to Enhanced Metafile. When the file is saved, an EMF Output prompt will appear. It is important to un-check the Convert text to paths option.
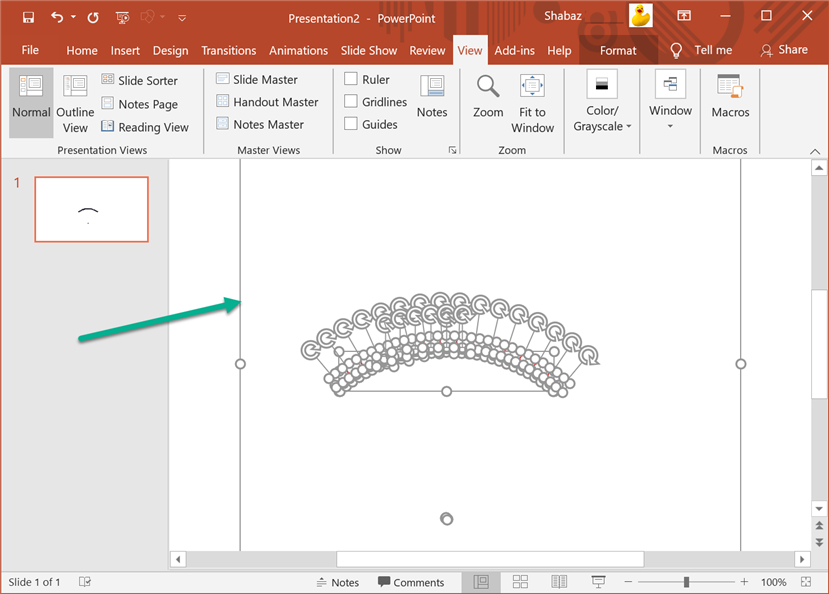
Now, drag the saved .emf suffix file into a blank PowerPoint slide window that has been set up for your printer paper size (e.g. Letter or A4 sized). Right-click on the object and click on Group->Ungroup. A prompt will appear requesting if the object should be converted into a Microsoft Office drawing object. Click Yes, and then right-click and select Group->Ungroup again. You’ll see many highlighted objects surrounded by a large box (indicated below with a green arrow). Deselect everything, and select just that large box and press Delete to remove it.
Before you go too far into editing the content, draw a box around the meter scales and print it out onto some scrap paper to see if it is the correct size, and if the meter angles are correct. If you’re unhappy, then edit app.py and repeat the process, until you’re happy with the sizing of the dials and the box.
Now you’re free to edit the red text label positions to add your numbers and any other text required. The numbers will need to be manually centered into their correct positions, unfortunately, but it’s not a big job. Also, it doesn’t need to be precise – I think (not sure) that slight imperfections can make it look better sometimes since the human viewer will imperfectly interpret it too – maybe two imperfections can cancel : )
Any green regions can be colored using the usual line and fill tools within PowerPoint, and select and bring objects backward or forward to make meter ticks visible even in the shaded regions.
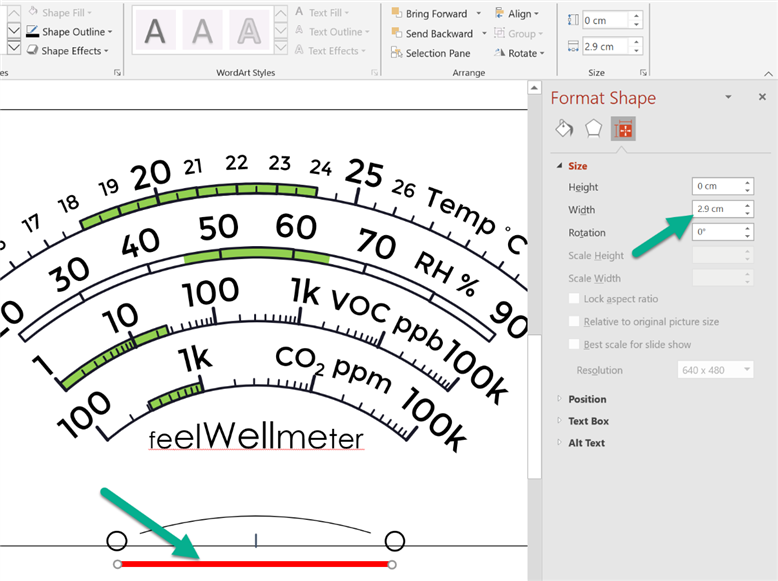
The screenshot above shows how my meter dial looked like in PowerPoint once complete. The two little circles and arc at the bottom of the box were used to indicate screw-hole positions and the cut-out needed for the particular meter I was using. They were positioned using some trial-and-error and verifying dimensions within PowerPoint. One trick to more accurately position stuff is to draw a temporary line to act as a construction line (shown in red below), select it, and then edit the width by typing in a value in the Format Shape pane as shown below.
Glue the meter scale into position; humidity over time might make the paper lift unevenly, so it may need glue all over. For a more high-end option, printed stickers could be a possibility too. They’re not super-expensive for small volumes, and some printing firms will provide silvered finishes too!
Summary
I hope the information was useful. Although meter dials are not popular, perhaps the information is still useful to be able to inspect how the graphics library was used, to edit or construct new functions and code, and to create all sorts of other diagrams programmatically. Examples could include speaker hole cut-out templates, LEDs in linear or circular arrays, volume dial markings, and so on. If you generate some interesting meter dials or make changes to the code, it would be great to see it : )
Thanks for reading!

