


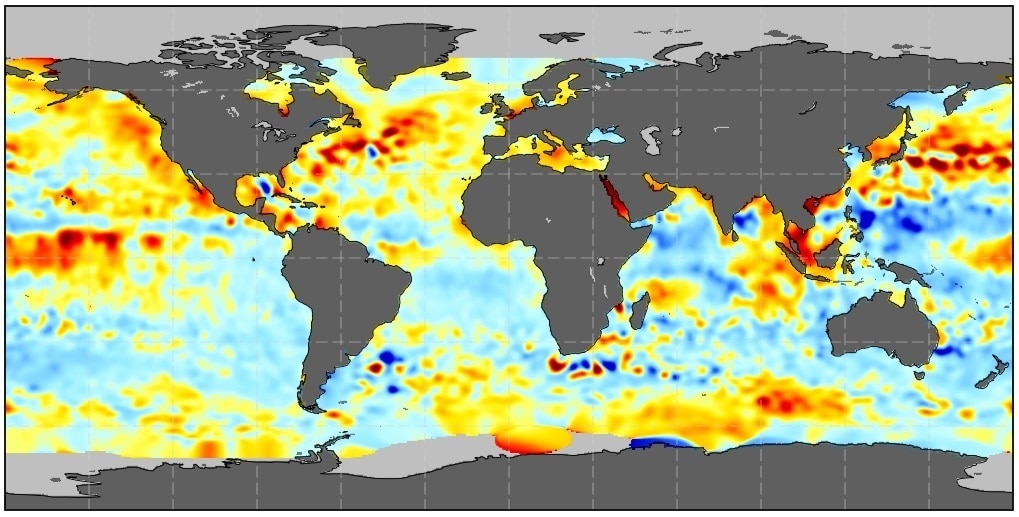
NASA’s reference grid of sea surface height anomalies. (Image Credit: NASA)
For over three decades, NASA has been using Sea Surface Height (SSH) products derived from satellite altimetry (TOPEX/Poseidon, Jason series, and Sentintel-6) to track weekly sea level changes. Recently, the space agency made that data publicly available. It reveals abrupt, short-term rises and drops in water levels that intensify coastal flooding before annual trends reflect any significant shift. The team at NASA’s JPL calibrated and cross-checked satellites, ensuring consistent weekly measurements. Making the data publicly accessible eliminates lag between research labs and public users who rely on timely data to monitor quickly evolving coastal risks.
These satellites orbit at an altitude of 830 miles, beaming microwave pulses that deflect off the ocean surface. The return time (multiplied by light speed) provides the range to the sea, precise to 3-5 cm after corrections for atmosphere and tides. High-accuracy orbital solutions from GPS, DORIS, and satellite laser ranging track each satellite position to ~1 cm. This allows scientists to calculate sea surface height relative to Earth’s center. Each one-second snapshot covers a 3–6-mile patch, smoothing waves and preserving large-scale patterns.
Afterward, scientists use computers to turn the satellite tracks into NASA-SSH grids on a fixed layout. They merge 10-day observations per map to capture a full repeat cycle. Data is then placed on a 0.5-degree grid and smoothed across nearby points spanning 62 miles to reduce noise. Weekly grids aggregate those spot measurements, which cover 90% of oceans every ten days, into global and regional grids through the NASA Sea Level Change Portal.
However, weekly sea level maps are limited as space-based sensors can’t track all the coastlines in fine detail. Gaps still remain near the poles. And gridded maps capture features at approximately 200-mile resolution. Processing has a two-week delay, and weekly files overlap with the next. This means users monitoring storms must remember that the maps show general trends rather than exact water levels.
To prevent waters from overlapping each other, the ocean is separated into basins, and each grid point is flagged by region. If water truly connects, the neighboring basins share data. Meanwhile, land barriers block mixing. Using this method preserves coastal details.
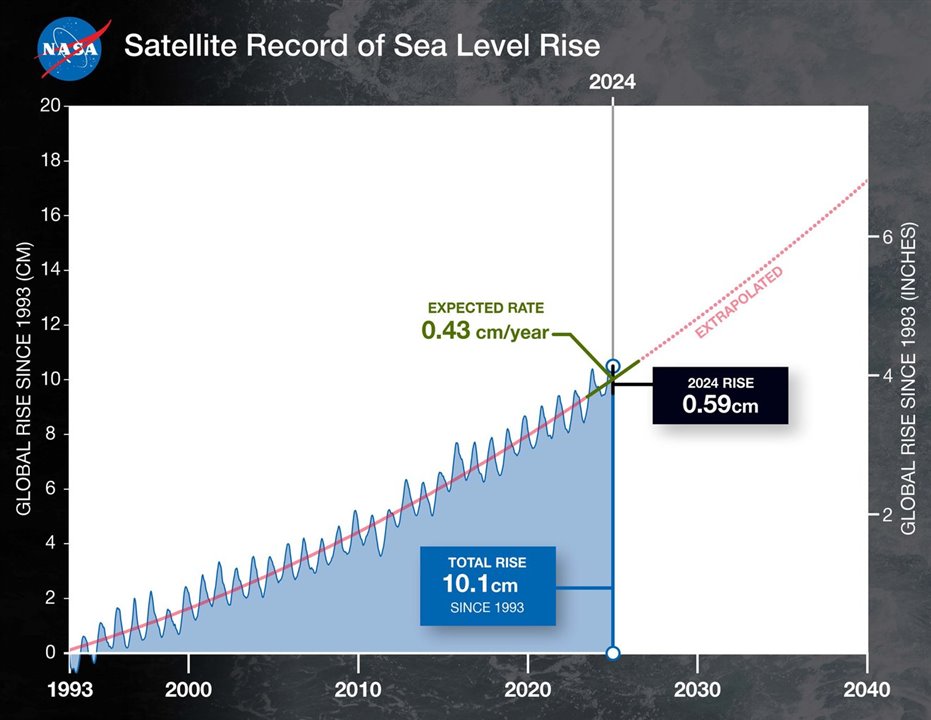
Graph showing sea level rises since 1993. (Image Credit: NASA/JPL-Caltech)
Maps show sea surface height anomalies capturing currents, heat expansion, and events like El Niño. Satellites monitor those changes within days, providing scientists and agencies with insight into regional surges.
Due to thermal expansion, the global sea level rose 0.23 inches in 2024. This occurred as warmer water expanded after winds mixed heat deeper than usual. According to scientists’ estimates, two-thirds of the rise came from warming oceans rather than melting ice.
Sea level rise is also accelerating, based on the long record that includes Sentinel-6 data. It shows the sea level rising from 0.08 inches/year in 1993 to 0.18 inches/year in 2023. Greenhouse gas-driven warming and ice melt are to blame as they have added water. This created a faster baseline for weekly changes.
Have a story tip? Message me here at element14.

