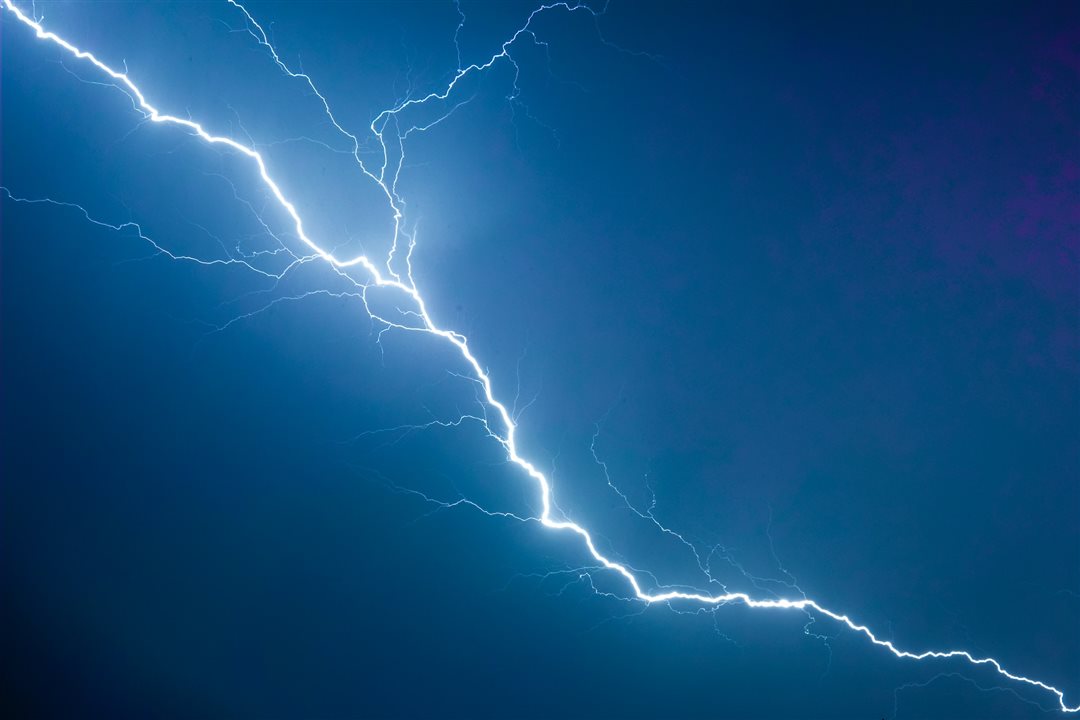
Researchers can now map lightning in 3D. (Image Credit: Michał Mancewicz/Unsplash)
Studying lightning strikes has never been an easy task. Researchers typically use "radio frequency interferometry," which involves using an array of antennas to measure the radio waves generated by lightning to observe that phenomenon. This method isn't very sufficient because it only determines the angular position of a lightning bolt and its 2D polarization. As a result, scientists cannot figure out the lightning's starting point in a cloud and how quickly carrying discharge processes occur. Researchers recently added a third dimension to radio-frequency interferometry and polarization detection, which could address those issues.
Crossed-dipole broadband Long Wavelength Array antenna. (Image credit: the research team.)
The team's 2nd gen BIMAP-3D (Broadband Interferometric Mapping and Polarization in 3D) uses two observation stations, which feature four broadband and polarized antenna sets set up in a Y orientation. Using these two stations at the same time allows scientists to map lightning and detect polarization in 3D.
The team also used two methods that triangulated the path of a lightning strike via merging data from both stations. The first one is based on geometry, while the other is based on arrival time. These analyses can be integrated for precise triangulation. Additionally, the team locates the lightning strike's exact location within several meters at several kilometers above ground. More impressively, the system tracks lightning development within fractions of a microsecond.
"Example of K-change leaders that initially traveled forward but later turned backward along other previously active channels. (a) and (b) colored dots are for a 1-ms K leader in the hybrid flash with colors indicating the time sequences. White dots are for all lighting sources up to the occurrence of the K leader. Sources are plotted in Easting-Altitude (XZ) and Northing-Altitude (YZ) format. (c) and (d) Similar to (a) and (b) but for the last K leader in the IC." (Image credit and caption: the research team.)
Afterward, the researchers applied their new techniques to already observed lightning strikes. They produced 3D maps that show a lightning strike's shape and development, especially those involving cloud-to-cloud and cloud-to-ground strikes. BIMAP-3D also deduces a radio polarization's orientation in 3D.
Have a story tip? Message me at: http://twitter.com/Cabe_Atwell
