element14 Community
element14 Community
    Register Log In
  • Site
  • Search
  • Log In Register
  • Community Hub
    Community Hub
    • What's New on element14
    • Feedback and Support
    • Benefits of Membership
    • Personal Blogs
    • Members Area
    • Achievement Levels
  • Learn
    Learn
    • Ask an Expert
    • eBooks
    • element14 presents
    • Learning Center
    • Tech Spotlight
    • STEM Academy
    • Webinars, Training and Events
    • Learning Groups
  • Technologies
    Technologies
    • 3D Printing
    • FPGA
    • Industrial Automation
    • Internet of Things
    • Power & Energy
    • Sensors
    • Technology Groups
  • Challenges & Projects
    Challenges & Projects
    • Design Challenges
    • element14 presents Projects
    • Project14
    • Arduino Projects
    • Raspberry Pi Projects
    • Project Groups
  • Products
    Products
    • Arduino
    • Avnet & Tria Boards Community
    • Dev Tools
    • Manufacturers
    • Multicomp Pro
    • Product Groups
    • Raspberry Pi
    • RoadTests & Reviews
  • About Us
  • Store
    Store
    • Visit Your Store
    • Choose another store...
      • Europe
      •  Austria (German)
      •  Belgium (Dutch, French)
      •  Bulgaria (Bulgarian)
      •  Czech Republic (Czech)
      •  Denmark (Danish)
      •  Estonia (Estonian)
      •  Finland (Finnish)
      •  France (French)
      •  Germany (German)
      •  Hungary (Hungarian)
      •  Ireland
      •  Israel
      •  Italy (Italian)
      •  Latvia (Latvian)
      •  
      •  Lithuania (Lithuanian)
      •  Netherlands (Dutch)
      •  Norway (Norwegian)
      •  Poland (Polish)
      •  Portugal (Portuguese)
      •  Romania (Romanian)
      •  Russia (Russian)
      •  Slovakia (Slovak)
      •  Slovenia (Slovenian)
      •  Spain (Spanish)
      •  Sweden (Swedish)
      •  Switzerland(German, French)
      •  Turkey (Turkish)
      •  United Kingdom
      • Asia Pacific
      •  Australia
      •  China
      •  Hong Kong
      •  India
      • Japan
      •  Korea (Korean)
      •  Malaysia
      •  New Zealand
      •  Philippines
      •  Singapore
      •  Taiwan
      •  Thailand (Thai)
      • Vietnam
      • Americas
      •  Brazil (Portuguese)
      •  Canada
      •  Mexico (Spanish)
      •  United States
      Can't find the country/region you're looking for? Visit our export site or find a local distributor.
  • Translate
  • Profile
  • Settings
Test & Tools
  • Technologies
  • More
Test & Tools
Blog Agilent 34461A Blog #3 - In pursuit of randomess
  • Blog
  • Forum
  • Documents
  • Files
  • Members
  • Mentions
  • Sub-Groups
  • Tags
  • More
  • Cancel
  • New
Join Test & Tools to participate - click to join for free!
  • Share
  • More
  • Cancel
Group Actions
  • Group RSS
  • More
  • Cancel
Engagement
  • Author Author: Instructorman
  • Date Created: 25 Nov 2013 5:04 AM Date Created
  • Views 714 views
  • Likes 0 likes
  • Comments 3 comments
  • 34461a
  • advanced
  • tektronix
  • mdo4104-3
  • trend
  • dmm4050
  • function
  • agilent
Related
Recommended

Agilent 34461A Blog #3 - In pursuit of randomess

Instructorman
Instructorman
25 Nov 2013

Randomness doesn't always come easily

As described in my  previous blog entries, I have set up a PIC18F4520 to drive the data in line on a string of WS2811 RGB LEDs.  There are 240 LEDs in the 4m long string.  Previously I wrote a function that generates a properly timed pulse train from an array of values in memory.  I have documented several of the light effects that can be created in previous blog entries.  The challenge in this blog is to write a function that will fill the LED array with a suitably random pattern and then write another function to shift that pattern through the array to create an illusion of movement.


In this blog I will describe how advanced features on the Agilent 34461A and other bench instruments can help in the development of firmware for this challenge.


Instrument connections:


The data stream generated by the PIC is observed on one channel of a Tektronix MDO4104-3 oscilloscope.  Two 6½ digits multimeters are monitoring the supply voltage at the far end of the 4 m LED chain.


The reason I connected the multimeters at the end of the string is related to observations of the visual behavior of the LEDs. I noticed that under high brightness conditions (all LEDs on at max output), the LEDs toward the end of the string appeared dimmer and "browner" than LEDs at the beginning of the string.  There is a simple hypothesis to explain this effect.  To confirm my hypothesis I connected the meters to the end of the VCC line so I could see what happened to supply voltage at the end of the string under high current draw conditions.


Each device in the string draws current from the supply in proportion to the intensity setting of each LED in the device.  The amount of current drawn by each device is about 12 mA for a mid-brightness color selection.  A fully illuminated 4m string can draw >3A of DC current.  This amount of current draw can have an undesired effect on the appearance of the lighting effect.  The copper traces that convey power to each device are about 1 mm wide and they have a measurable resistance over 4m.  See photo below to get an idea of trace width.

image

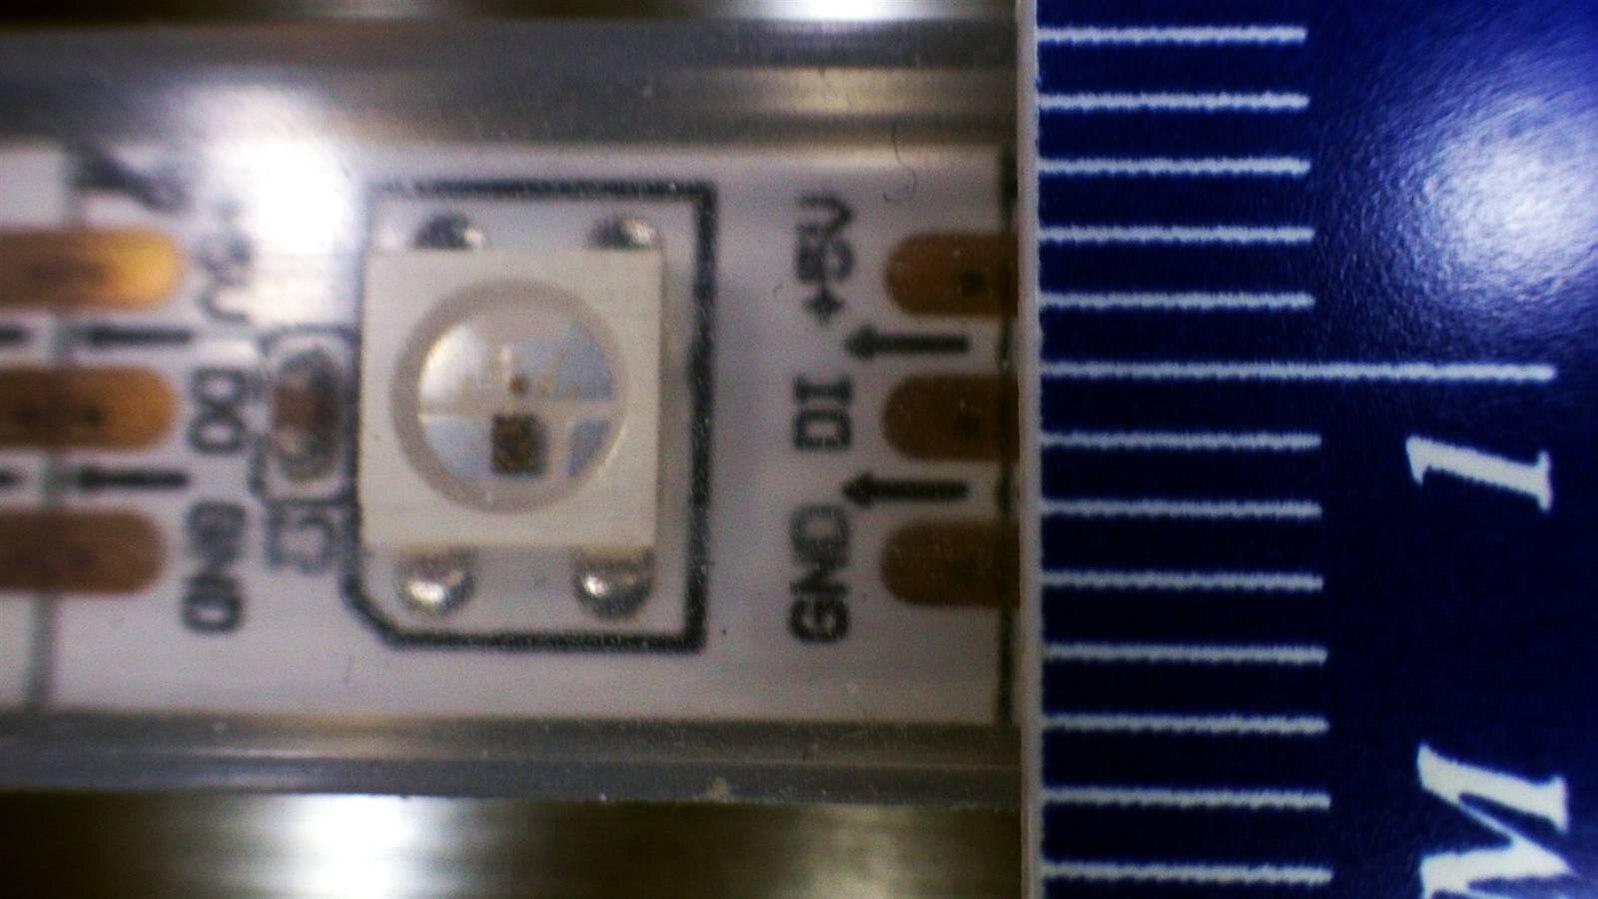
After nulling out test lead resistance, the resistance of the 4 m long power supply copper trace is 600 mΩ.  At 3 A that resistance alone will create a 1.8 V drop in supply voltage.  There is additional resistance in the the ground lead, in the solder joints and in the wire bonds within each device.  The net result is that under high brightness conditions, LEDs near the end of the chain receive significantly lower supply voltage and this makes them appear noticeably dimmer than LEDs at the beginning of the chain.


Below is a short video that clearly illustrates the effect of high current draw on supply voltage.  A single maximum intensity white LED is shifted through the chain while the supply voltage at the end of the chain is trended on the Agilent and Tektronix meters.  Notice how the trend function reveals a clear pattern of behavior that is not readily apparent in numeric or bar graph display modes.

You don't have permission to edit metadata of this video.
Edit media
x
image
Upload Preview
image


The triangle wave on the trend display in the video shows that the light pattern is not random, instead it is periodic.  My goal is to write code that produces a reasonably random color display which should reveal itself visually as a wide array of colors of various intensities.  On the trend display I' expecting to see something aperiodic - something that looks like noise. I went through several code iterations to achieve what now looks like a reasonably random color display. I would try an algorithm idea in code, compile and download the code then observe the behavior on the LEDs and on the bench instruments. While going through this process I discovered a minor shortcoming in the Agilent's trend display when compared to the Tektronix trend display.  The shortcoming is highlighted in the video below.


Also in the video is a demonstration of how an oscilloscope with advanced acquisition features can be of help in judging the randomness of a data stream.  The many ways in which signal information can be formatted and presented, is, I think, one of the best reasons to own high grade test equipment.

You don't have permission to edit metadata of this video.
Edit media
x
image
Upload Preview
image


By the way, even though LEDs are known for low power dissipation and for running cool, when 240 high intensity LEDs are wound onto a spool, they can get toasty.  I stuck a thermistor probe into the center of the spool while it was being driven with the random pattern signal.  Here is the temperature of the spool:

image

That will help keep me warm on this chilly Canadian night.


All the best,


Mark

  • Sign in to reply
  • Instructorman
    Instructorman over 12 years ago in reply to 6thimage

    Thank you Ian, I stand corrected.  I also agree that auto scale should be the default, as it is on the Tektronix meter.


    Mark

    • Cancel
    • Vote Up 0 Vote Down
    • Sign in to reply
    • More
    • Cancel
  • DAB
    DAB over 12 years ago

    Great post.


    I wish I had these features on my current instruments.  I had suspected that the Agilent meter was very useful, you have shown many features that I did not even know existed.


    Thanks

    DAB


    • Cancel
    • Vote Up 0 Vote Down
    • Sign in to reply
    • More
    • Cancel
  • 6thimage
    6thimage over 12 years ago

    This is a very interesting blog post. I just wanted to point out to you that the Agilent can autoscale - on the tend chart's menu, if you press vertical scale and then vertical, there is an option for auto. I am not sure why Agilent didn't chose this as the default, as it seems the most logical.

    • Cancel
    • Vote Up 0 Vote Down
    • Sign in to reply
    • More
    • Cancel
element14 Community

element14 is the first online community specifically for engineers. Connect with your peers and get expert answers to your questions.

  • Members
  • Learn
  • Technologies
  • Challenges & Projects
  • Products
  • Store
  • About Us
  • Feedback & Support
  • FAQs
  • Terms of Use
  • Privacy Policy
  • Legal and Copyright Notices
  • Sitemap
  • Cookies

An Avnet Company © 2025 Premier Farnell Limited. All Rights Reserved.

Premier Farnell Ltd, registered in England and Wales (no 00876412), registered office: Farnell House, Forge Lane, Leeds LS12 2NE.

ICP 备案号 10220084.

Follow element14

  • X
  • Facebook
  • linkedin
  • YouTube