


I wanted to have a look at the Bode plotting with the ADALM1000, so I've chosen to start by looking at an all-pass filter circuit. The idea of an all-pass filter, one that passes all frequencies, seems slightly odd (is it really a 'filter'?) until you remember that a filter has a phase response as well as an amplitude one, and in this case it's the phase response that's of interest and may be of use in a circuit.
Here's the circuit: this is the phase lag variant - you can get the lead variant by swapping the resistor R3 and capacitor C1 positions. The capacitor doesn't really need to go to +2.5V and could go to ground - that was a hangover from where I had a resistor in place of C1, when the voltage on the other end does matter (helpfully, the module has a +2.5V output pin for providing just this sort of bias in circuits being experimented with).
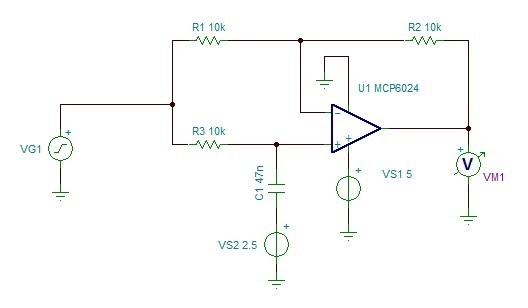
Understanding it in a general, hand-wavy kind of way is quite straightforward if you're familiar with how the inverting and non-inverting op-amp amplifiers work. At low frequencies, the capacitor has time to charge and discharge, so the voltage at the non-inverting input follows the input. The op amp feedback will act to keep the two inputs together, so the ouput will also have to be following the input - so no phase change and a gain of close to one. At the high frequency end, the capacitor has no time to charge or discharge, so will maintain an average level of the input signal - now the input signal appears across R3 and, in order to keep the two op amp inputs together, the output will have to be the inverse of the input - absolute gain still one, but phase now 180 degrees. For frequencies between those extremes, we would expect a transition between the two. That's what I'm going to look at with the ADALM1000.
This is the measured response over the interval 10Hz to 10kHz - I chose the log axis, as is conventional with a Bode plot. The purple trace is the amplitude and the yellow trace the phase. I'm doing this with a waveform having a +2.5V dc offset, so that it's midrange for the op amp input.
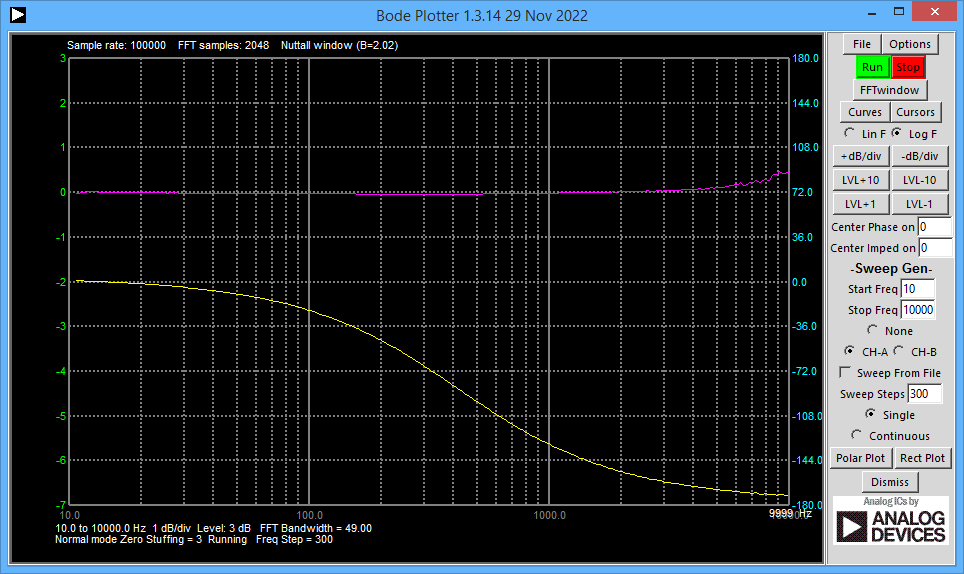
It takes about a second or so for each step at the start of the sweep, though it speeds up a bit as the frequency gets higher. The recovery of the amplitude and phase appears to be done with the FFT.
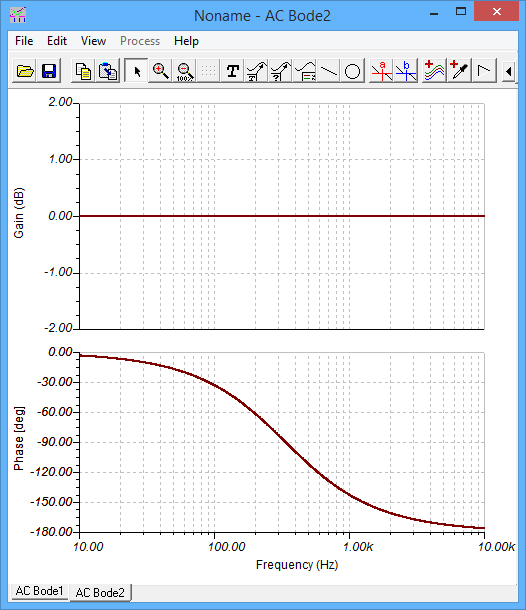
The response nicely shows the way that the phase varies with frequency whilst the amplitude remains at unity gain. There's a slight dip in the gain at the crossover, where the two modes of operation of the filter don't quite overlap as they should, a contrast to the simulation with it's perfectly matched 10k resistors, which shows this:
Although that's all good, I did discover a significant problem with the plotting. If I resize the window and run the sweep again, I get this:

You can see that, although the amplitude curve is still at 0dB, the phase curve has moved. It seems that it may have been drawn taking into account the original size in some way. The problem for the user is that it makes the phase values totally unreliable unless the window is left alone in the place where it initially gets created.
Adjusting the axes was somewhat painful. For the gain, the scale is adjusted using the buttons on the panel. I found it best to adjust the dB/div first, and then the level, up or down. There doesn't seem to be any way to adjust the phase axis.
The odd-looking '9999 Hz' label on the frequency axis is a leftover from the sweep (a cursor makes its way across during the sweep, with the frequency being reported at the bottom).
Further information
Analog Signal Processing, Ramon Pallas-Areny and John G. Webster, Wiley Interscience, 1999 p365
A Short Informal Review of the ADALM1000 from Analog Devices

