


Table of Contents
Introduction
ngscopeclient is a free, open-source software application designed for controlling test and measurement instruments, visualizing signals, analyzing waveforms, and automating hardware tests. It is particularly useful in electronics engineering, laboratory testing, and signal analysis.
Key features:
- Instrument control: Connects to oscilloscopes, signal generators, multimeters, and other compatible instruments.
- Signal analysis: Displays and processes waveforms using GPU-accelerated analysis.
- Protocol decoding: Analyzes communication protocols such as Ethernet and PCIe.
- Multi-instrument support: Combines multiple measurement devices in one interface.
- Test automation: Supports automated testing through a C++ API.
- Cross-platform: Supports Windows, Linux, and macOS.
Official page and more information: https://www.ngscopeclient.org/
Initial usage
I have a Siglent oscilloscope from the SDS2000X HD series, and I know it is supported by ngscopeclient. I decided to test how well the software performs when controlling this oscilloscope. As an initial test, I decided to estimate the oscilloscope's bandwidth by setting one channel to its most sensitive setting and using the FFT function with averaging enabled. Here is the reference FFT output captured directly from the oscilloscope: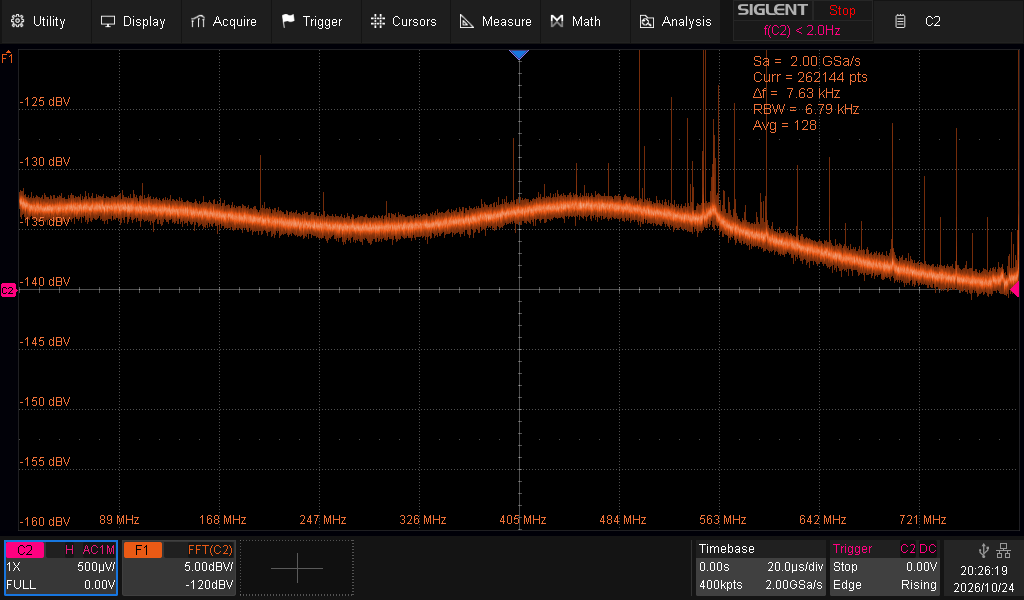
Setup and usage
The setup was straightforward, as the maintainers provide ready-to-use packages for various operating systems. In my case, since I use Linux, I downloaded the .deb package and installed it using the dpkg package manager.
After launching the program using the ngscopeclient command, we can select the type of instrument we want to connect to from the Add menu. I selected an oscilloscope and filled in all the required parameters, such as the driver, model, transport, and path. After clicking the Add button, the oscilloscope was ready to be controlled.
The following screenshots illustrate these steps: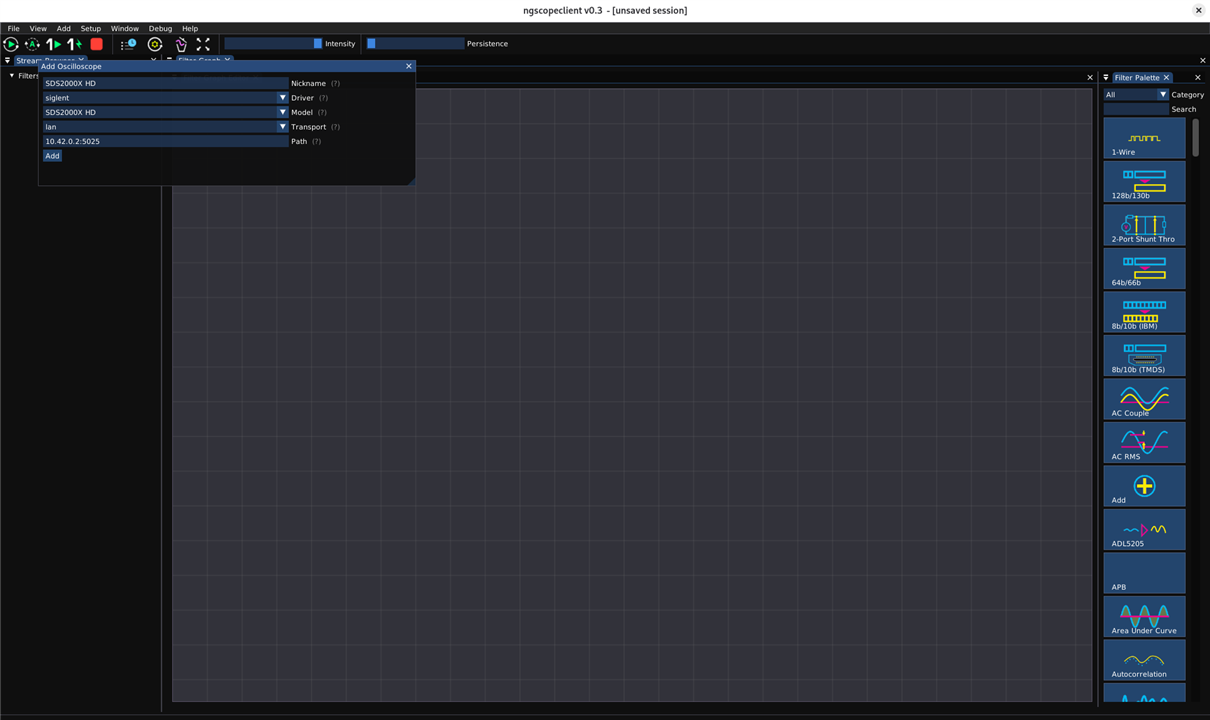
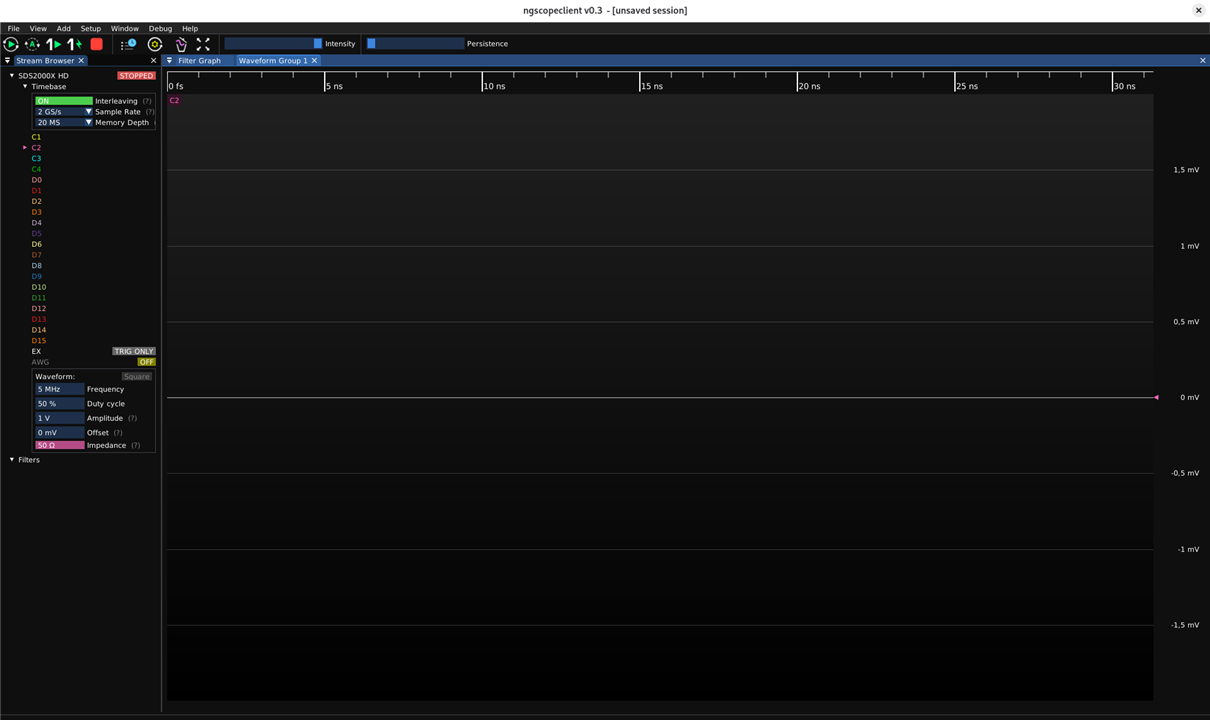
After that, I selected Channel 2 of the oscilloscope and armed the trigger in Normal mode. The result is shown below:
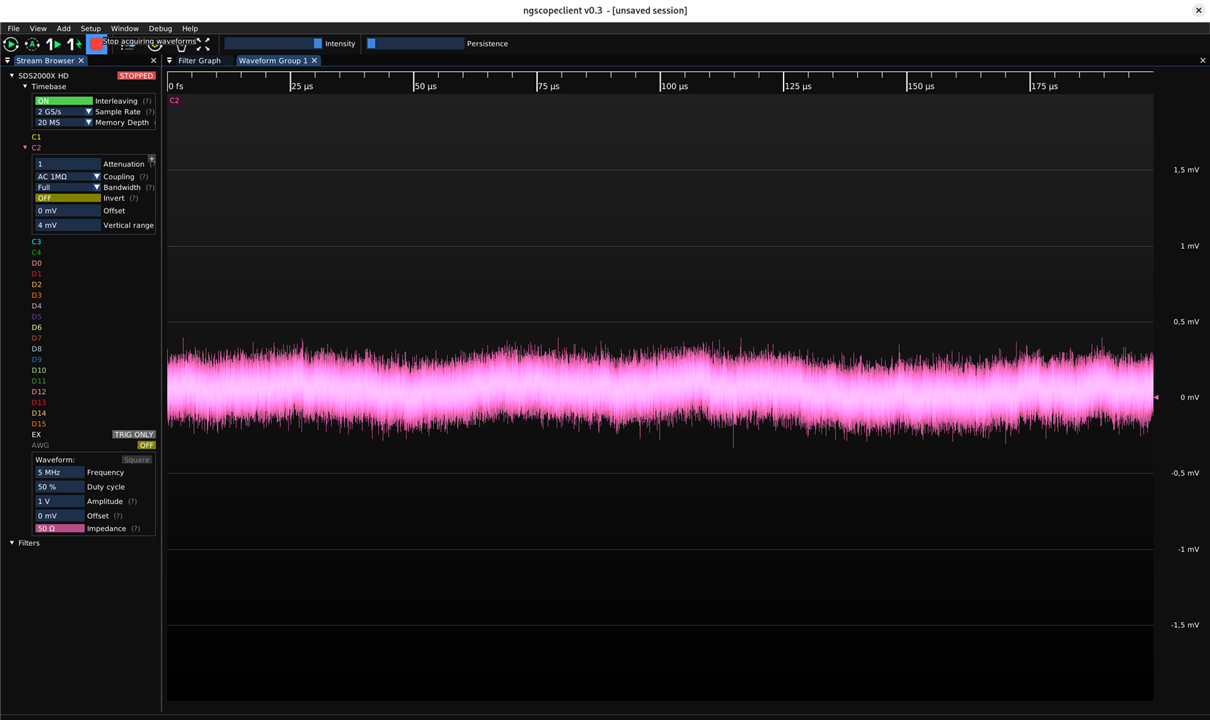
By right-clicking on the x- and y-axes, it was possible to adjust their scales automatically. Additionally, right-clicking on the C2 icon in the top-left corner opened a menu that allowed the FFT function to be added via the RF submenu. The FFT option then appeared as a new waveform group. These groups are used to separate waveforms according to different domains, such as the time or frequency domain.
In the FFT waveform group, similarly to the time-domain waveform for C2, I selected the moving average window from the Math submenu. The result is presented in the following screenshot: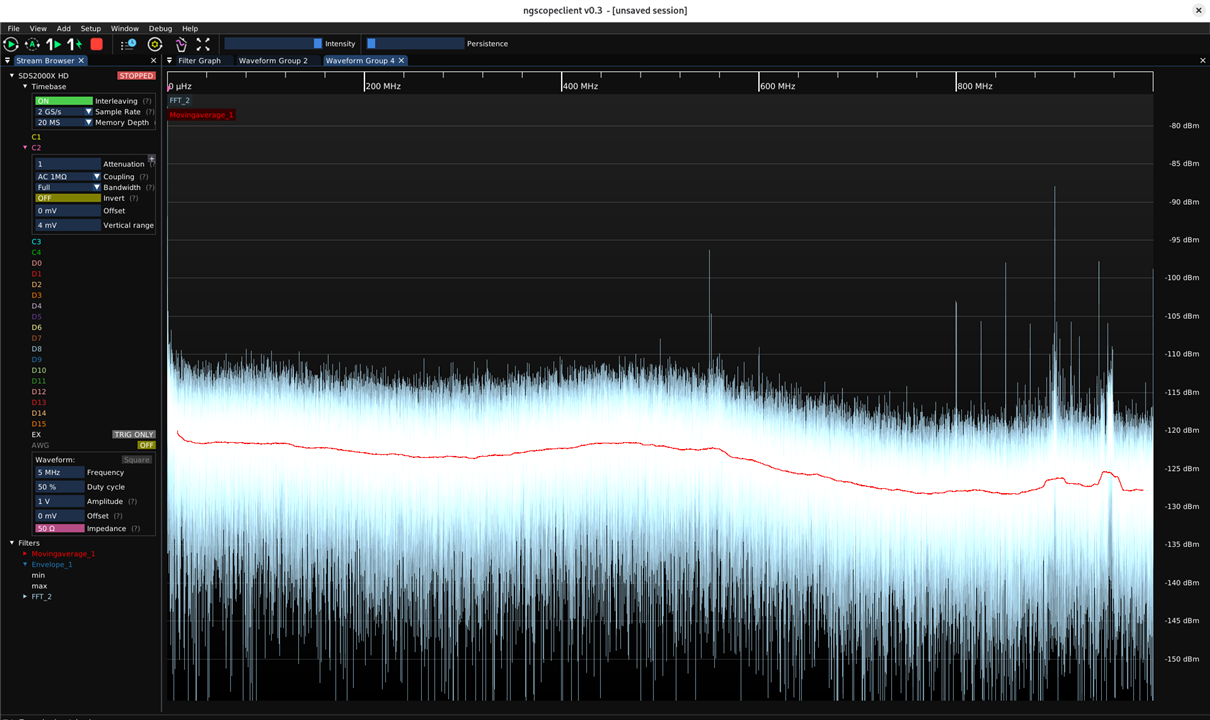
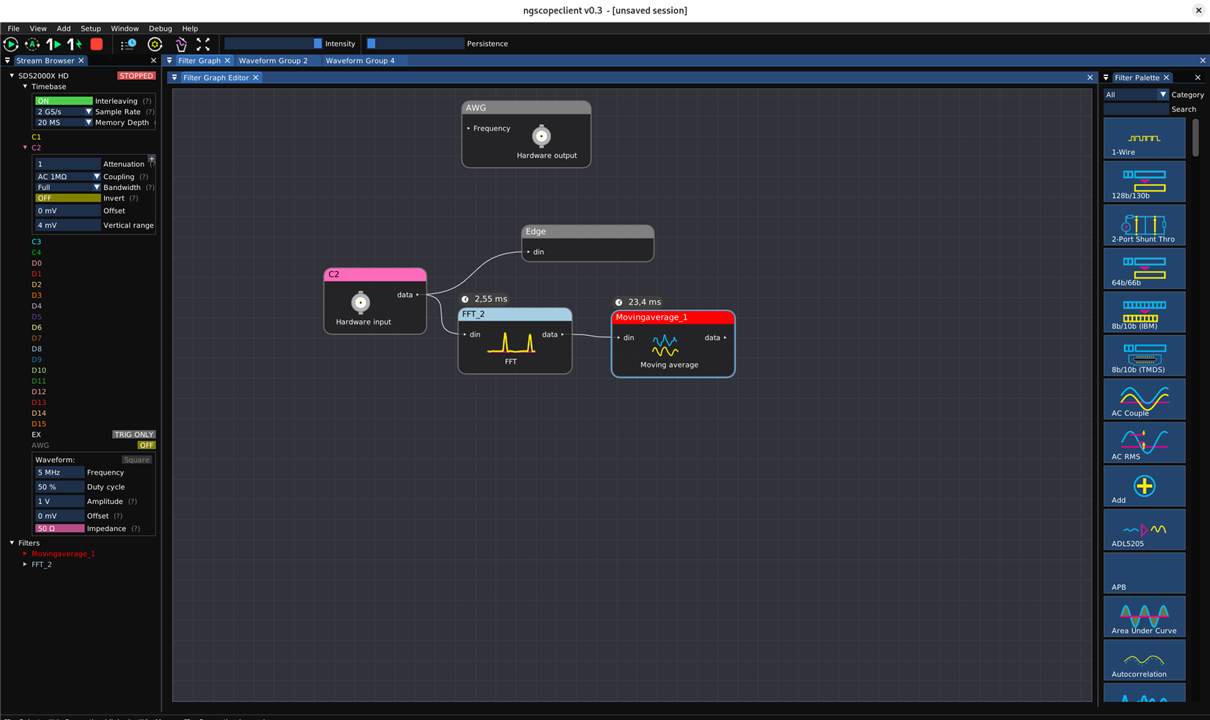
A nice feature is the presentation of the filters used for a given operation in the filter graph editor. It allows users to make quick changes directly at that level:
In each waveform group, you can use the cursors. Here is an example of how to use them to estimate the bandwidth: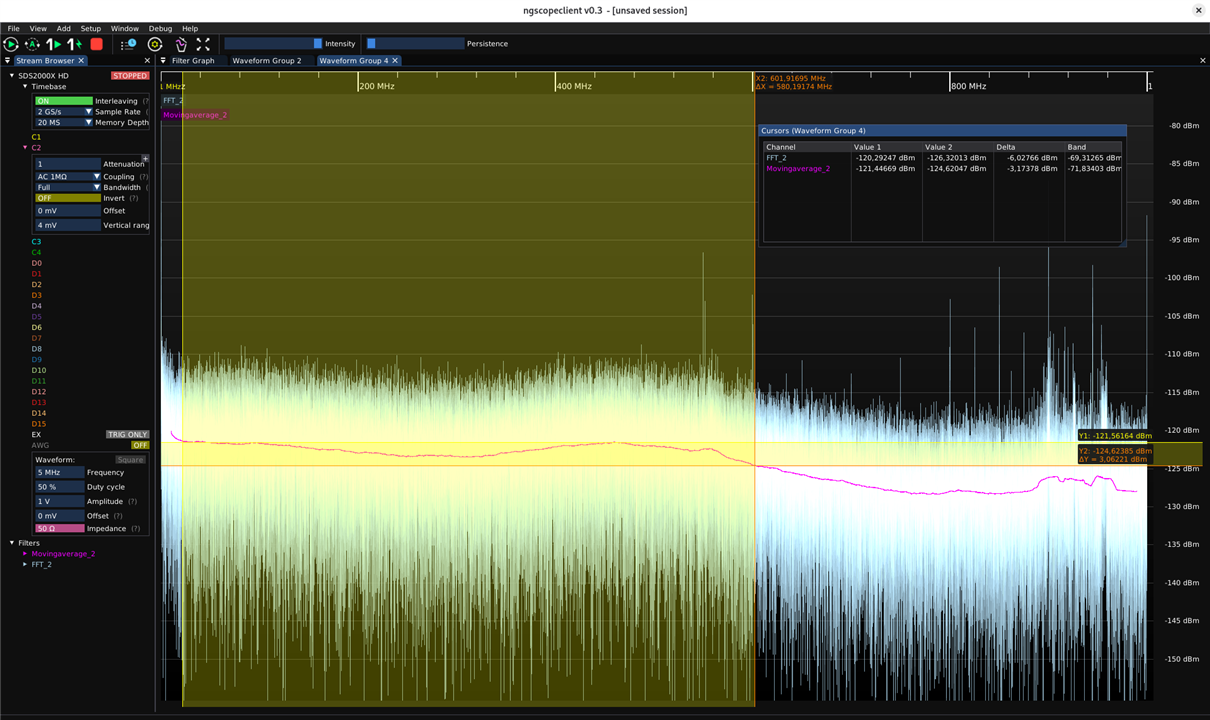
In general, this software offers many useful features that can be a nice addition if the stock device doesn’t already have them. One example is the waterfall display for the FFT: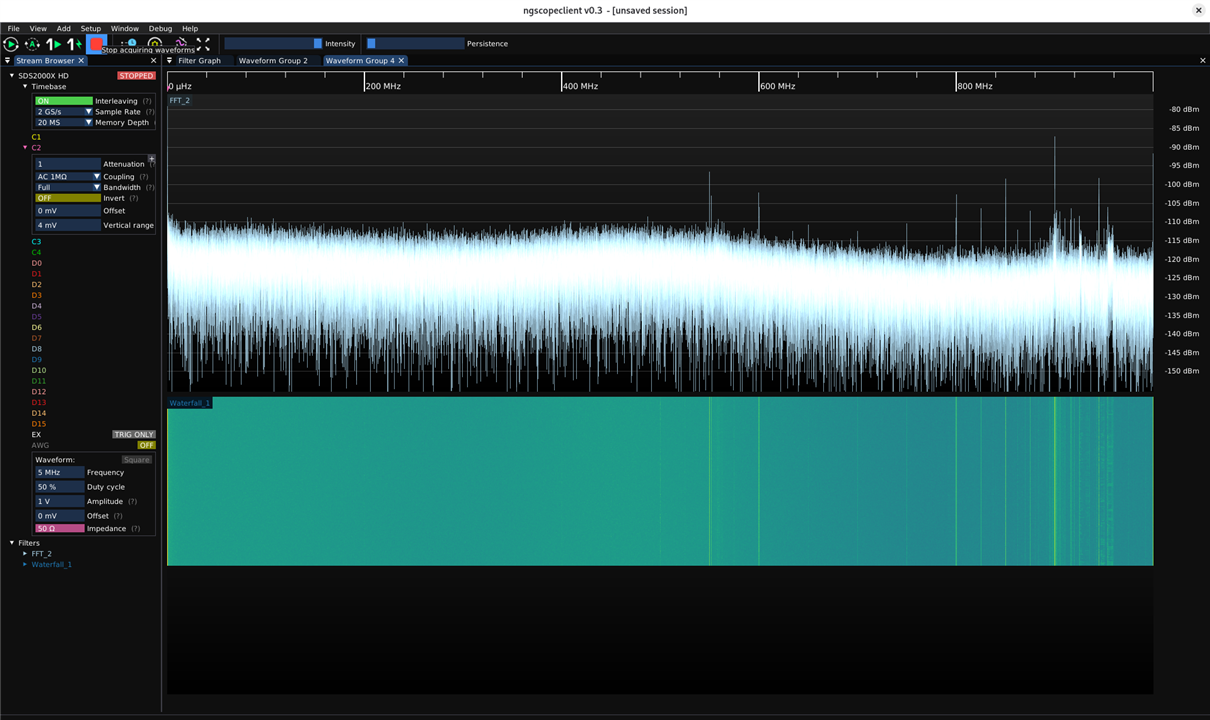
I need to get more familiar with this software. I think that using the digital channels will be particularly promising, thanks to the wide range of supported decoders and the more convenient way of viewing the results.


