


This blog post is part of a collection, click here for links to the entire set, and a review of the products.
Introduction
I was curious to try out the Agilent/Keysight N9322C spectrum analyzer (SA) with low level signals, and this needed a bit of experimentation. For a start, my home-made frequency synthesizer only goes down to a certain level.
This post documents how to create and measure low level signals using the capabilities of the SA.
Signal Generation
The SA has a built-in tracking generator if purchased with the TG7 option. This allows you to provide stimulus to your circuit or device under test (DUT). In some cases (such as amplifier tests), the output from the tracking generator will be too high.
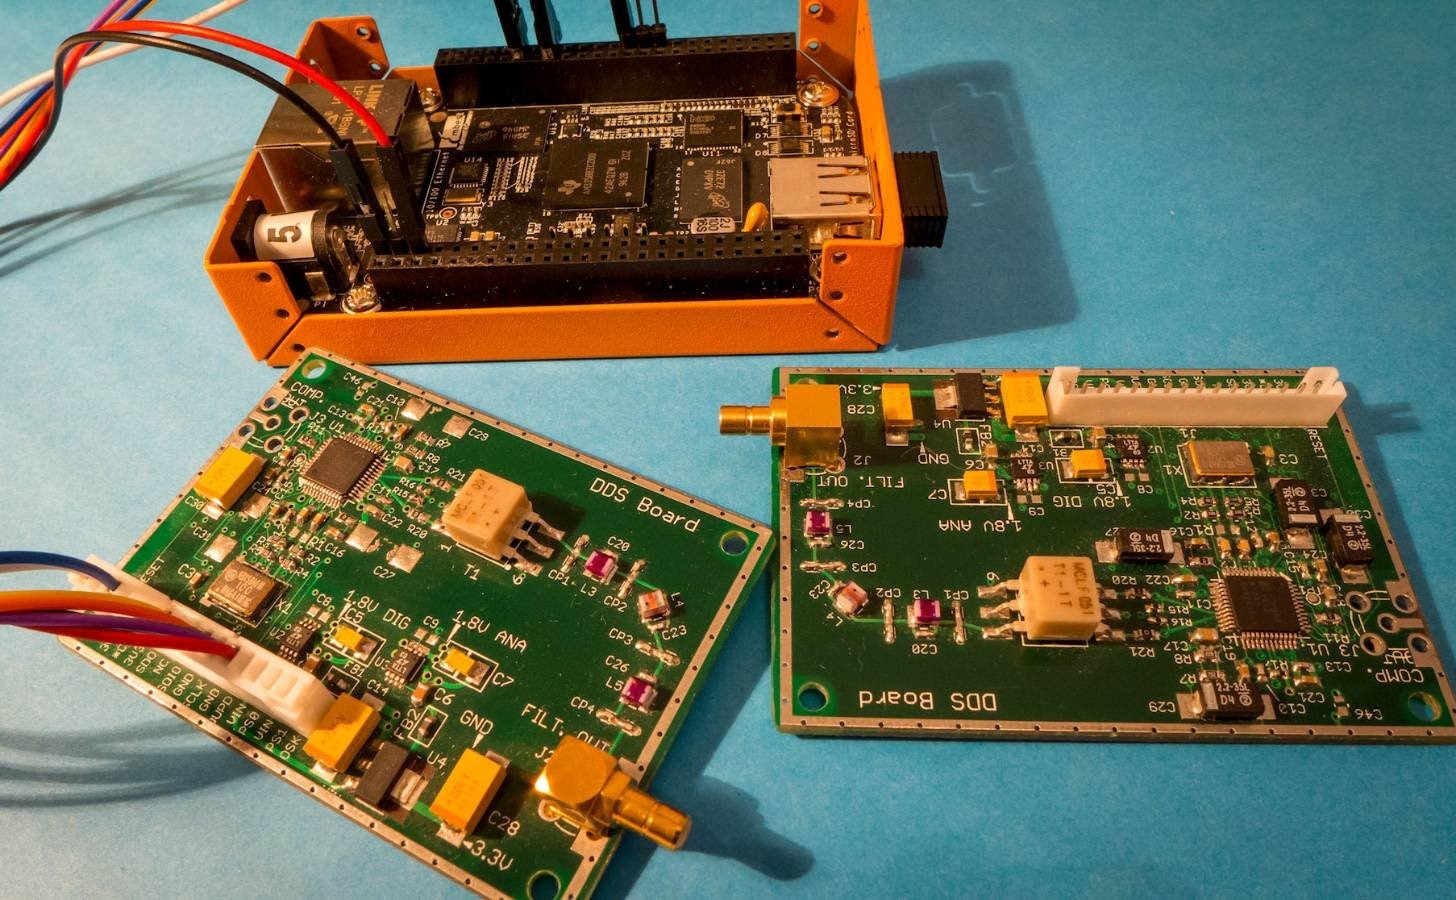
I decided to use a frequency synthesizer (check out the blog here if you wish to build one – it is controlled via a BeagleBone Black seen in the photo above in the orange case), and have been improving it over time, now it handles FM synthesis. So, it is possible to inject a single frequency or an FM signal into the SA. However, again, the signal level is too high. I needed to reduce it with an attenuator. I’d been meaning to test out a DIY attenuator for ages (I purchased the PCB from here), and it proved possible to do this using the built-in tracking generator on the SA. First, a quick look at dBm measurements and how and why they are used for measuring signals.
dBm and Transmission Lines Crash Course
Before getting into the detail of this blog post, it is worth quickly reviewing the dBm, what it means and how to use it, all from a non-maths perspective (there is a single formula below but it doesn’t need to be used).
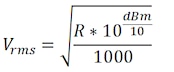
At DC or low frequencies, it is clear that often the amplitude in volts is used to measure a signal. At higher frequencies, a very common method of measurement is the dBm. This is a measure of power. The amplitude in volts can still be derived from this if needed with a formula. This statement wouldn’t make sense if the load was unknown, but it just happens that the load used is often 50 ohms for RF signals in general. The formula below would be used to calculate the voltage from the dBm value (R would be 50 ohms in this formula).
A question would be “why 50 ohms used and not another value”. It’s to do with the desire to use something known as “transmission lines” which are pairs of wires that have the interesting property that if you feed a signal of any frequency down one end, then the signal will be transmitted to the other end with no loss. The transmission line has inductance like any wire, but also has capacitance across the pair of wires (again like any pair of wires) all along the wire, and the exact amount of capacitance and inductance is “just right” to balance out and create a fixed resistance (known as the “characteristic impedance” of the pair) regardless of the length of the pair. 50 ohms is a value that is easy to create with today’s materials (also known as a dielectric placed between the wires) or with an air gap between the wires, for convenient wire thicknesses. Sometimes you see 300 ohms used (as an example) on home radio antenna connections, and the wires there are placed much further apart. A coax cable is a transmission line, and they come in 75 ohm and 50 ohm characteristic impedance versions so sometimes it is good to double-check before picking up a random coax, i.e. one cannot assume it is 50 ohms. By the way at lower frequencies such as audio or DC a coax is not used for its transmission line purposes, but rather for its shielding purposes.
It can sound confusing “how come a pair of wires can have an impedance of 50 ohms” but it could be proved by connecting a multimeter across the pair of wires and measuring, if you could perform the measurement quickly enough before the signal reached the other end and reflected back. This implies that in real use, the end of the transmission line must be connected to the same impedance as the characteristic impedance of the transmission line.
Now that it is clear that transmission lines are a useful thing and that we can standardise on 50 ohms, it means that a dBm measurement makes sense because we can always plug 50 ohms into the formula and we have complete information about the signal in this respect if all we’re concerned about is power or amplitude.
There are other points that could be made about measurements in dBm such as the fact that it is a logarithm of power and the convenience of that. Amplification and attenuation values can be added instead of being multiplied (this is a property of logarithms). Also, it is possible to learn a lot through just experimentation with numbers. There is a little decibel playbook type spreadsheet attached to this post that I created a while ago, and it is useful for quickly checking out what a particular value may mean in another unit. I don’t believe there are any bugs in it – I use it regularly for any conversions. Although there are plenty of calculators on the internet, some are incorrect.
To use this calculator, just enter a value in any green cell. The purple cells in the same column will auto-update, and then you can read off the value of interest. For example, you can see circled a scenario where the user is curious to know what 0.95 volts peak measured across 50 ohms could mean in terms of power. It can be seen that this is 9.554dBm.
Attenuator Testing
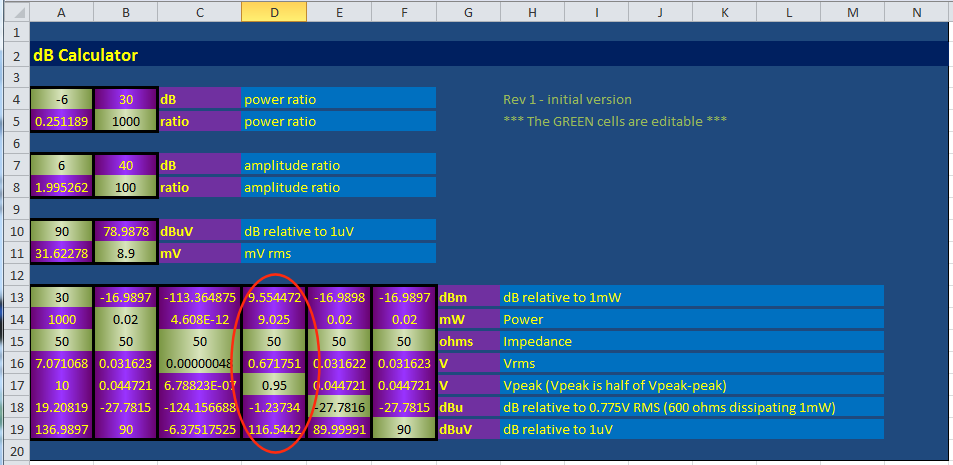
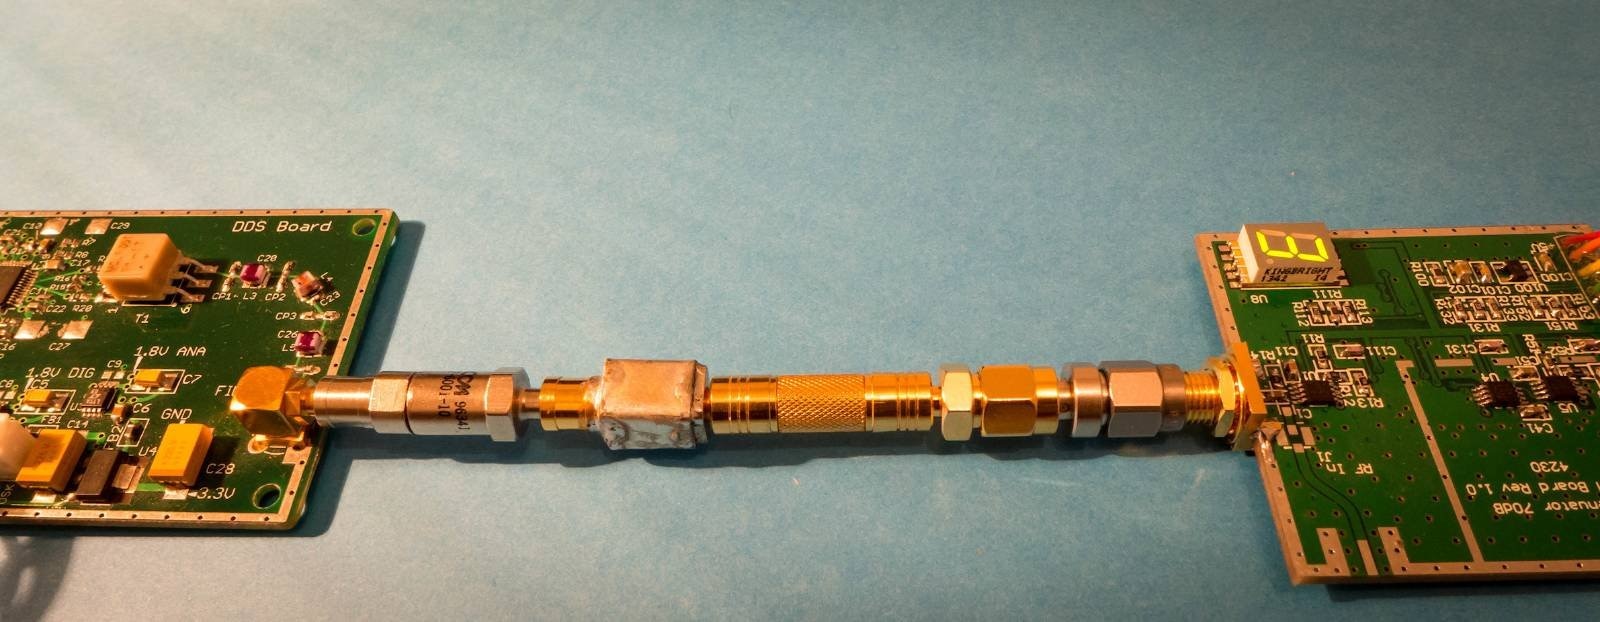
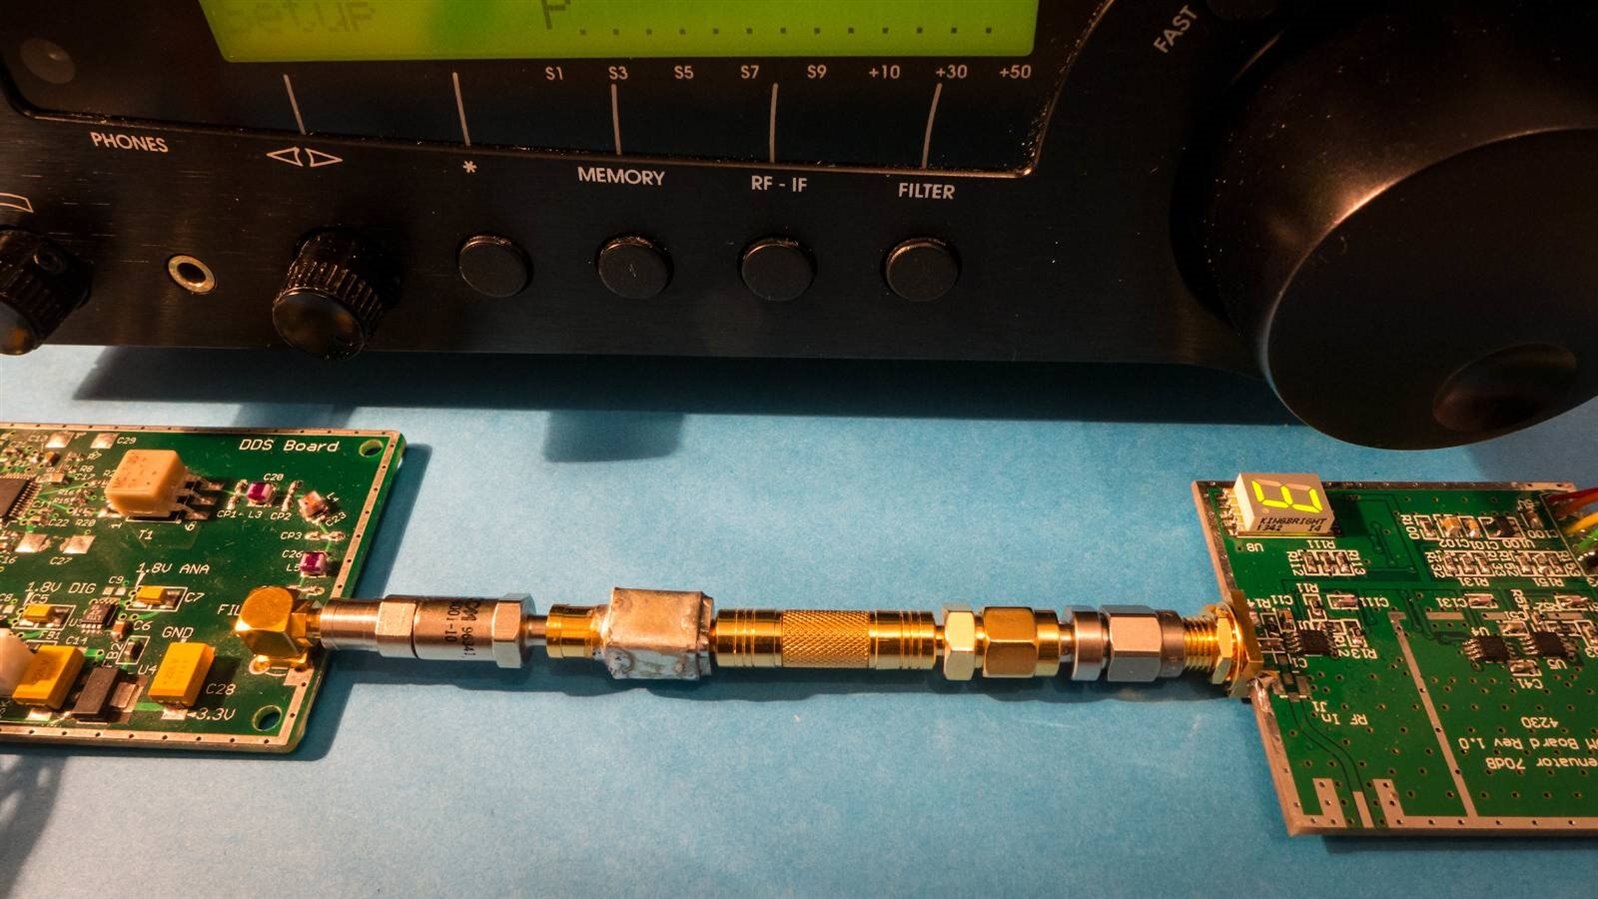
As mentioned earlier, I needed to test an attenuator to make sure it behaved as expected. The photo shows the attenuator board on the left. It is adjustable from 0dB to 70dB attenuation by adjusting a rotary switch and an LED display indicates the current setting. I need to build an enclosure for it.
On the right side of the photo, there is a 50 ohm load at the top, followed by three fixed attenuators. The bottom-most attenuator is a DIY one since it’s not economical to buy so many for home use. A lab would require precision attenuators to be purchased. To build your own attenuators for home use (but keep some known precision ones too), see this excellent page which shows the calculations for the three resistors that are needed.
As a side note, all the round connectors in the photo above are typical RF connectors; there are half a dozen commonly used varieties, and sometimes it is just down to personal preference. The threaded ones in the photo are known as SMA, the unthreaded ones are SMB, and the large one on the 50 ohm load is a TNC connector.
The test involved connecting the tracking generator output to the device-under-test (in my case, the attenuator) and then connecting the output of the attenuator to the input of the spectrum analyzer. Before doing this, the attenuator was removed from the system to double-check that the tracking generator was creating the correct output.
I wanted an attenuator as part of a solution to provide me a signal down to -120dBm and this is not the easiest thing in the world. It is clear that some shielding is required. Still, even without any shielding the results were quite acceptable. I tested the adjustable attenuator shown in the photo above together with fixed 40dB and 10dB attenuators all connected end-to-end so that I could reach 110dB of attenuation. The screen view below shows the attenuated signal (tracking generator set at -10dBm) for programmed attenuations of 80, 90, 100 and 110dB. It is a test at 865MHz (I only need this attenuator to function at under 1GHz).
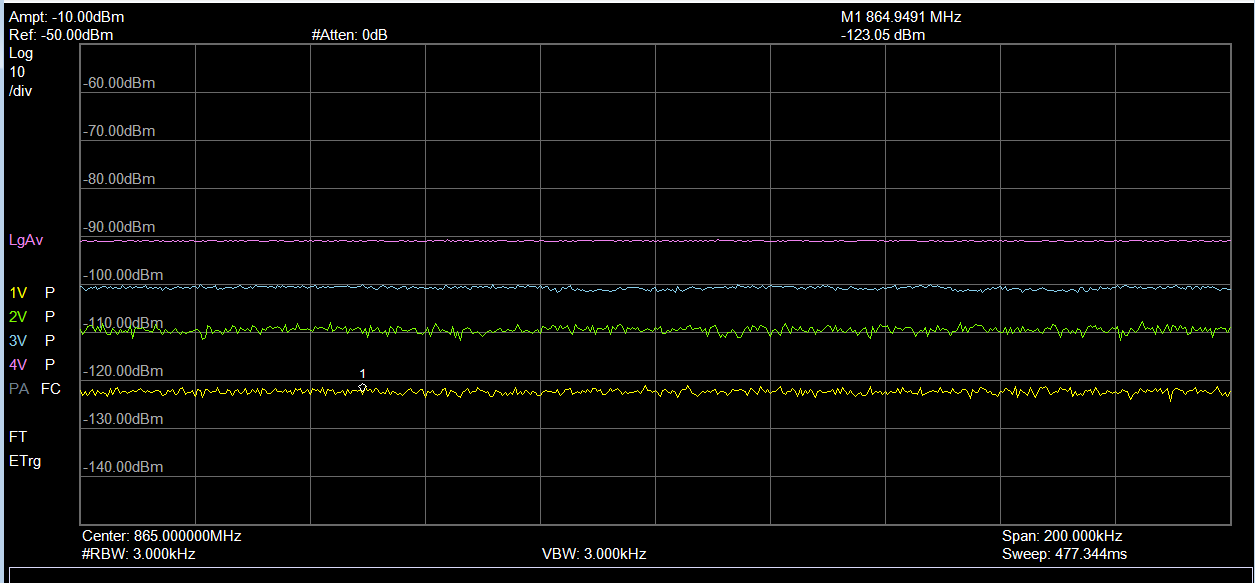
In order to achieve such small measurements on the SA, there are a few tricks. Firstly, the resolution bandwidth (also known as RBW; this is the filter bandwidth inside the SA, partly implemented with a digital filter) is decreased to a low value. This implies that the frequency span needs to be reduced to obtain measurements in a reasonable time too. The low RBW results in a lower noise floor. I also turned on the built-in preamplifier, and set the built-in SA attenuation from -20dBm down to 0dBm. In order not to destroy anything, I always switched off the tracking generator and the preamplifier and turned back on the SA built-in attenuation, before making any change to the device under test (i.e. the external attenuator) setting. I also turned on averaging for the very low power input signals.
There is also a ‘Preset’ button which allows you to go back to default settings. I think this will be extremely useful to always turn back on the attenuation, and leave the SA in a known state again.
It is also important to check exactly where the noise floor is, when performing low level measurements. As an example, according to the SA specification, it should be possible to typically achieve around -153dBm at 1-10MHz. So, I tried it:
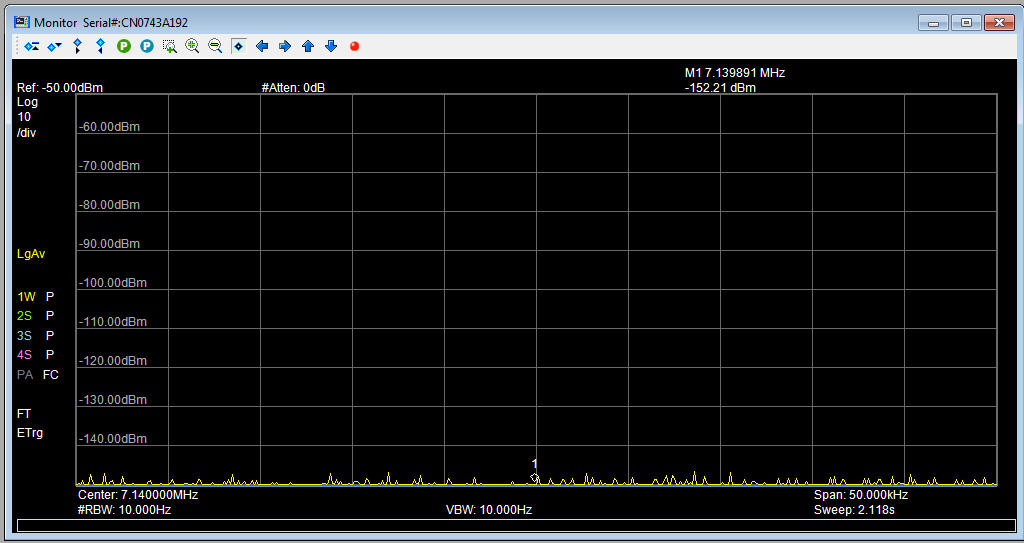
It really is astonishing having the ability to have such a low noise floor. There are of course SAs with lower noise floor values, but it is still surprising that -153dBm can be achieved on what is classed as a basic spectrum analyzer by Agilent/Keysight. As a comparison, the HP 8590 E-series (still in use) has a noise floor 25dB higher.
SINAD Measurements
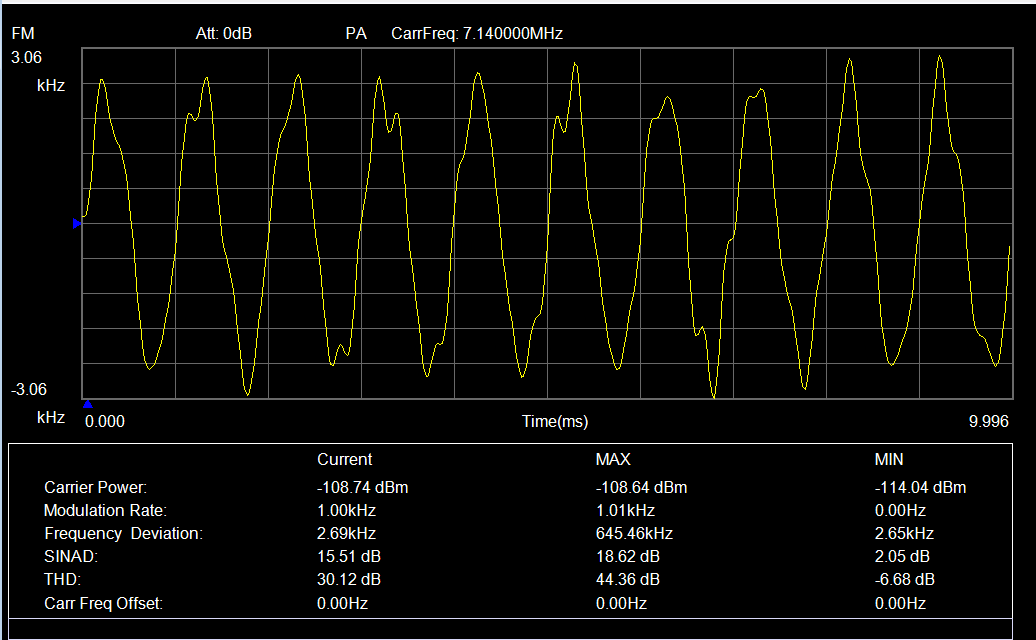
As another low-level signal experiment, I used my newly tested attenuator arrangement to check out how small a signal could be measured for FM modulation parameters using the SA (for more information check out the earlier blog post here). The “chain of attenuators” got me down to some very low signal levels.
Down to -108dBm, there was still a healthy report of 15.51dB SINAD for an FM input; this is still a perfectly decipherable audio transmission:
I was also able to use the frequency synthesizer and chain of attenuators to finally test out a radio receiver, by listening for the audio tone while progressively decreasing the attenuation.
Incidentally, while we're on the subject of low level signals and FM, the SA also has the capability to provide a time domain view of signals (much like an oscilloscope) while performing a decode. Therefore it is perfectly possible to plug in an antenna and pick up and listen to commercial broadcast stations. Here is a 30-second example (excuse the video quality [and poor choice of music], it was one-handed while holding the antenna):
Summary
It was great to be able to test out a project with the SA. I’m now satisfied that the attenuator is working well, so I can place it inside an enclosure. The attenuator has already now been put to good use, observing the output from the CC11xL wireless connectivity IC from Texas Instruments. The spectrum analyzer's in-built tracking generator and preamplifier are extremely handy. In conclusion the SA operates to a very respectable level of performance with a sufficiently low noise floor for many use-cases.
Top Comments