element14 Community
element14 Community
    Register Log In
  • Site
  • Search
  • Log In Register
  • Community Hub
    Community Hub
    • What's New on element14
    • Feedback and Support
    • Benefits of Membership
    • Personal Blogs
    • Members Area
    • Achievement Levels
  • Learn
    Learn
    • Ask an Expert
    • eBooks
    • element14 presents
    • Learning Center
    • Tech Spotlight
    • STEM Academy
    • Webinars, Training and Events
    • Learning Groups
  • Technologies
    Technologies
    • 3D Printing
    • FPGA
    • Industrial Automation
    • Internet of Things
    • Power & Energy
    • Sensors
    • Technology Groups
  • Challenges & Projects
    Challenges & Projects
    • Design Challenges
    • element14 presents Projects
    • Project14
    • Arduino Projects
    • Raspberry Pi Projects
    • Project Groups
  • Products
    Products
    • Arduino
    • Avnet & Tria Boards Community
    • Dev Tools
    • Manufacturers
    • Multicomp Pro
    • Product Groups
    • Raspberry Pi
    • RoadTests & Reviews
  • About Us
  • Store
    Store
    • Visit Your Store
    • Choose another store...
      • Europe
      •  Austria (German)
      •  Belgium (Dutch, French)
      •  Bulgaria (Bulgarian)
      •  Czech Republic (Czech)
      •  Denmark (Danish)
      •  Estonia (Estonian)
      •  Finland (Finnish)
      •  France (French)
      •  Germany (German)
      •  Hungary (Hungarian)
      •  Ireland
      •  Israel
      •  Italy (Italian)
      •  Latvia (Latvian)
      •  
      •  Lithuania (Lithuanian)
      •  Netherlands (Dutch)
      •  Norway (Norwegian)
      •  Poland (Polish)
      •  Portugal (Portuguese)
      •  Romania (Romanian)
      •  Russia (Russian)
      •  Slovakia (Slovak)
      •  Slovenia (Slovenian)
      •  Spain (Spanish)
      •  Sweden (Swedish)
      •  Switzerland(German, French)
      •  Turkey (Turkish)
      •  United Kingdom
      • Asia Pacific
      •  Australia
      •  China
      •  Hong Kong
      •  India
      •  Korea (Korean)
      •  Malaysia
      •  New Zealand
      •  Philippines
      •  Singapore
      •  Taiwan
      •  Thailand (Thai)
      • Americas
      •  Brazil (Portuguese)
      •  Canada
      •  Mexico (Spanish)
      •  United States
      Can't find the country/region you're looking for? Visit our export site or find a local distributor.
  • Translate
  • Profile
  • Settings
Test & Tools
  • Technologies
  • More
Test & Tools
Blog PA1000 RoadTest - Part 3
  • Blog
  • Forum
  • Documents
  • Files
  • Members
  • Mentions
  • Sub-Groups
  • Tags
  • More
  • Cancel
  • New
Join Test & Tools to participate - click to join for free!
  • Share
  • More
  • Cancel
Group Actions
  • Group RSS
  • More
  • Cancel
Engagement
  • Author Author: COMPACT
  • Date Created: 17 May 2014 5:23 AM Date Created
  • Views 705 views
  • Likes 0 likes
  • Comments 3 comments
Related
Recommended

PA1000 RoadTest - Part 3

COMPACT
COMPACT
17 May 2014

Software

image


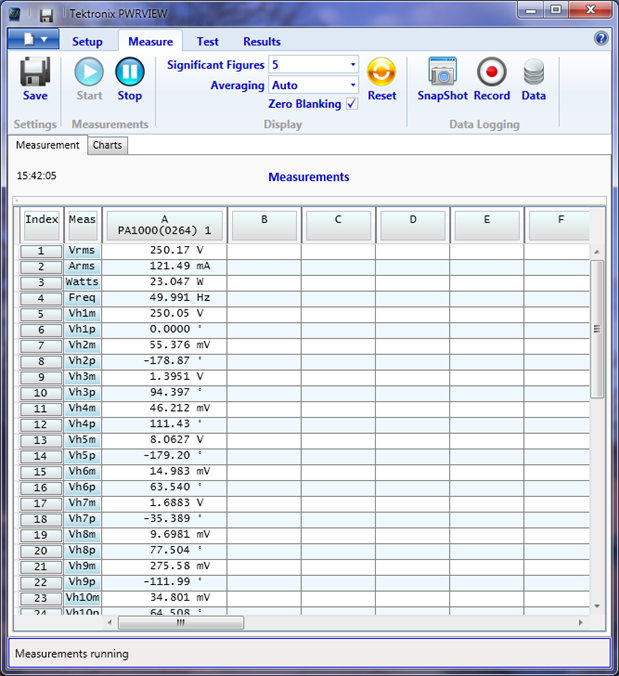
Figure 17 – Screen Shot of PWRVIEW Measure Form


Like many other test instruments connected to a PC such as oscilloscopes and function generators VISA is used as the transparent connection mechanism between PA1000 and the PC workstation.  VISA is an acronym for Virtual Instrument Software Architecture that provides application independence from the test instrument connection medium by providing a standardised access protocol to test instrumentation. Like a networking protocol VISA each test instrument has its own unique address and has spy programs available to view VISA messages for diagnostic purposes.

VISA supports physical mediums such as GPIB, USB and Ethernet. Interestingly the PA1000 Ethernet interface does not use VISA but a direct connection to the PWRVIEW application.

I won’t delve too far into this subject but suffice it to say that at least two existing versions of VISA; NI-VISA from National Instruments and TEKVISA from Tektronix. They are aware of each other and can co-exist on the same machine but can complicate matters. In fact the TEKVISA suite provides a Conflict Manager to cater for this circumstance and enables each instrument to be associated with the VISA environment of your choice. Disappointingly the TEKVISA needs to be disabled in order for the PWRVIEW application to work with the PA1000. Hopefully Tektronix will address this issue.

image

Figure 18 – Conflict Manager


Software Installation

The PA1000 software called PWRVIEW is downloadable from the Tektronix website. Two Windows versions are available – one for 32-bit and the other 64-bit.  The installation executable attempts to check the presence of and install its required prerequisites prior to installing the PWRVIEW application. The prerequisites are NI-VISA version 5.1.1 and .NET Framework 4.0.
As much as one wants a seamless installation process the PWRVIEW for me wasn’t on both Windows 7 32-bit and 64-bit. When installation process detects its need for a prerequisite to be installed it launches the prerequisite’s installation program and then waits for its successful completion before proceeding to the next step.  The prerequisites require a system reboot as a part of their installation process and although this type of activity is not unusual but for some reason after the mandatory system  reboots the installation process attempt to resume but fail by halting with an error message. This is no show stopper because the installation process can be relaunched and the subsequent attempt detects the installation of any prerequisites and proceeds to the next step.

image

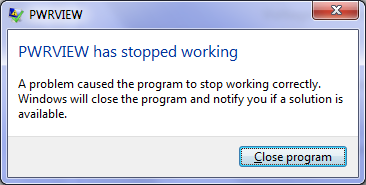
Figure 19 - The error screen when attempting to run 32-bit PWRVIEW on a 64-bit machine.


PWRVIEW Operation

image

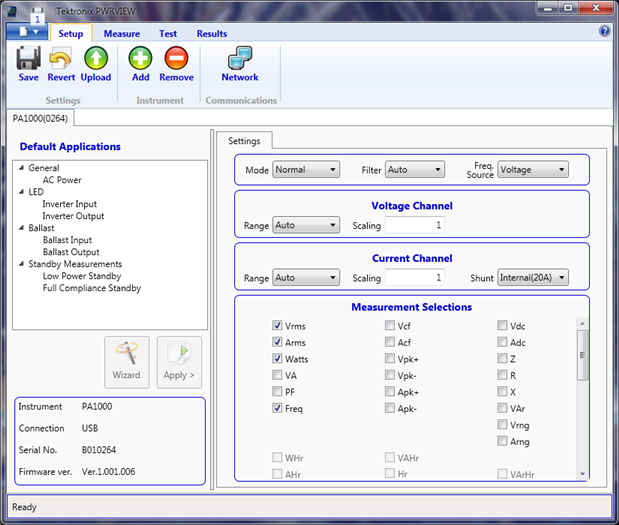
Figure 20 - PA1000 Configuration Page


The PWRVIEW software is designed to remotely operate with the PA1000 and PA4000 range of Power Analysers. It has a Setup form that makes remote configuration straightforward. All of the parameters from the Power Analyser’s nested menu system are presented on a single form making for quick and easy configuration. Once the parameters have been set to your liking they can be uploaded into the Power Analyse with the press of the Upload button.


The Setup form also contains several Wizard options to assist with the DUT and test instrument connection and configuration of parameters. Attached are some sample screenshots to illustrate the point.

image

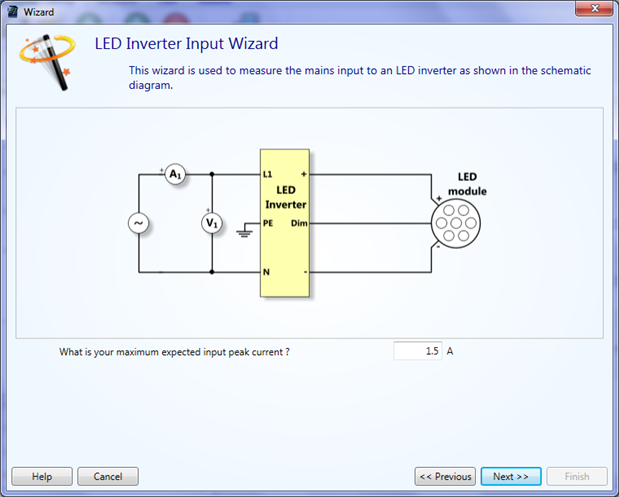
Figure 21 - LED Inverter Wizard


image

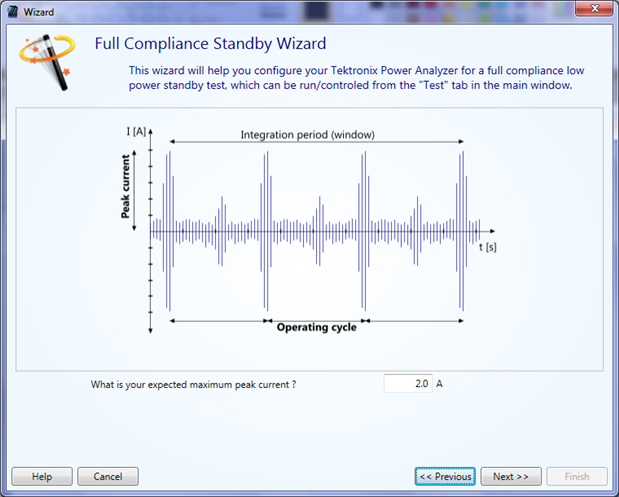
Figure 22 - Full Compliance Standby Wizard Page 1

image

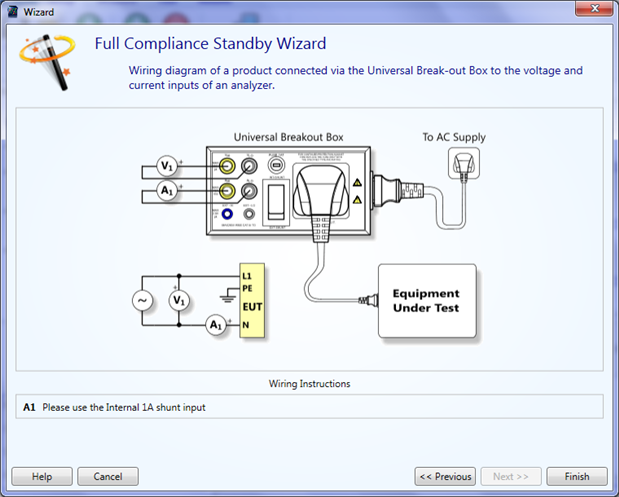
Figure 23 - Full Compliance Standby Wizard Page 2


Like the original PA1000 firmware the current version of power view has not been completely converted across for Tektronix.  Figure 22 shows a Voltech Breakout box rather than the Tektronix Breakout box.


image

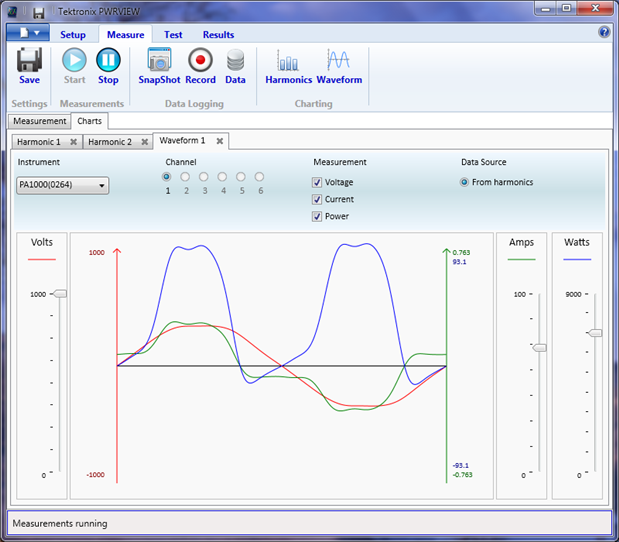
Figure 24 – Waveform view.


The PWRVIEW graphs use continuous smooth lines and are much prettier than the graph display on the PA1000 and have the ability to be easily scaled or zoomed. Operation is straightforward once one understands that the Start button needs to be depressed to commence the desired activity. The scaling sliders are not necessarily linear. For the Power scale the slider is exponential.


image

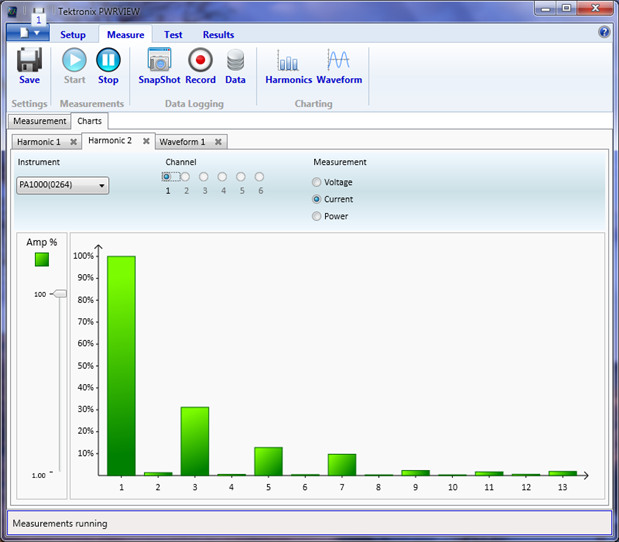
Figure 25 – Current Harmonic Graph


There are quite a large range of forms and graphs and all are useful for diagnostic purposes. Pictured above is a Current harmonic graph of a Notebook SMPS (Switch Mode Power Supply) and from it one can see that it would not have great PF (Power Factor).

For development one would want to only have the fundamental frequency present.  This alone is not enough to ensure a good PF. The current signal should be in phase with the input voltage. Details of this can be seen from the Waveform view where one can see the phase relationship between current and voltage. It can bee seen from Figure 24. that the current is in phase but the wave form is non-sinusoidal.


In addition to the local use of USB Memory Sticks on the PA1000 front panel PWRVIEW provides the convenience of direct logging onto disk. This can be useful depending when operating in a laboratory or workbench scenario. The data that has been logged to disk can be further processed or analysed as required.


The PA1000 Power Analyser its PWRVIEW application is a very convenient and powerful combination for those who deal with single phase power analysis. I'm sure that this product will contribute towards efficiency improvements for many future products.

  • Sign in to reply
  • DAB
    DAB over 11 years ago in reply to COMPACT

    Very nice.


    Thanks Monte.


    DAB

    • Cancel
    • Vote Up 0 Vote Down
    • Sign in to reply
    • More
    • Cancel
  • COMPACT
    COMPACT over 11 years ago in reply to DAB

    Hi Don,


    You don't have permission to edit metadata of this video.
    Edit media
    x
    image
    Upload Preview
    image

    (Apologies for the poor focus!)

    The data logging function has two various destinations being a USB memory stick inserted into the PA1000 or a PC's file system when operating remotely via PWRVIEW.

    For Integration mode logging can be configured to commence manually or from a preset time of the PA1000's internal time of day clock. The logging duration can be set from 1 minute to 1,000,000 minutes.

    PWRVIEW also has a Data Logging facility where you can continue to capture PA1000 readings. I could not find a duration setting for this option so I assume it is manually controlled.

    The measurement readings can be exported to a multiple page Excel workbook.


    imageimage


    By its very nature Standby Power compliance also performs data logging. It duration can be set as desired.


    image


    The peaks logged in the graph are caused by having the load (Notebook PC) shut down. This was done deliberately to provide a range of variable readings for demonstration.


    image

    The PA1000 has an inrush current measurement mode for measuring switch-on and other transient peak currents. The choice of current sensor used depends on the envisaged peak current to ensure that the peak reading is within range.

    The standard display parameters are A+peak, A-peak, V+ and V-.  The displayed A+peak and A-peak values lock on to the peak values encountered. The V+ and V- values are display real time values. The Refresh button is used to reset the A+peak and a-peak values in preparation for a new test reading.

    • Cancel
    • Vote Up 0 Vote Down
    • Sign in to reply
    • More
    • Cancel
  • DAB
    DAB over 11 years ago

    Hi Monte,


    Good post.

    How long can you run the data collection test for the various inputs?

    Also, does it have the ability to detect power transients?


    DAB

    • Cancel
    • Vote Up 0 Vote Down
    • Sign in to reply
    • More
    • Cancel
element14 Community

element14 is the first online community specifically for engineers. Connect with your peers and get expert answers to your questions.

  • Members
  • Learn
  • Technologies
  • Challenges & Projects
  • Products
  • Store
  • About Us
  • Feedback & Support
  • FAQs
  • Terms of Use
  • Privacy Policy
  • Legal and Copyright Notices
  • Sitemap
  • Cookies

An Avnet Company © 2025 Premier Farnell Limited. All Rights Reserved.

Premier Farnell Ltd, registered in England and Wales (no 00876412), registered office: Farnell House, Forge Lane, Leeds LS12 2NE.

ICP 备案号 10220084.

Follow element14

  • X
  • Facebook
  • linkedin
  • YouTube