

The Agilent 34461A provides many different connectivity options, USB, LAN and GPIB (as an optional extra), which means that it should easily fit into a modern lab or test system. For test systems, it is likely that custom software will be written to control the entire system, however, for a lab this is often not the case, relying on the manufacturers software. Agilent provide two connectivity utilities to do this, the first is meant for Windows computers and the second is meant for the Apple iPad.
Windows software
With the multimeter, Agilent shipped two discs - one containing the manual and one containing the IO libraries. Neither of these contain the connectivity software, which has to be downloaded from their website.
When you insert the IO libraries disc, you are greeted by the following screen.
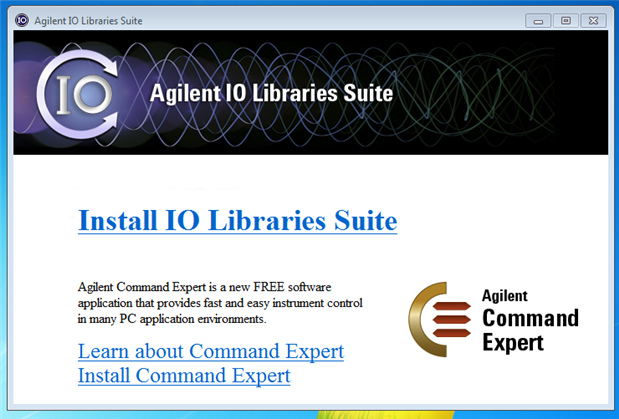
With clicking on the large link for the IO libraries starts the installation. The installation is a typical InstallShield,
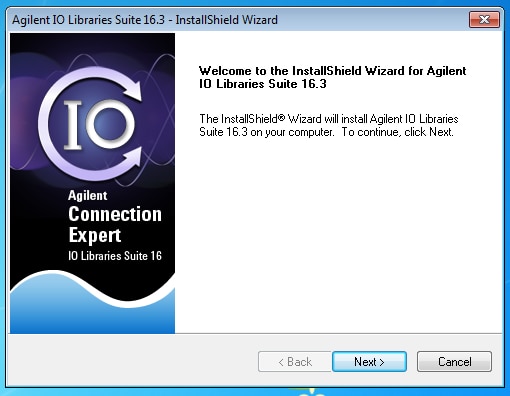
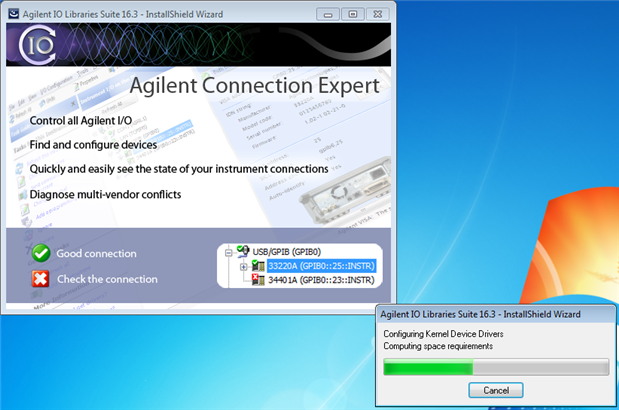
and I decided to go with the typical options. The installation only takes a few minutes, with the installer displaying the typical advertising / promotional material.
The installation ends in a different way to normal InstallShields,
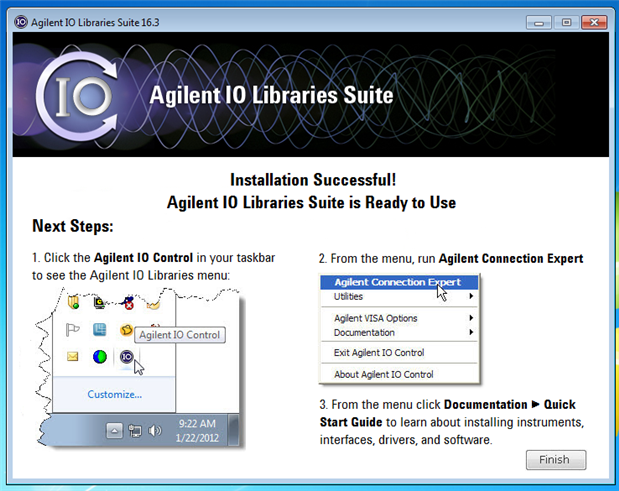
with some information on how to run the program - which I think is quite a nice idea.
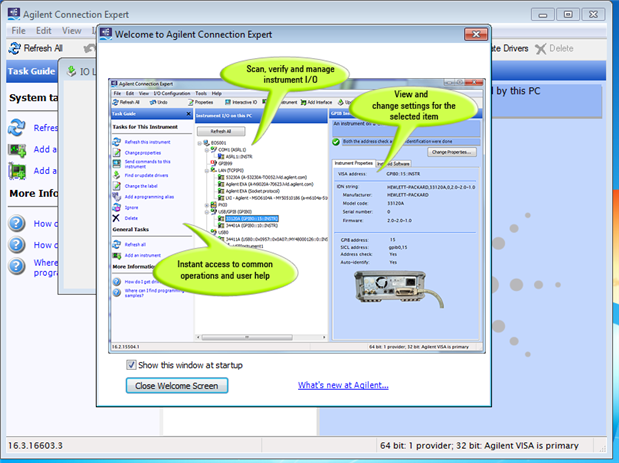
On opening the ‘Connection Expert’, as per the instructions, you are met by a welcome screen, which nicely points out what the different panels of the interface do.
This was also followed by an update screen,
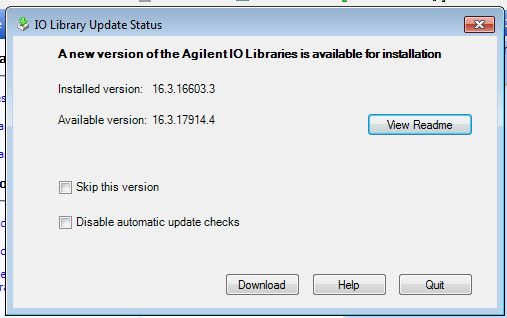
at this point I was a little annoyed. Whilst I understand that the shipped discs cannot be kept as up to date as the website, it is quite common, these days, for the installation software to check for an update prior to installing. I decided to do the update and so, after downloading the 241 MB file, I essentially repeated the above (as Agilent only provide full installers, not update installers).
After installing the update, restarting the computer and re-opening the ‘Connection Expert’, I plugged in the multimeter using USB and it was quickly detected.

At this point, you can send SCPI commands to the multimeter, but there is no graphical interface to use as this has to be downloaded separately. I think the reason why it is separate, is because users of matlab and labview will only need to install the IO libraries, but it would have been nice to have an option in the installer to point you at the right part of the website.
The connectivity software is just over 100 MB in size, but takes longer to download than it does to install (with an installation of less than a minute). It is also quite quick to open, with you soon being greeted by a dark screen.
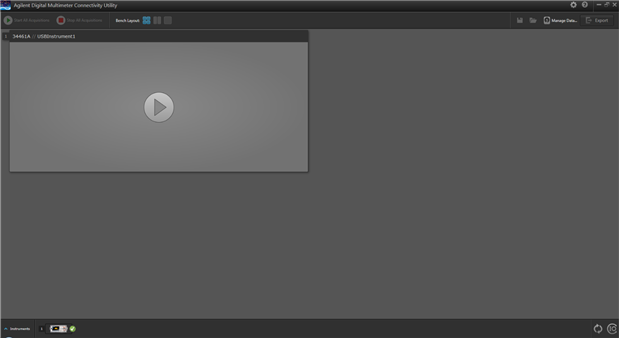
Clicking on the play button starts communication with the device and allows the software to control it. I liked how when it does this, it asks if you want to keep the data that is already in the readings memory of the multimeter.
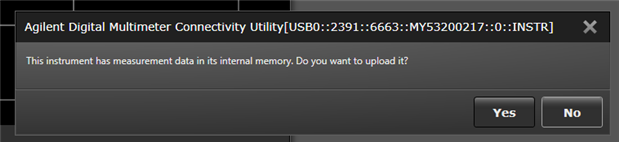
I decided to not upload the data and I instead hit the green play button in the bottom left hand corner of the instrument display. This starts fetching data from the multimeter and resulted in this,
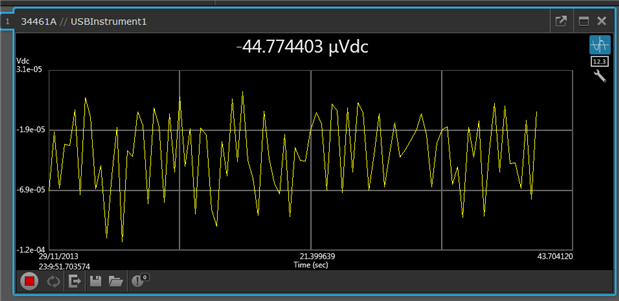
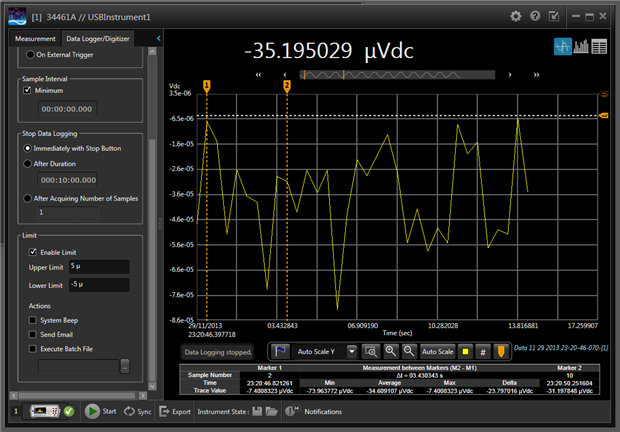
This is essentially the same view as what is available on the multimeter, but clicking on the square with the arrow point out of it (in the top right of the image) opens a bigger display.
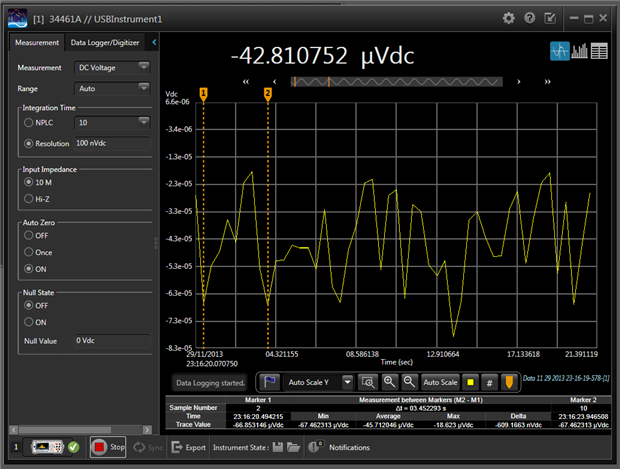
This display is quite useful, especially with the two markers that can be dragged across the collected data. The bar underneath the numerical display at the top of the window, shows the zoom level and allows you to pan across the recorded data. Which is useful and reminiscent of digital oscilloscopes with large memories.
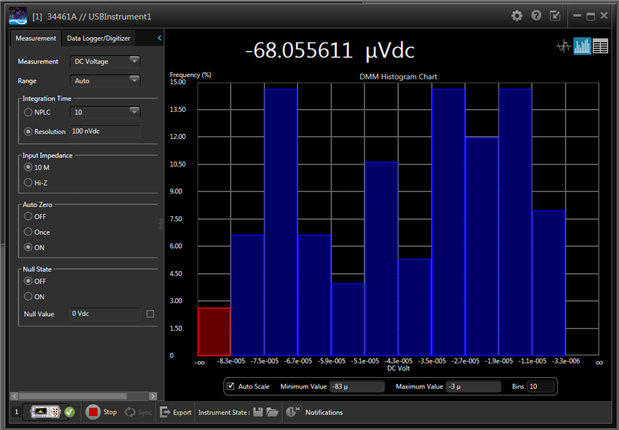
The software also provides a histogram view of the data (selectable under the window close button). I was a little surprised at this, as the above shows the software with ‘auto scale’ enabled and yet the red bin is an outer bin, collecting data that doesn’t fit into the histogram. I tried this a couple of times and I seemed to always get one of these outer bins appearing, so the auto scaling could definitely be improved for this. Functionality wise, this is similar to what is available on the multimeter, but has the advantage of a higher resolution. There is additionally a table view of the data, which I haven’t taken a picture of, which isn’t particularly useful by itself.
The interface is very consistent, with fonts, colours and units remaining constant. However, this is not the case when entering values.
For some strange reason, the inputs when clicked change to scientific notation. Whilst this is probably because keyboards lack a mu key, I don't see why they don't use 'u' instead. This change also means you have to write milli as e-3 rather than 'm'. As soon as you click off the field, the software converts it to the correct SI prefix, but it seems very unnatural that you can't change the value you see.
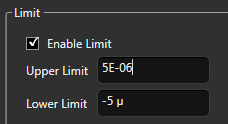
Whilst most of the software is similar to the multimeter, I was intrigued at how the limits would work. On the 34461A, when a limit is hit the multimeter beeps and the screen turns red (or part of it does in the tend chart and histogram). The connectivity software does not do this and acts quite strangely.
Every setting, entered on the left hand side of the previous image, is mirrored on the multimeter pretty much instantly. The software also requests single readings from the multimeter, with old readings being cleared. This means that when the readings exceed the limits, the multimeter will beep for every reading and flash between its normal display and a red version. However, the strangest part is that the software on the computer does not acknowledge that a limit has been exceeded. In the above image, the horizontal dotted line marked as ‘L’, is the lower limit with all the data being below that. I would have expected that the screen would do something similar to the multimeter, that is turning the display red, or at least have some warning displayed. The lack of this makes the connectivity software limit functionality pointless.
One of the nice things with the software is that it saves every set of readings.
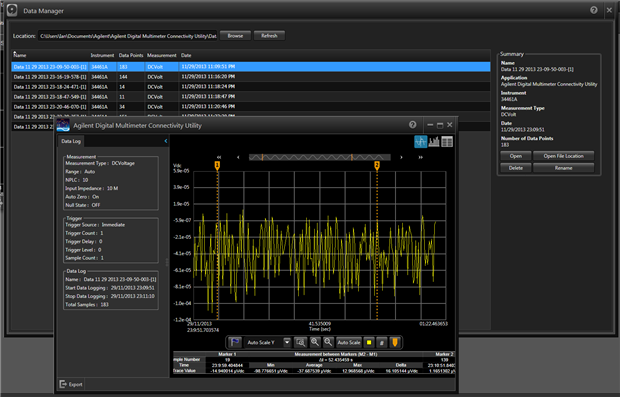
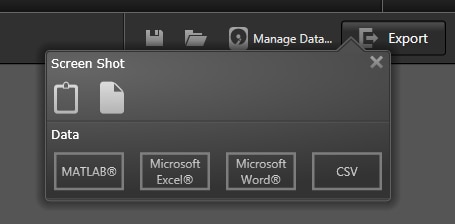
Whilst this might eventually fill up your hard disk, if you forget to delete the unneeded data, it is something that might save you from your mistakes. As you would expect, the collected data can be exported to a number of programs, which I have not tried.
Overall, the Windows software is quite simple to use and install, with the installation and updates taking less than 20 minutes to install (including downloading time). It is a little annoying that as soon as you install the software it asks you to download a new version but on the whole it is quite a smooth experience.
The connectivity software, for controlling the multimeter, is fairly well designed - it has an odd colour scheme but allows you to use the majority of the multimeter’s features. I particularly like the draggable markers and how the software shows some very basic statistics on the data between the two markers. The issue with the software not indicating if the set limits have been exceeded might be a problem for some people. But I don’t think many people will use this software on a day to day basis. It is functional, with the graphs being more useful than what is on the multimeter, but I can only see it being used for basic usage. For example, I can imagine that this would be very useful in a school’s or university’s lab, where you can put the data into excel to make a printable graph, but I think any other users would be wanting the software to do more and so would likely use something like LabView directly, or write their own software.
IPad software
I was quite surprised to see that Agilent had made an iPad application for remotely controlling the multimeter. As if you need to remotely control the multimeter you will likely want to do this from a computer, as you can quite easily move the data into another piece of software for analysis. The iPad application only offers the same functionality that is on the multimeter, admittedly with a better visual resolution and interactivity, and so is only really meant as either a larger display for the multimeter or for data collection, with analysis being performed at a later point. I feel that these are both limited uses and I can't foresee many people using the iPad application. However, I can see it being quite effective as a marketing tool, especially at road shows.
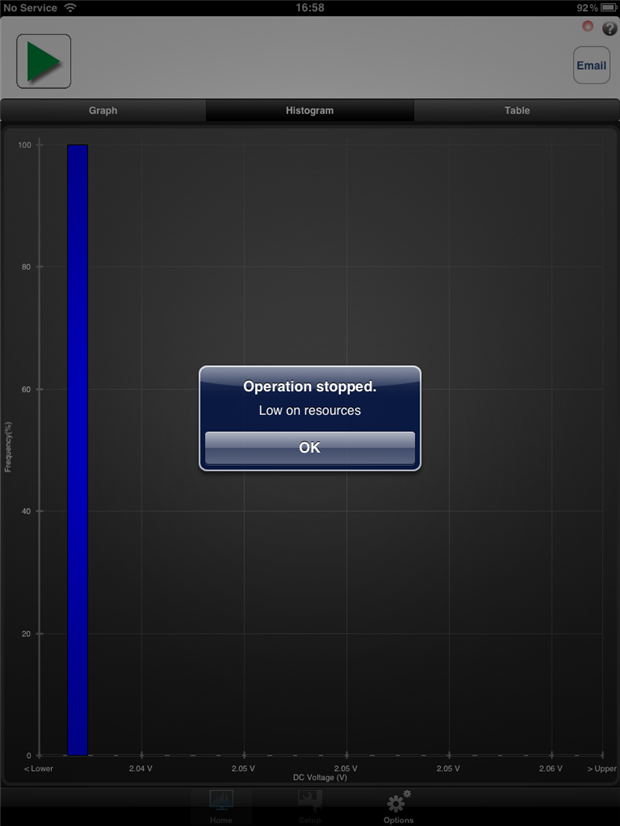
Whilst I do not own an iPad, I was able to borrow a first generation device to test the application on, which was running the latest version of iOS available (5.1.1). However, the age of the device, over three and a half years, might have affected the application, as it crashed and reported that it had ran out of memory quite frequently.
Unfortunately, without having access to any other version of the iPad, I was not able to determine if this was an issue of old hardware or if it was a software problem. Despite these problems, I was able to use most of the application.
The application appears to mimic the functionality of the Windows software, with the settings laid out in a similar way.
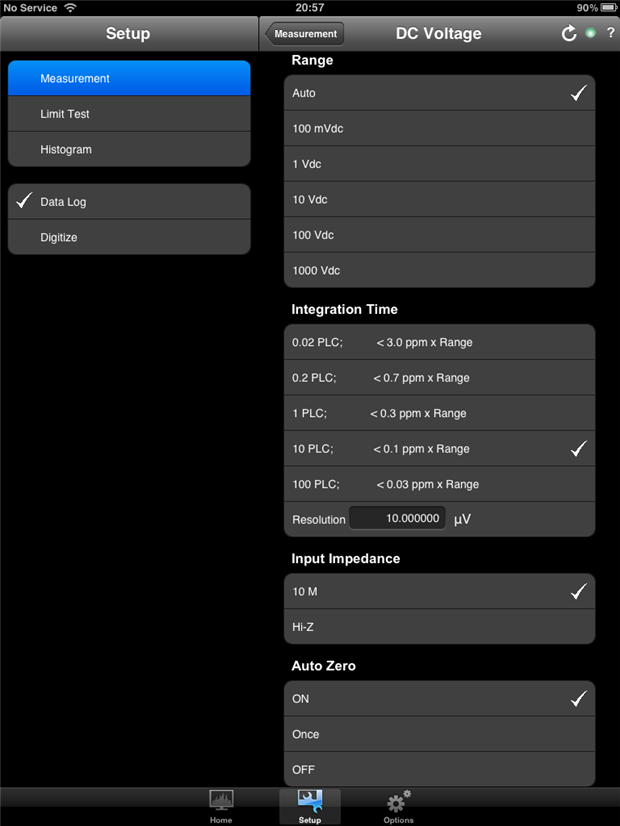
This arrangement makes the settings easy to use and quite logical, which is a bonus.
Like with the multimeter and the Windows software, there are three different views. The graph,
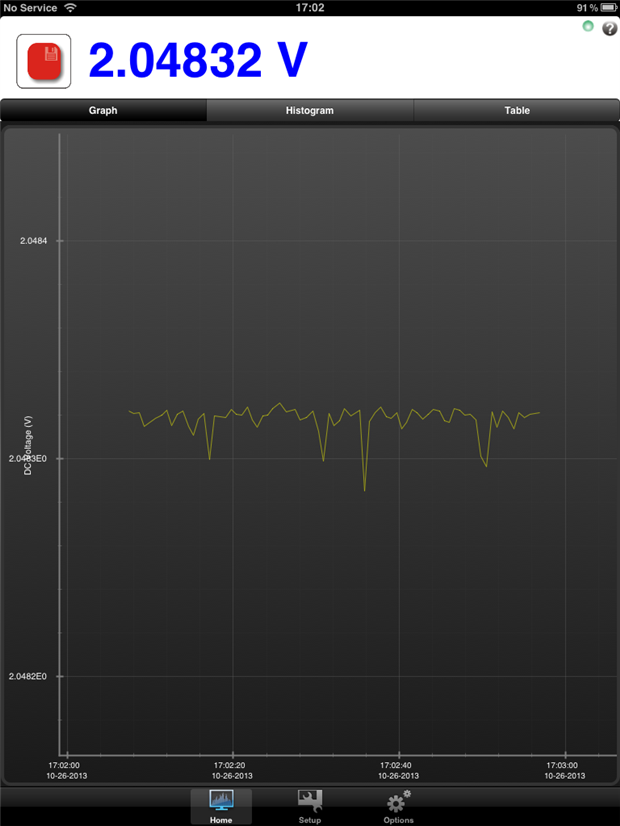
which uses the same colour scheme as the Windows software, the table,
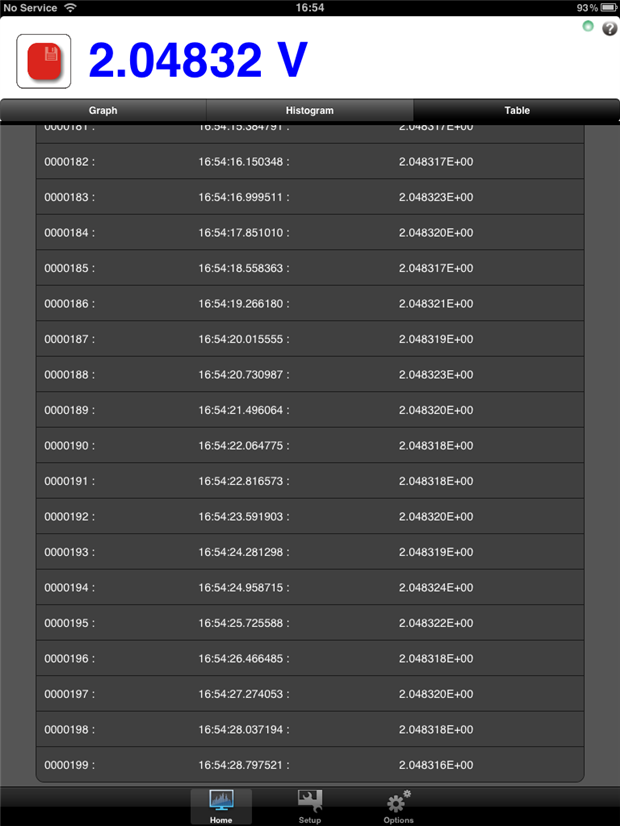
which is fairly logical, and the histogram,
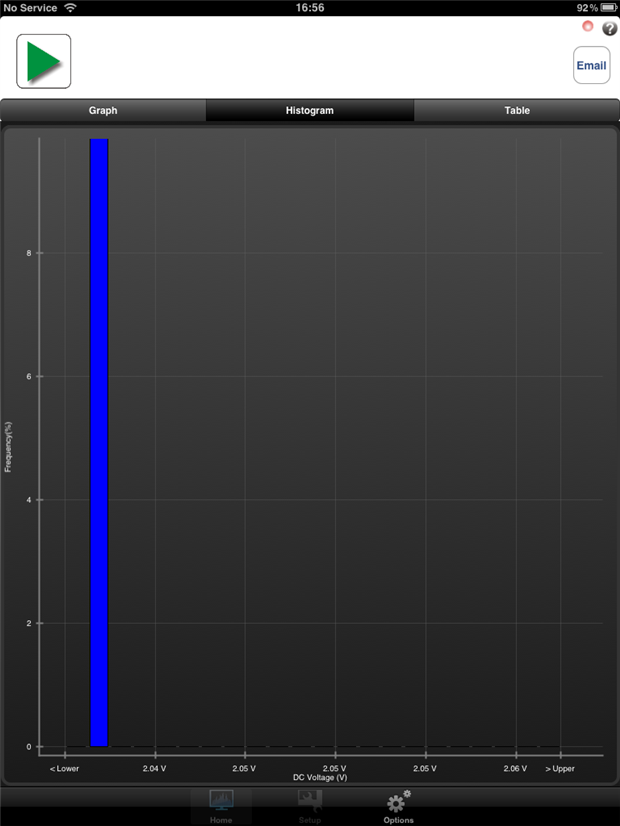
Whilst the graph and table views work as expected, the histogram does not. In the image above, the data is the same as the table, but the only bar shown was below 2.04 V, which is incorrect. I do have an additional gripe with the histogram and that is the frequency axis can be panned so that it shows negative frequency.
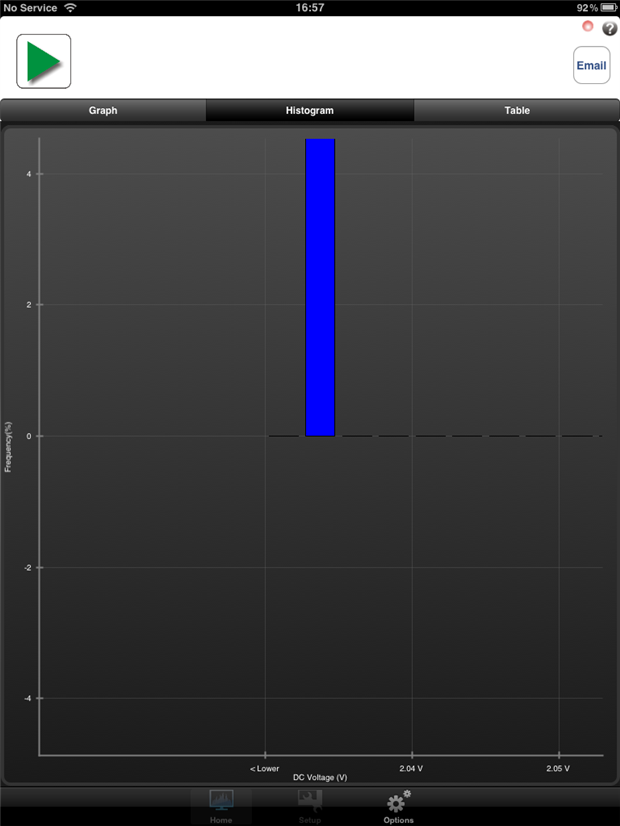
Which is confusing, to say the least.
Overall, I would describe the application as being semi-functional. This is due to it working and showing graphs, admittedly in the same unflattering colour scheme as the Windows software. However, the issues with the histogram not displaying the data correctly is worrying and makes me wonder how reliable the application is on the whole - after all you don’t want to be wasting time due to your multimeter being wrong. From my use of the application, ignoring the memory issues and crashes, it appeared to be like a toy - fun to play with, but with little practical use - and I do wonder who will use it, other than to show off that their multimeter has an iPad application.
-

DAB
-
Cancel
-
Vote Up
0
Vote Down
-
-
Sign in to reply
-
More
-
Cancel
-

6thimage
in reply to DAB
-
Cancel
-
Vote Up
0
Vote Down
-
-
Sign in to reply
-
More
-
Cancel
Comment-

6thimage
in reply to DAB
-
Cancel
-
Vote Up
0
Vote Down
-
-
Sign in to reply
-
More
-
Cancel
Children