Hello everyone.
I welcome you to my blog post describing my experiment as part of Experimenting with Current Sense Amplifiers Design Challenge. Purpose of this experiment is showing possibility of measuring power consumption of Raspberry Pi by the same Raspberry Pi. Raspberry Pi is powered through micro-USB socket so I will measure current flowing through USB cable which powers it. In previous blog post #9 I shown technically very similar experiment but I measured current flowing to the different device.
In previous blog you have seen following setup. Red line highlights path of sensed current flow:

In experiment shown in this blog I just changed location a probe and connected it to the white USB cable powering Raspberry Pi. So, I will sense current in the white cable instead of black cable as highlighted using red line:

After reconnecting the circuit looks as follows:

It works, but…
After I powered up the device, I faced an issue. Red power led was turning off and on at random intervals. After some investigation I found that red LED is not directly connected to the power voltage, but rather it is driven by PGOOD (power good) pin of voltage regulator. Regulator turns this LED off when voltage drops below some threshold. So, after I connected my debug probe to the circuit, there is lover voltage on the USB port of Raspberry Pi. This technically happens always because Current Sense Amplifier connect serial resistor and some voltage drops on this resistor, but because of low value of resistor (0.010 ohms in case of Current 6 Click Board) this drop should be very low and should not have cause any significant drop making power regulator unstable. In fact, Raspberry Pi was working even voltage was below required threshold, including running stress command utilizing all 4 cores but I was still interested in it.
Real vs Ideal wire
After some investigation I found that voltage drop is not caused by my debug probe (purple PCB), but it is caused by wires interconnecting my debug probe with Current 6 Click Board. Ideal wires have resistance of 0 ohms, but real wires have some small non-zero resistance. I measured resistance between two points on debug as 1.2 ohms
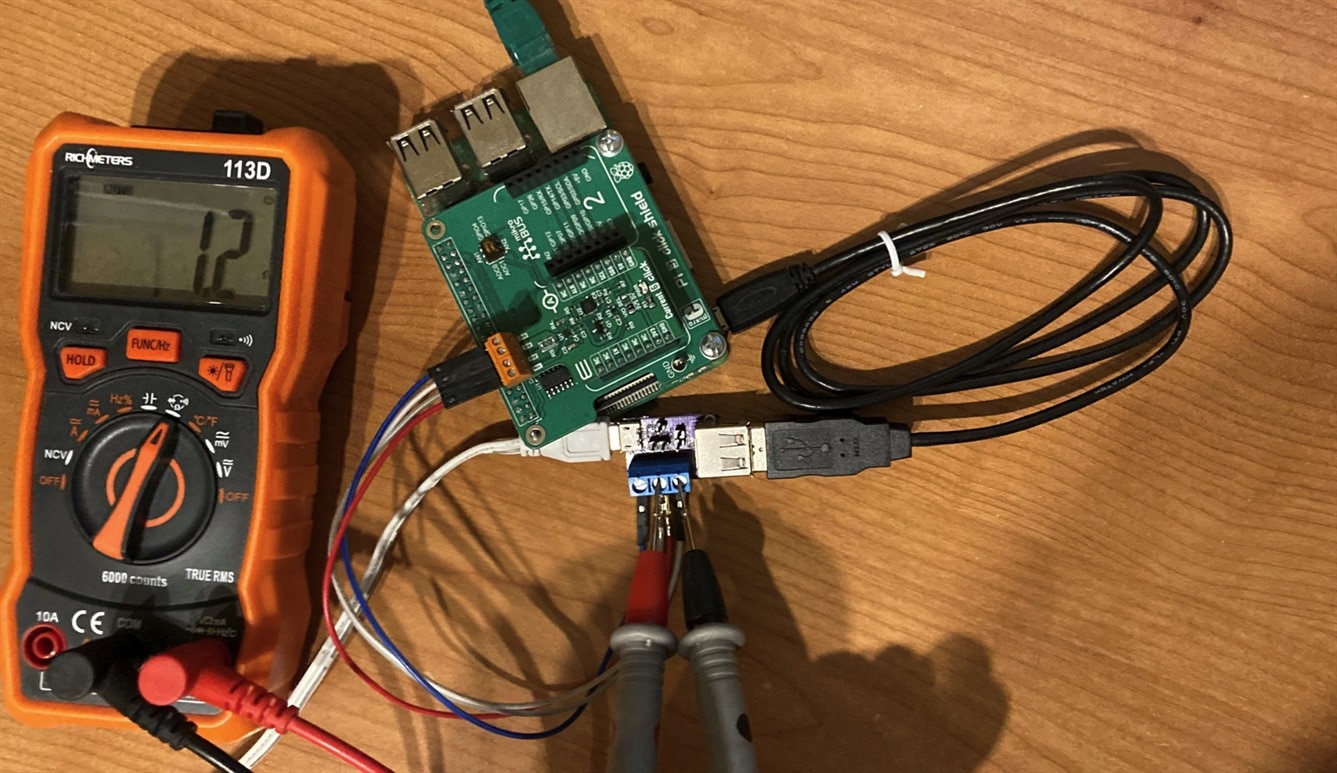
This resistance is sum of resistance of both wires connecting to the click board, resistance of PCB trace on Click board and resistance 0.010 ohms of shunt resistor. In case of ideal wires this resistance should be 0.010 (because wires are 0 ohms), but 1.2 ohms is 120× more.
For test I measured terminals on click board and while it should be 0.01 it is reported as 0.1 ohms because resolution of my multimeter is 0.1 ohms:
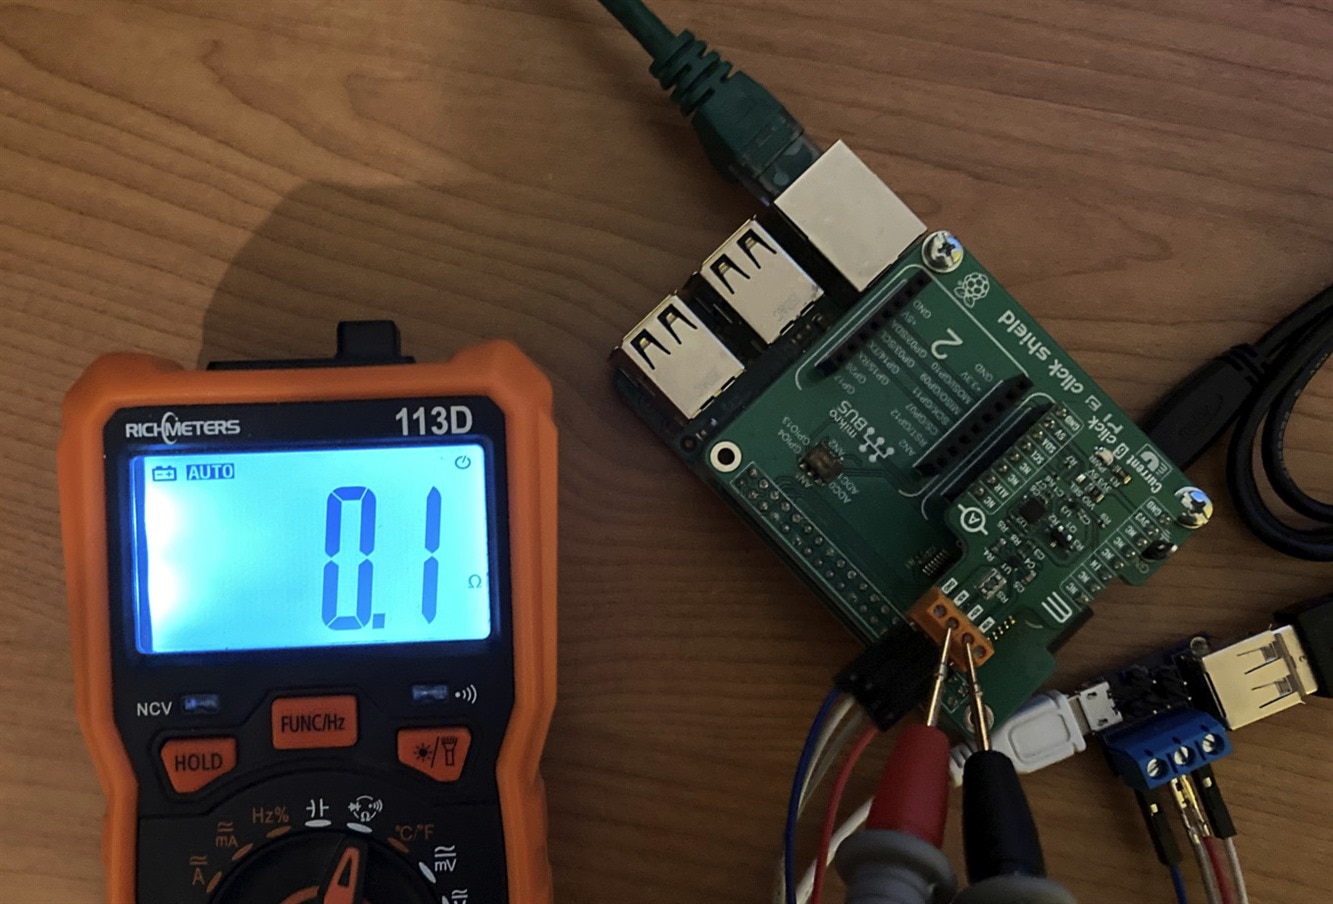
Then I tried to measure every wire separately to check if both or only one of them cause issue. First one is measured as 0.7 ohms:

Second as 0.5:
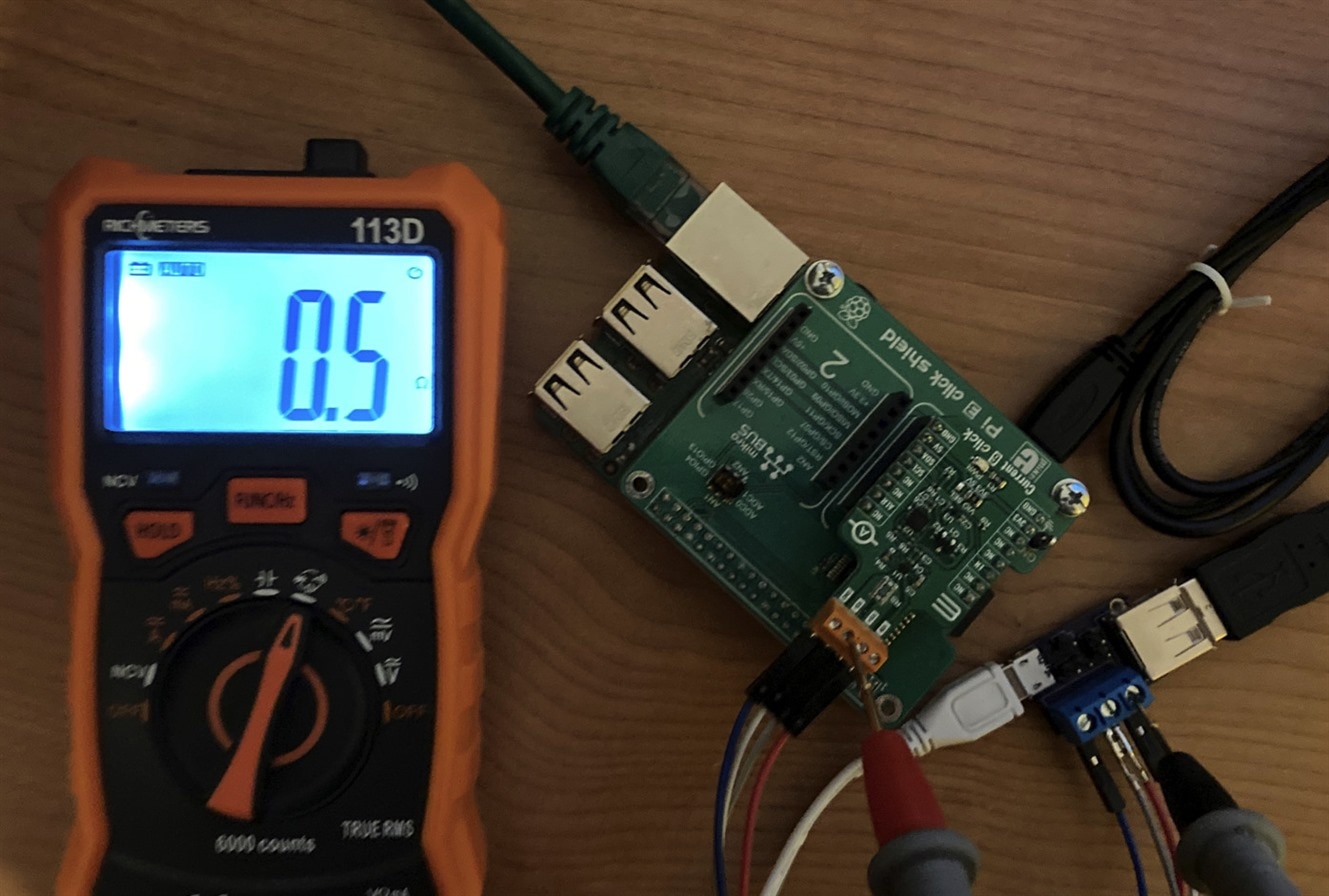
Note that sum 0.5 + 0.010 + 0.7 = 1.21 is exactly what I measured in first measurement (1.2 ohms). So, I was thinking what to do with that. I never faced issue with wires before. I definitely needed wires with lower resistance. After searching in my toolbox I find some wires which was bundled in PSoC 62 Pioneer Kit which I roadtested 1,5 years ago. Package contained 6 wires, but I have never used them yet. They are marked as AWG 22. So, I replaced Chinese duponts with these AWG 22 wires …
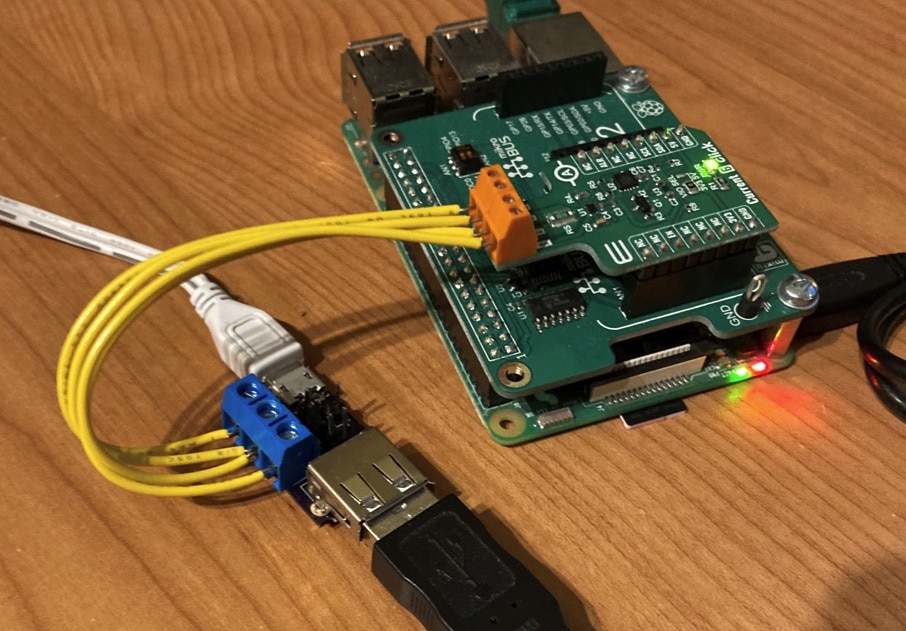
… and problem disappeared.
I of course tried measure resistance of connection after wire “upgrade” and now whole connection is reported as 0.1 ohms:
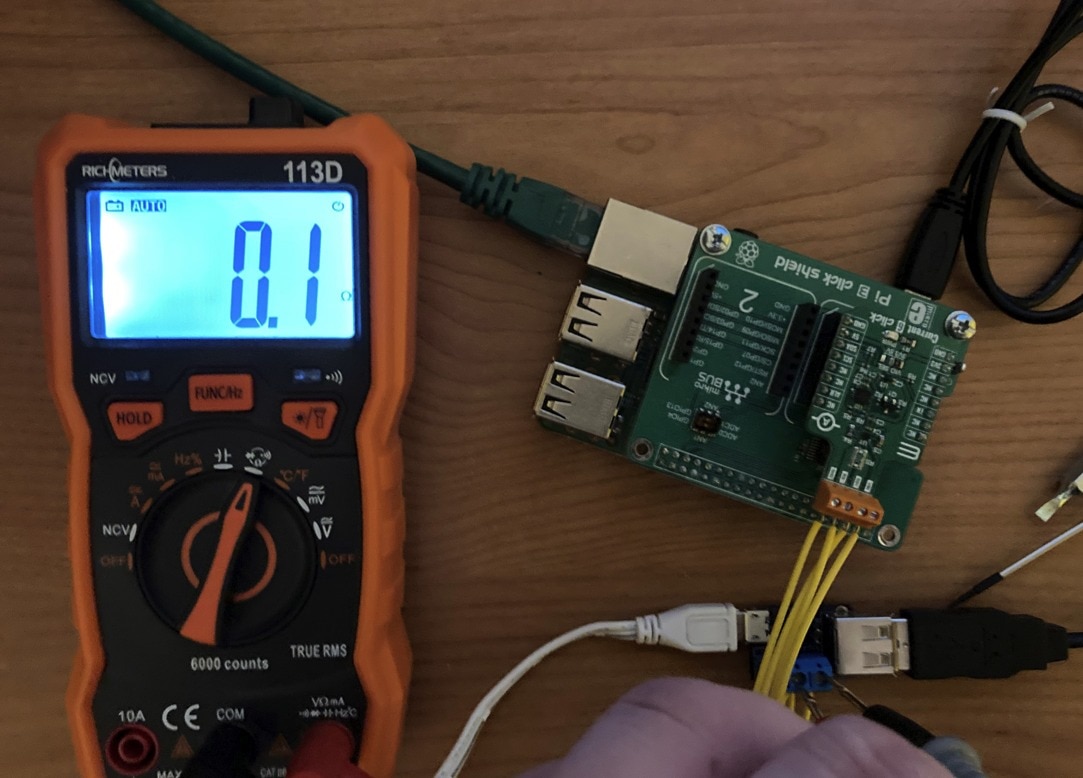
After I get reliable connection, I started with experiment.
Collecting power consumption samples at various tasks
For collecting data I used script very similar to script which I shown in previous blog post #9 in video. In this case I replaced commands reading and writing data to/from flash drives by different commands used for loading Raspberry Pi CPU somehow. In this experiment I used different configuration of MAX40080 CSA. Differences in configuration are following:
- Sensor is configured for collecting both current and voltage. In previous experiment I collected only currents. In this experiment I also collect voltages for being able to monitor possible voltage drops of power supply at load.
- Sample rate is reduced from 468.5 ksps to 0.5 ksps. This is quite sad downgrade. When collecting both current and voltage datasheet of MAX40080 mention that only allowed sample rate is 0.5 ksps. When configured using this sample rate sensor work in different mode and interleaves sampling current and voltage. I tried violating this rule and at sample rate 15 ksps I received samples which looks correct (but it is datasheet restriction violation! Who knows if they were really correct or affected by some noise, or received in wrong order or …). But at higher sample rates I was receiving total nonseses values so there definitely is some reason for this restriction. So, I bowed my head down and used sample rate of 0.5 ksps for compliance with datasheet.
- I disabled digital filter. I did it because sample rate is now very slow and digital filter reduces it even more.
- Input range is set to 50 mV allowing sensing currents up to 5A. By default, sensor is configured with input range 10 mV allowing measuring currents up to 1A but I expect that Raspberry Pi power consumption can beat this boundary.
Otherwise, differences in scripts are minimal. From some point of view, it is almost the same experiment as in previous case. I measured current consumption in following situations:
- When running apt update command.
- When running stress command on single core
- When running stress command on two cores
- When running stress command on three cores
- When running stress command on all four cores
I tried also change peripherals connected to the device and look how they change behaviour of power consumption: I tried:
- Run experiment with and without connected HDMI monitor to see if GPU core of processor causes some significant power consumption.
- Run experiment with and without connected external 2.5” harddrive to the USB port.
So, I did 4 experiments and every experiment collected data in five situations resulting to total of 20 power consumption traces.
Results
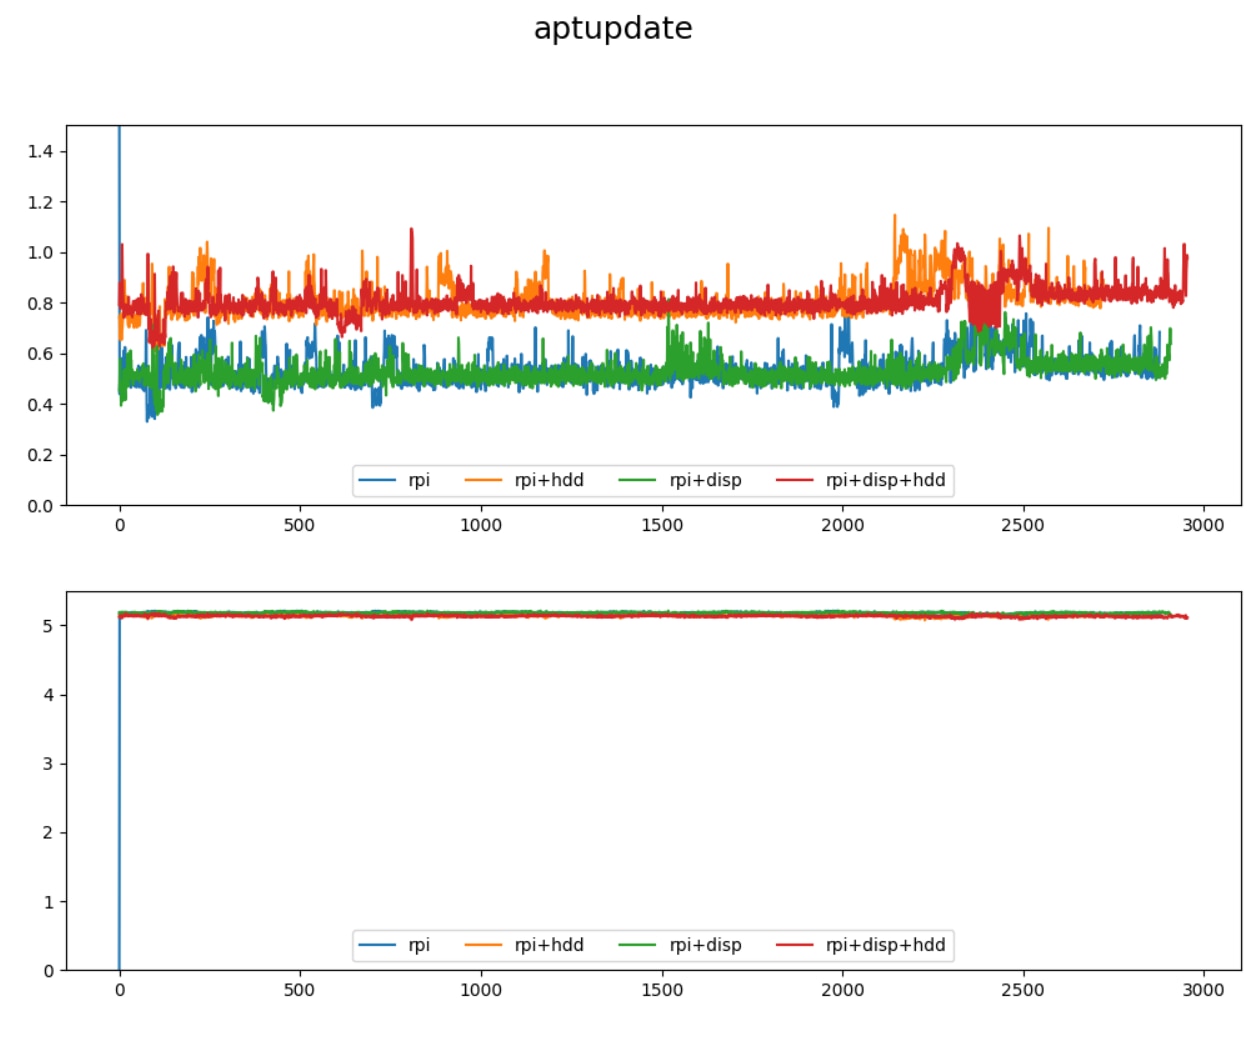
I plotted data to the one chart per experiment and separated I and U channels. When I run apt update power consumptions was following:
Similarly, when I run stress command on all four cores, it looked as follows:
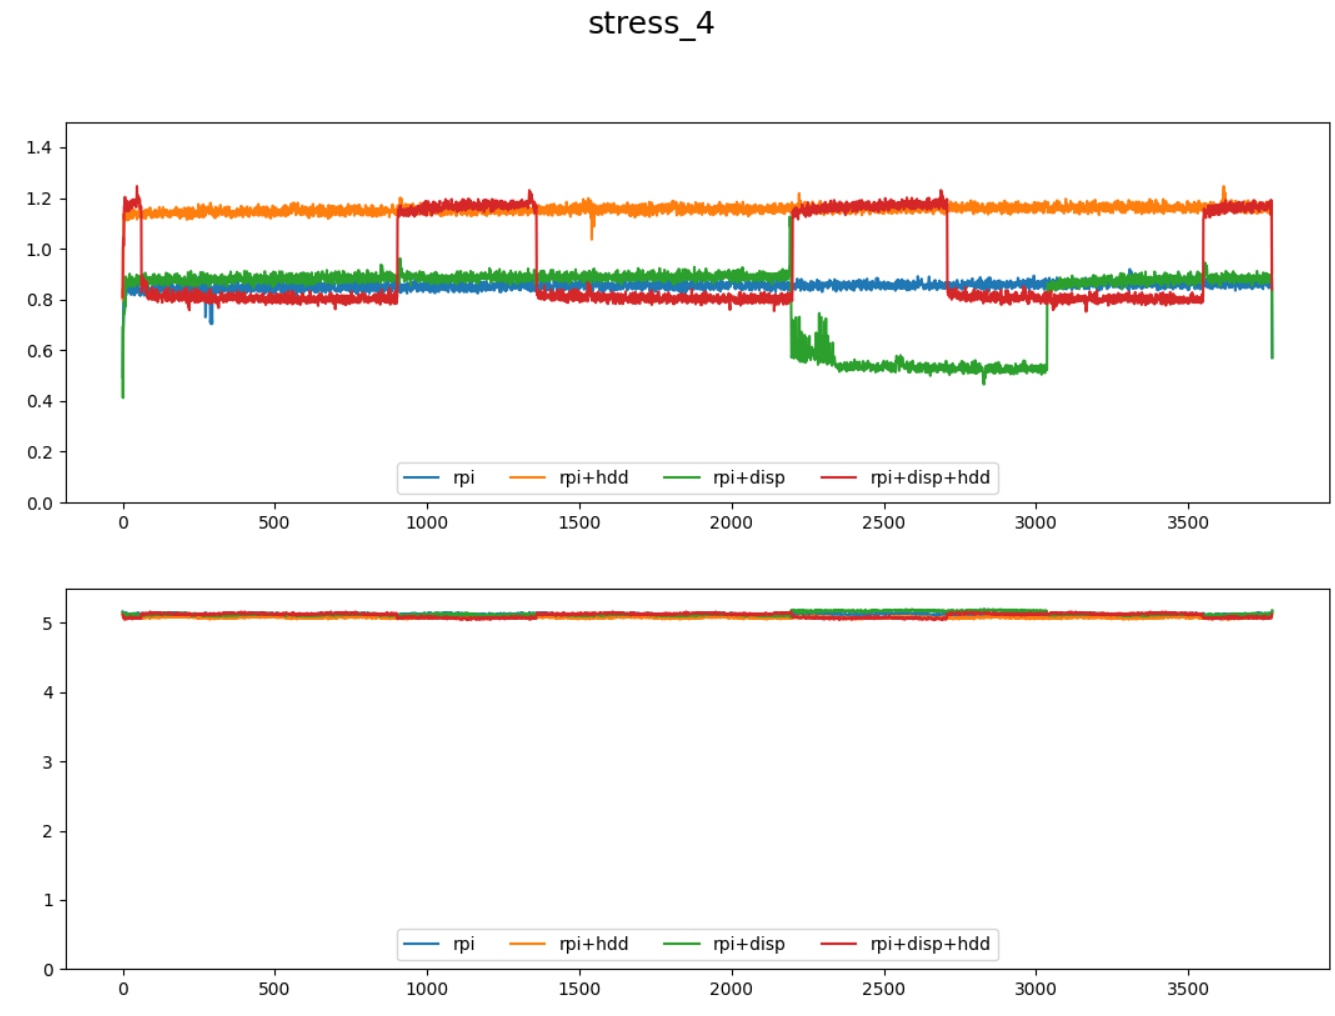
As you can see, my estimation that power consumption will grow over 1A was correct. We can see current of about 1.2A at plots. Another interesting thing which we can see is that voltage provided by power supply is rock stable and never drop significantly. I zoomed to the data of U channel of stress at all 4 cores:

We can see that voltage only few times dropped below 5.05V and never dropped below 5V. In case of running apt update (apt update is highly blocking operation because of using network connectivity) we can see that idle voltage was about 5.175V, so at load power supply dropped about 100mV.
The significant drops and growths looking like some digital signals at the first look are caused by underclocking. I am not sure if it was caused by overtemperature or undervoltage, but these are conditions which generally can cause Raspberry Pi to underclock. Power consumption (and performance) reduced about 350 mA when underclock happened.
As a next step I plotted data from one setup (rpi+disp) and plotted power consumptions of every command in one chart. First, I will show without apt update. Plots looks as follows:

As you can see current consumption increase linearly with increasing number of loaded cores (about 150 mA per stressed core). At stress on all cores, we can see better behaviour when underclocking occurred. It was green line on previous stress_4 charts shown above and part of it was covered, so now this behaviour is clearer. It started by high peak which increased power consumption significantly for short period of time and this caused voltage drop and underclocking behaviour. Peak is quite interesting, and I have no idea what cause 300 mA peak at the middle of stress command computations.
Similarly, I run command based on data from different setup (rpi + disp + hdd):
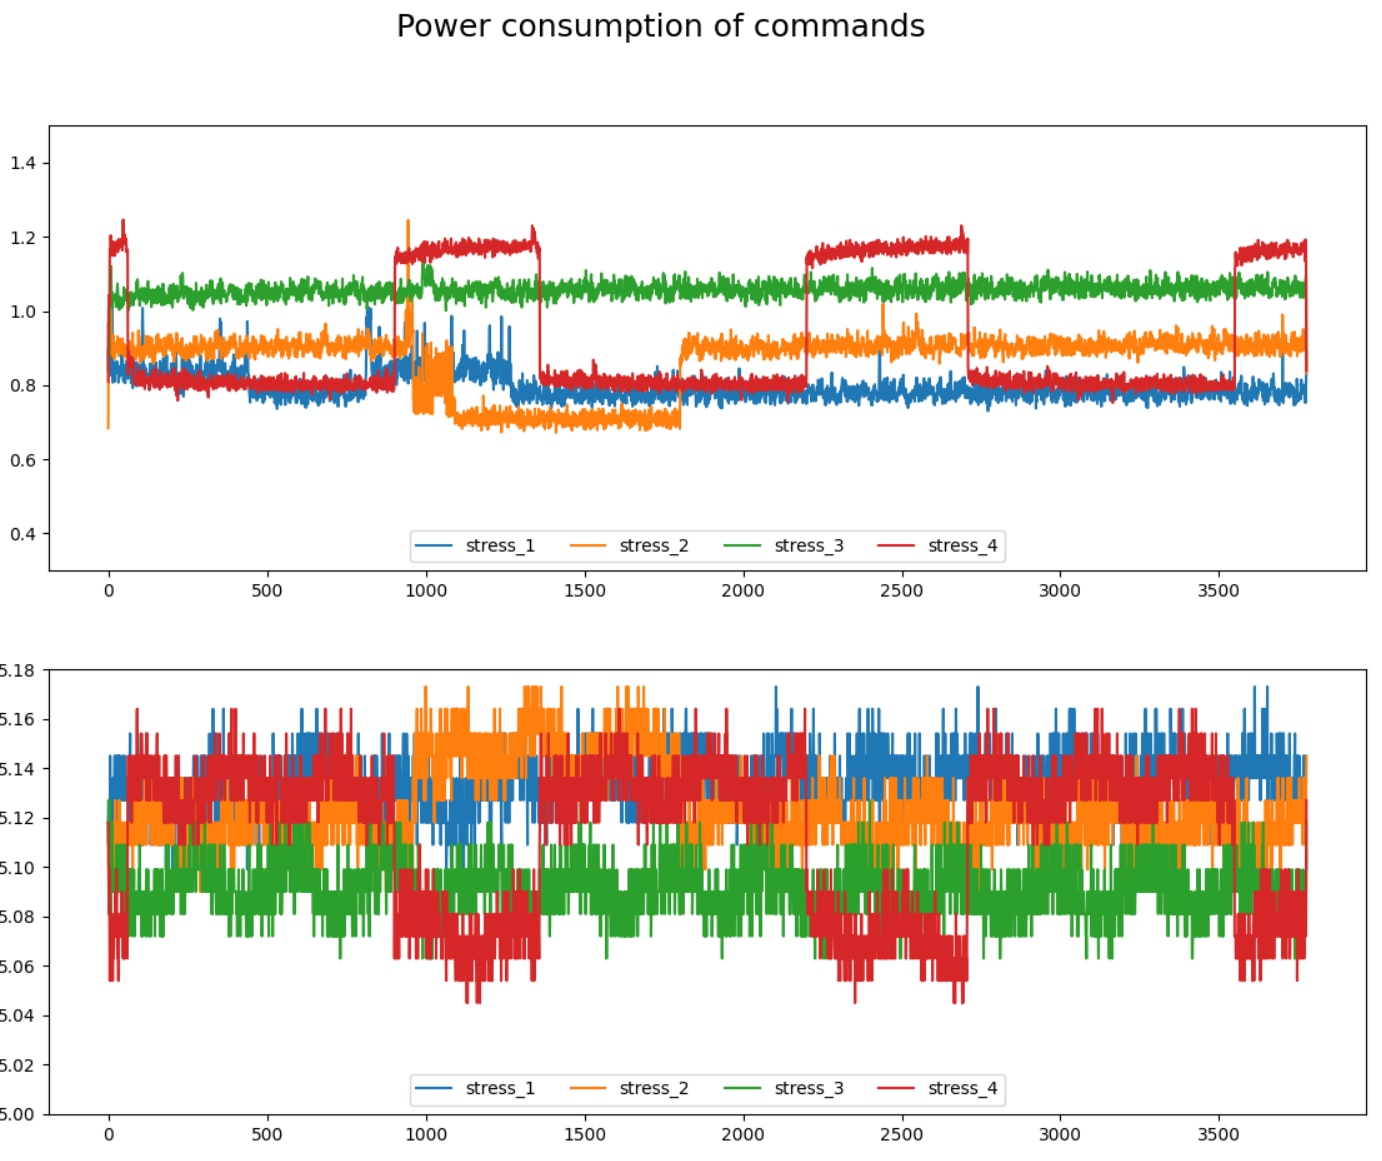
Attaching USB HDD increased power consumption by some constant, but this resulted to more frequent underclocking. This I consider as an interesting outcome – connecting USB peripherals can cause underclocking even it does not significantly load CPU cores in any way. Similarly like in previous case, I am not sure if underclocking was caused by undervoltage or overtemperature detection. Raspberry Pi 3B used in experiment generally do not produce so much heat, but in opposition board has reduced airflow because it is covered by Pi Click Shield.
Finally, I visualized the same data with apt update command included:

Apt update power consumption depends on phase. At the beginning apt update analyse local files and parse indexes. This is CPU extensive work, and we cans see peaks in this phase. Peaks are beating level similar to stressing two cores. Then it starts download files and power consumption peaks completely disappear (Networking operations are blocking operation and they do not load CPU much). Lastly after downloading files, it starts extracting and processing them which cause higher peaks to the similar levels of running stress at 3 cores. Power trace is shorter because apt update terminated sooner than stress commands which each run for 15 seconds.
Resources
If you are interested in reproducing this experiment yourself, you can download all resources using links below:
- MAX40080 CLI Utility (Github)
- USB Power Consumption Probe Board Schematics (PDF)
- USB Power Consumption Probe Board Gerbers (ZIP)
- USB Power Consumption Probe Board Kicad project (ZIP)
- USB Power Consumption Probe Board OSHPark direct link: (3 pcs cost 3.10$ and free international shipping as of 2022-05-31)
- sh script (SH)
- Plot scripts (ZIP)
- Collected data (ZIP)
Summary
In this blog post I shown second experiment which I promised in first blog post. In the next blog post I will show my third promised experiment/project. I will upgrade this measurement of USB devices to measure USB devices connected over USB Type-C connector which supports power delivery for negotiating voltage and maximum allowed current. In next experiment I leave Raspberry Pi and I will use MAX40080 CSA with microcontroller instead. Time is running out. Contest is ending in three days, but luckily, I have most of work already done and at this time I only writing texts, taking some photos and so on.
Thank you for reading this blog post and stay tuned to my last blogs as part of this contest.


-

dang74
-
Cancel
-
Vote Up
0
Vote Down
-
-
Sign in to reply
-
More
-
Cancel
Comment-

dang74
-
Cancel
-
Vote Up
0
Vote Down
-
-
Sign in to reply
-
More
-
Cancel
Children