I welcome you to my 9th blog as part of Experimenting with Current Sense Amplifiers Design Challenge. In my first blog post #1 I described my experiment plans as part of this contest. In blogs #2, #3 and #4 I shown basic usage of MAX40080 Current Sense Amplifier sensor. Then in blog posts #5, #6 and #7 I introduced my libraries which I created as part contest for simplifying usage of MAX40080 CSA sensor. Finally in previous blog post #8 I introduced my CLI utility which I will use as part of experiment described in this blog post. In this and next blog post I show my experiment with monitoring current consumption of USB devices. Both blog posts will show similar setup but with different purposes. In this blog post I will show measuring power consumption of flash drive connected to Raspberry Pi and in next blog post I will show self-monitoring of current consumption (Raspberry Pi will monitor his own power consumption).
For measuring power consumption of USB device, you need to connect CSA or amperemeter somewhere between USB port and USB device. So, at beginning you are in following simple situation. You have Raspberry Pi, and you have Flash drive:

This is standard approach of connecting flash drive to the Raspberry Pi (or PC) but for measuring power consumption it is quite impractical. So instead of direct connection we can use extension cable:

This connection is better because we have cable which we can modify for attaching CSA (or amperemeter). We can remove isolation in the middle of cable, cut VBUS wire and connect CSA here, but this approach destroys the cable, so I designed a better way. I designed my own PCB which have two USB connectors (left and right) and directly connects data and GND wires but splits the VBUS line. Splitted VBUS line allow me to connect CSA here. Schematic of this board is shown on following diagram.
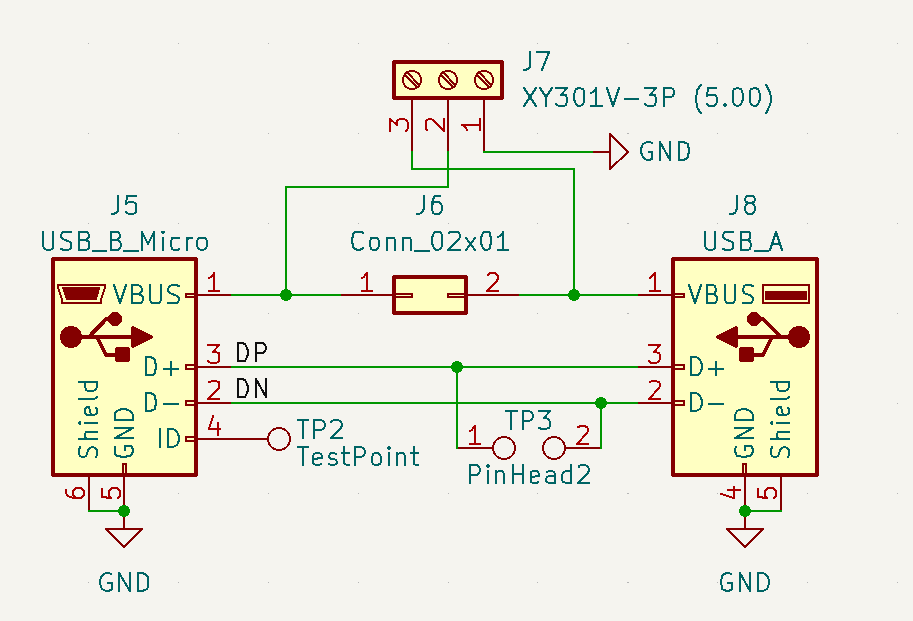
You can see two USB connectors. They are different type. One of them is USB A (which is standard USB 2.0 socket) and second is micro B. Data wires are directly connected and I added test points on some signals for possible future use. VBUS line is connected to jumper which can be used for directly connecting VBUS wires of left and right connector when CSA is not attached. And finally, there is terminal block for connecting CSA.
After placing components to the bord, it looked as follows:

I ordered this board as OSH park. Because it is very small, it cost only $3.10 (for 3 pieces). After about month I received it and it is shown on following photo:
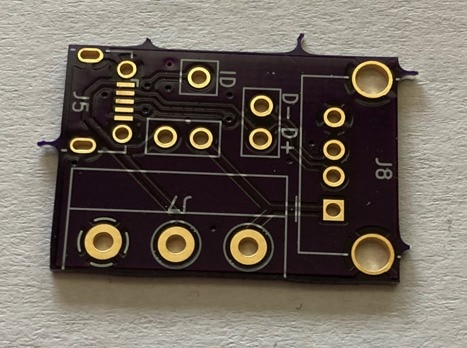
Finally, after assembling components onto it, it looks as follows:
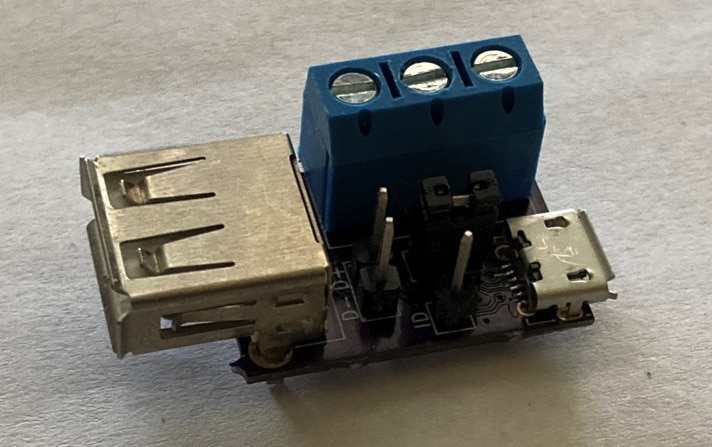
So now I can place this board to the setup and connect CSA to the circuit. Note that I need to change USB cable.

Connection is complete. Let’s experiment!
Measuring flash drive power consumption
I will show experiment on video which replaces about 1000 words
https://www.youtube.com/watch?v=o3_bO_oeTh0
Results
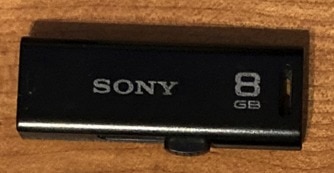
At the video you have seen results visualized on the following image. We can see that Sony flash drive used as part of experiment consume about 73 milliamperes when it is idle and regularly do some tasks which make 4 mA power consumption peaks at regular interval. When reading the flash driver current consumption double to about 150 mA and oscillates. In plots we can see pattern created by blinking LED. When writing data to the flash drive it behaves completely differently and two patters are repeated. I guess that one part is erase and second part is writing data to the previously erased flash cells.

I tried experiment with few other flash drives, so let’s see differences.
ADATA USB 3.0 32GB Flash Drive
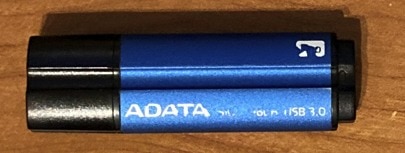
I run the same script against flash disk on the image above. While it is designed as USB 3.0, my board, cable, and Raspberry Pi 3B are limited to USB 2.0 only. The power consumption of this flash disk look as follows:

When this USB flash is idle, it is significantly more efficient. In idle state it consumes only 38 mA in comparison with SONY flash drive which consumed 73 mA. Similarly, it consumes less energy when reading and writing data. Note that while it consumes less current it is still faster. This flash drive has no LED so patterns disappeared. Interestingly we can’t see any pattern when writing data. It looks like driver works in completely different way. We can see that when writing data, power consumption oscillated between idle state (38 mA) and about 125 mA. It is most probably because flash drive is designed as USB 3.0 and we are using only USB 2.0 bus, so experiment can’t saturate the flash drive performance capacity completely.
Non-branded flash drive received from marketing campaign
As a next model I chosen this non-branded flash drive, which I received for free somewhere (most probably when I was registering my website domain first time, but it is not important now). It is USB 2.0 only and its capacity is 16 GB.
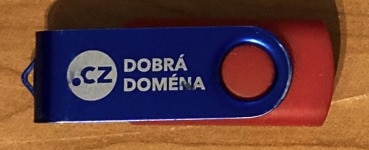
Results was following:
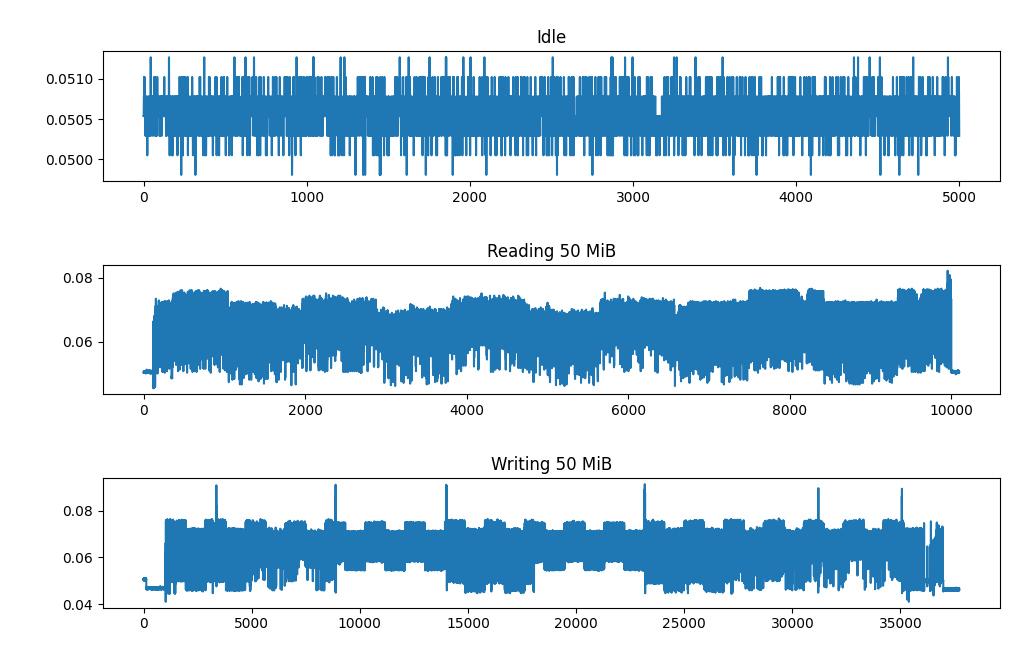
This flash drive has LED so there some patterns appeared again. Otherwise, behaviour looks similar to previous one. Idle consumption is slightly higher (50mA), reading consumption is similar but this flash drive is more efficient when writing data. When writing power consumption is about 80mA excepts short peaks in comparison with 120 mA power consumption of previous model. But note that this model is slower.
SanDisk 8GB
At last, I applied the same procedure to SanDisk flash drive visualized at following photo. Its capacity is 8 GB and supported interface is only USB 2.0.
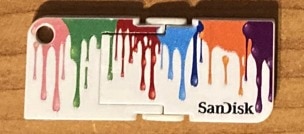
Results are following:

This is the most efficient USB flash drive which I have tested. At idle consumes only 28 mA. When reading power consumption is 60 mA and 80 mA when writing. Flash drive is the slowest one in case of write operation and interestingly it alternates between idle power consumption and 80 mA power consumption. It looks like flash drive interleaves write operation with time slots when it efficiently does nothing. Similarly at middle of the transfer it started to do something completely different and power consumption changed behaviour for the while.
Resources
If you are interested in trying this experiment yourself, you can download all resources which I have used in experiment, you can freely use download links below. I also attached collected data, so you can run visualization script yourself and freely zoom into the data or do other types of analysis. You can download schematics, gerbers and folder containing Kicad project of PCB used in experiment. There is also link to OSHPark where you order board easily. You can also download source codes of shell script and python script for plotting data. Finally, there are links to Gtihub page of MAX40080 utility which I described in detail in previous blog post #8.
- MAX40080 CLI Utility (Github)
- Schematics (PDF)
- Gerbers (ZIP)
- Kicad project (ZIP)
- OSHPark direct link: (3 pcs cost 3.10$ and free international shipping as of 2022-05-31)
- collect_data.sh script (SH)
- plot.py script (PY)
- Collected data (ZIP)
Last words
Thank you for reading this blog post and watching video. In the next blog post I will shown my experiment promised in first blog – self monitoring power consumption of Raspberry Pi. Experiment will be very similar to this experiment, but connection will be slightly different and power consumption will behave differently. At the time of writing this blog post one weak remains before contest deadline. I completed all my experiments promised in first blog (and little bit more), but I need to write related blog posts which is quite time consuming. Similarly recording video took me a lot of time.
Thank you for your attention and stay tuned to my next blog posts about my experiments. Thank you very much.
Next blog: Blog #10: Raspberry Pi Self Power Consumption Measurement

