


Experiment 3 (Fourier Transform Analysis to find RPM)
Please read my other blog posts too if you haven't
Experimenting with Vibration Sensors - zst123's Blog Posts
Objective
This experiment is aimed for advanced users as it includes the use of Fast Fourier Transform (FFT).
Today this will be a very long post as we shall collect many test results from different spinning devices!
I will apply FFT to extract the frequencies presented to the vibration sensor.
From the results, I will do detailed analysis and give my advice on how to reproduce it.
We shall determine if my hypothesis is correct – Can we characterize the RPM speed of spinning devices by observing its pattern of vibration?
Setup
Most of the setup has been done in Experiment 1 and 2. Please follow my instructions there on my setup before continuing.
- Experiment 1 Experimenting with Vibration Sensors - Characterize RPM of Spinning Devices #3 (Initial Setup & Tapping Experiment)
- Experiment 2 Experimenting with Vibration Sensors - Characterize RPM of Spinning Devices #4 (Detect Spinning Fan Obstructions)
In PyQt graph library, the FFT algorithm is packaged together and can easily be enabled.
Connect the board and start up the plotter as per normal

Right click on the plot to enable FFT. Now we can do a real time analysis of the frequencies.

Optionally, you may enable log scales. But I chose to leave it unchecked.
| {gallery:width=600,height=500} Linear vs Log Graph |
|---|
Linear Graph: This is an FFT plot with linear scale showing a 90 Hz signal |
Log Graph: This is the same 90 Hz signal but shown on a log scale |

Log scales may be better for higher frequencies. But in my experiment, the measurements around my home are probably a maximum of 200 Hz, so a log scale may not be useful.
FFT and Sampling Rate
In my previous comments I was asked about the sampling frequency. And from this, I felt it is important to talk about it before we do FFT.
I modified the code in my plotter Python program to calculate the frequency for me in real time. I added this line inside the callback which receives data from the serial port.
print("Frequency", (len(axis_time)-1) / (axis_time[-1]-axis_time[0]))

What this code does is it gets the number of samples and the time span from the first sample to the last sample in the array. The formula is Frequency = Number of Samples / Time.
Here when running the program I am getting a stable sampling frequency of up to 995 Hz.

Due to the Nyquist frequency, the maximum frequency that FFT can produce is half of the sampling frequency or 497 Hz.
This is a screenshot of the FFT plot in PyQt, here we can confirm that the FFT plot is just shy of 500 Hz.

There are ways to improve the sampling frequency, however, my current setup is sufficient for me and I decided to focus on getting some results before further experimenting on it.
Here are my ideas to improve sampling frequency:
- Right now using Mbed to program my microcontroller which is quite a heavy library. By coding at a lower level or using DMA, the speed can be improved.
- Sending the data through the serial port is very slow and is a bottleneck. A possibly faster way is to use USB or Ethernet communication on the board.
Test Results - Handheld Fan
Here's the same fan from last time. Note that this time, I taped down the sensor near the stem of the fan. This placement produces more obvious vibrations results compared to the center.

I noticed that placing the sensor off-center, the vibrations will be more obvious compared to placing the sensor right in the center where the axis is spinning.
There are 3 speed settings and in the previous experiment, I had a video of me toggling between the 3 fan speeds. This is the same except now let us observe the FFT results.
Summary
From the FFT screen, 3 very clear peaks are observed for the 3 speeds. This is an colored overlay of the FFT diagrams.
The frequencies are roughly 40Hz, 44Hz and 49Hz.
Since frequency is the number of cycles per second, we can get the cycles per minute by multiplying it by 60 (aka. revolutions per minute RPM)
Fan setting | Frequency | Speed |
Low | 40 Hz | 2400 RPM |
Medium | 44 Hz | 2640 RPM |
High | 49 Hz | 2940 RPM |
Test Results - Hard Disk Drive (HDD)
Next, I tested using hard disks I have at home.
#1. WD Elements
I bought this a few years back and if I’m not wrong, it should be 5400rpm. Many small portable hard disks are 5400rpm. I have taken good care of it and it is still in good condition.


I simply mounted it down firmly using clear tape.

Here is a video of it starting up (when I connect to the PC) and stopping (when I ejected it)
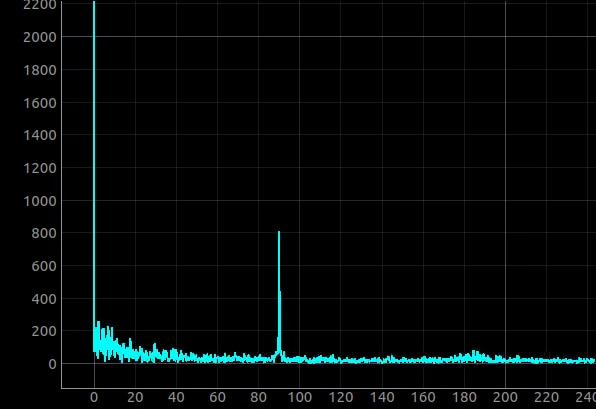
And true enough, one very clear peak is observed at 90Hz which equates to 5400rpm!
#2. Cutie Hard Disk Enclosure
This is actually an HDD taken from an old laptop and put into an enclosure. It is almost 20 years old and unreliable (data has been lost before!).


Here is a video of it starting up.

Strangely this time I observed that there is a peak at 70Hz which means the hard disk is spinning at 4200rpm.
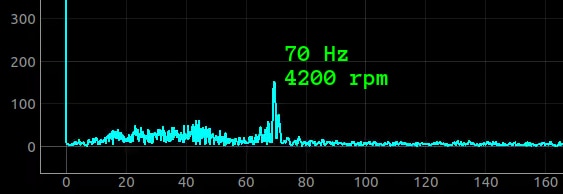
Unlike the previous HDD, there's a lot of frequency components around the 40Hz mark. The dominant 70Hz (4200rpm) frequency is also weak and not as defined.
These could be indicative of its unreliability and I can infer that the hard disk spindle might be weakened — This could have caused the data loss from last time.
I got curious if the 4200rpm result was true... So I unscrewed and opened up the enclosure.

Inside is a Toshiba HDD2158. I searched online and found a manual of the model. Indeed it confirms that it is 4200rpm!

I was quite amazed to see a hard disk with this odd RPM rating, a very interesting discovery!
#3. Desktop PC Hard Disk
For the sake of completeness, I wanted to collect results from a 7200rpm HDD too.
It was tough to find because most of my external hard disks are 5400rpm, and my laptops are all using SSD now.
But eventually I found a 7200rpm HDD after cracking open my desktop PC.

I attached it like this and turned on the PC.

This is a screenshot of the 120 Hz peak which corresponds to 7200rpm. Due to the rigid metallic body of the hard disk, the amplitude of the 120Hz is also very prominent.

It is interesting to note that there are also a few frequency components at 55 Hz and another one at 295 Hz.

Looking around, I found out that these frequencies are coming from the other fans (there is the cooler fan for the CPU and chassis)

Summary
We confirmed the RPM characteristics for these hard disks:
Hard Disk | Frequency | Speed |
WD Elements Portable | 90 Hz | 5400 RPM |
Cutie Enclosure (Toshiba HDD2158) | 70 Hz | 4200 RPM |
Samsung HD160JJ | 120 Hz | 7200 RPM |
I had these observations:
1. Vibrations can be coupled from within the chassis of a desktop PC. Be careful when making measurements near other vibrating sources!
2. An unreliable/failing hard disk may produce additional frequency components and show a weaker dominant frequency. This indicates problems with the spindle and uneven spinning characteristics.
Test Results - Laptop Internal Fan
Now I want to experiment with my laptop fan.
I am using this Macbook Pro 2017 and there are 2 fans inside (left and right).
| {gallery:width=500,height=400} Macbook Pro 2017 |
|---|
Macbook Pro 2017 Internal: Picture from https://www.igorkromin.net/fp-content/images/mac/cleaning/IMG_1724.jpg |
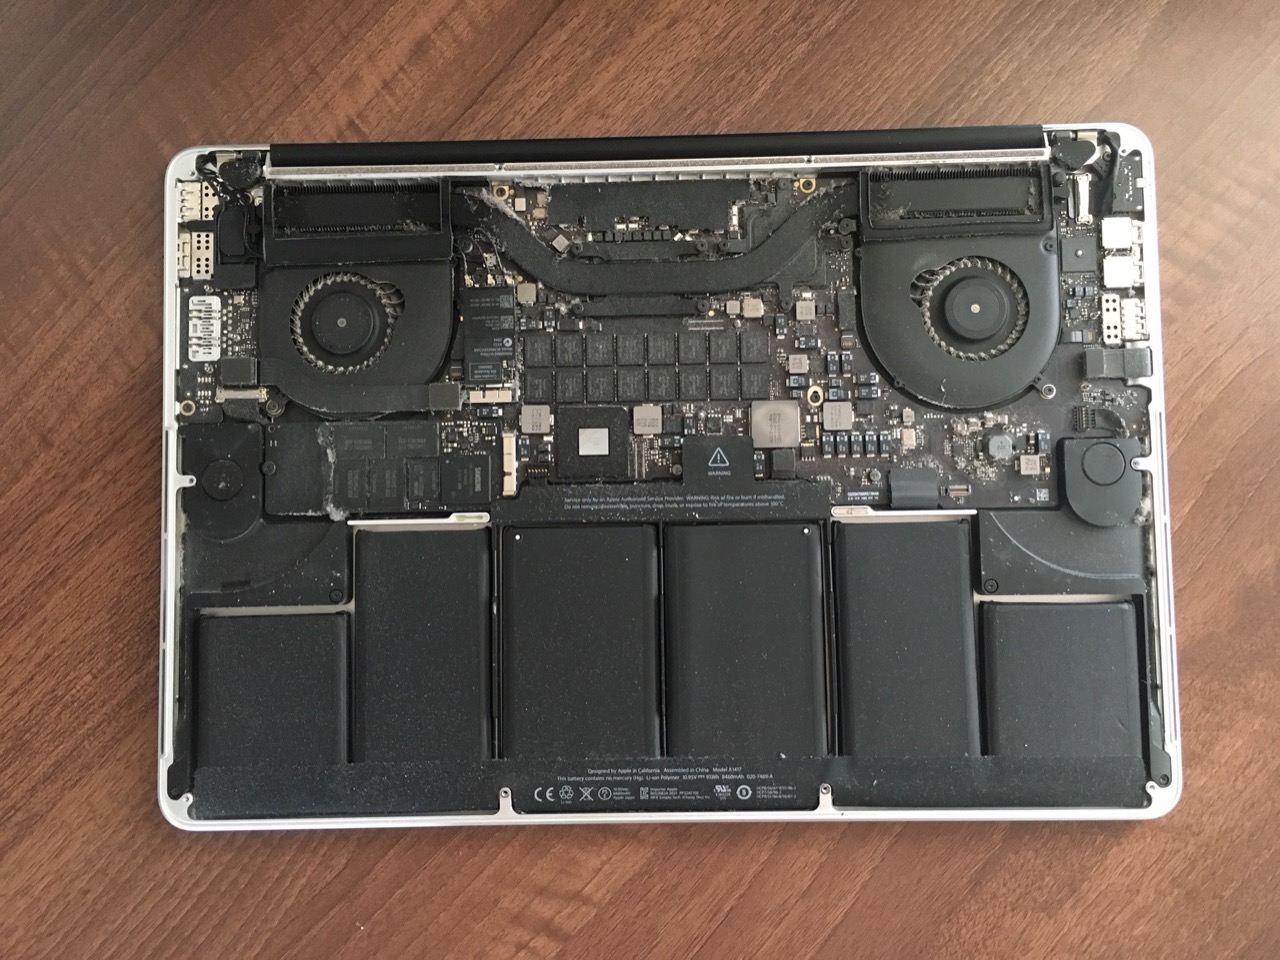
My initial plan was to attach the sensor to the middle of the laptop, and sense vibrations from both fans at the same time, however, I was not successful in receiving any vibrations at all. It is likely that the laptop was designed to dampen the vibrations and sound. After all, the Macbook’s fans are known to be quiet.
I decided to attach it to the left side of the laptop, directly under the left fan.

There is a software called "Mac Fan Control" to manually set a fan speed.
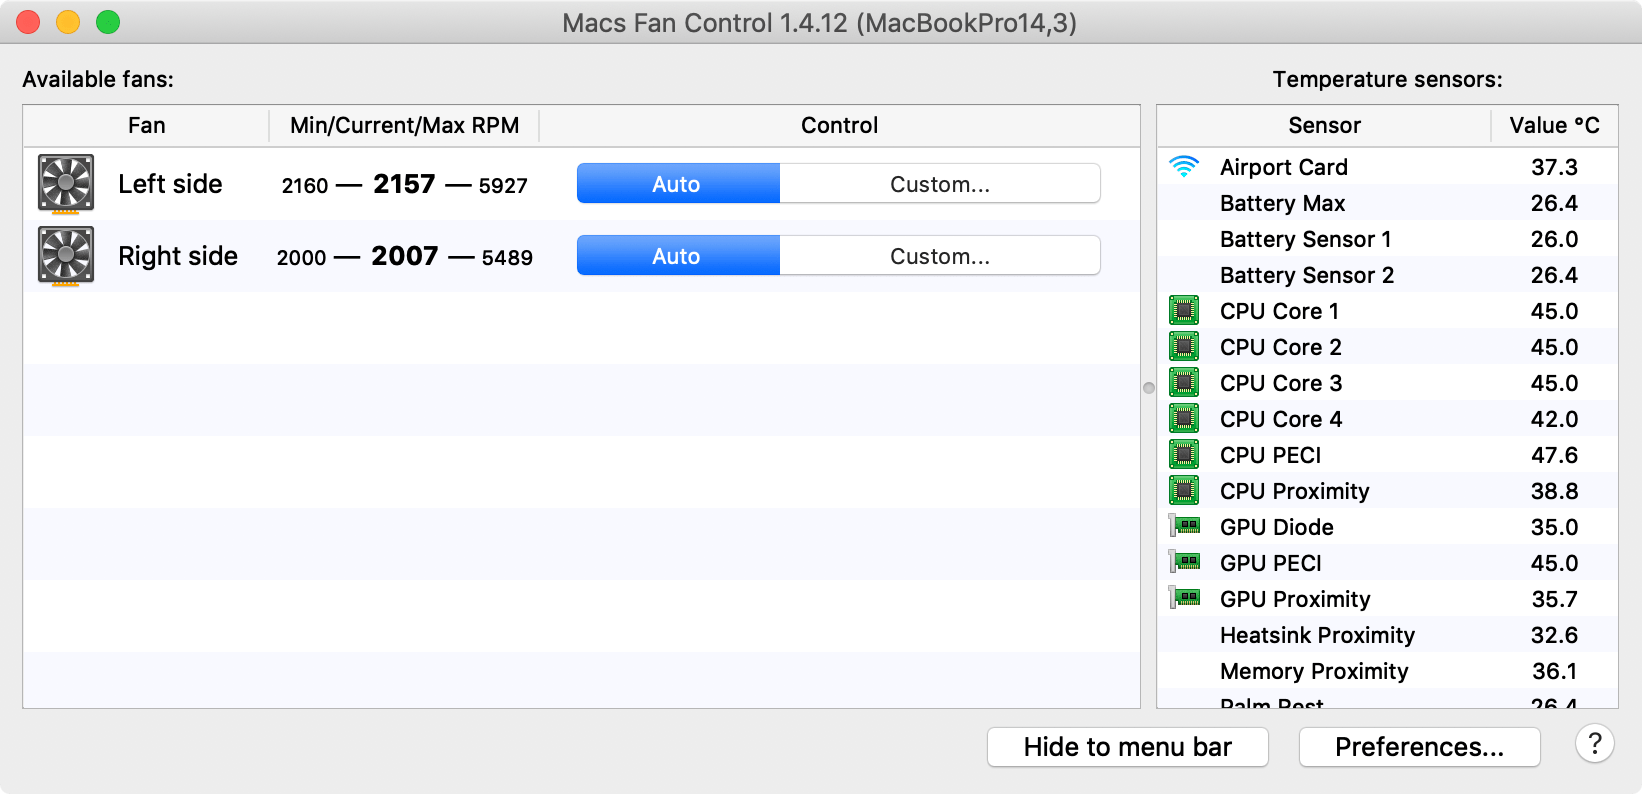
In this video, I set the fan speed to different random RPMs and from the FFT plot of the vibration sensor, it is very accurate in measuring the frequency.
Summary
This is an overview of all the plots.

(Notice that the 21 Hz result has a significantly smaller amplitude. I mentioned in my earlier posts that the sensor is rated to detect vibrations above 30 Hz.
Be very careful when dealing with vibrations of low frequencies! Here we indeed see some attenuation at frequencies lower than 30 Hz.)
This is the sensitivity plot taken from the datasheet:

Conclusion & Learning Points
From the results, it is clear that the patterns from FFT results can be used to easily derive the RPM of spinning devices and characterize how it spins.
My experiment hypothesis is successful and I'm glad to share these with you. Let's recap some points to learn...
Ideally only one frequency will show up for a smoothly spinning device. We can determine the RPM from this frequency. (Even at lower frequencies, it is possible to see results, but be aware of the attenuation below 30Hz.)
The Kemet/Tokin vibration sensors are very sensitive and there are many applications possible. For example, irregularities can be identified such as in unreliable, failing hard disks.

Special care must be taken when sensing vibrations within a system. For example when I was collecting data from the hard disk in my desktop computer, there were also other vibration sources in the chassis like the CPU cooler fans. These can interfere with the results and cause wrong interpretations of results.
What inspired my experiment?
This idea was inspired by the incident where WD hard disks were advertised as 5400rpm Class. The disks were proven to actually be spinning at 7200rpm by doing a spectral analysis using a microphone.
Since the sounds coming from the hard disks are actually due to the vibrations of the spinning hard disk platter, I felt that a vibration sensor will work just as well, if not better.
I also decided to try out other spinning devices too in the process. This article explains in detail about the source of vibrations in hard disk (ie. from the platter and spindle)