Orbweaver Rover - Monitoring and Data Collection
Orb-weaver Rover - Concept <----- Previous blog
Table of Contents
1. Introduction
Hi! This will be my second blog for the Orb-weaver Rover project. In the last blog (that you can find linked above), I've covered the concept for my project, what I plan on doing, and how. To summarize quickly, my plan for this project is to make a rover platform that would "cast a net" of sensor boxes and by doing that, monitor a much larger area, hence the name orb-weaver for the rover.
In this blog, I will go over the core of this competition which is monitoring and data collection. This blog will be the backbone for this project since all of the communication will be going over LoRa. Since I will be covering the whole monitoring and data collection system, this will include:
• LoRa communication between Arduino-s
• Sensor Boxes - Design, Code, Testing
• GCS (Ground Control Station) - Design, Code, Testing
• GUI (Graphical User Interface) - Design, Code, Testing
• Working with the collected data
Before I begin with any of that, I received my starter kit so I would like to thank everyone involved for all of the components since they will be crucial for this project!

2. LoRa communication and first tests
To start off this blog, I'll cover the main thing which is the LoRa communication (Long Range). I had a bit of a frightening start with the Arduino MKR WAN-s due to LoRa starting fail messages. For the LoRa to work we first need to update the firmware on all of the Arduino boards. To update the firmware you need to:
- In the Arduino IDE find and install the MKRWAN library
- After installing the library, you need to load up the example from the library: MKRWANFWUpdate_standalone
- Upload the example to each Arduino, and once uploaded, open the serial monitor - this will start the firmware update
You will see in the serial window the progress of the firmware update, once it's done, the boards are ready for LoRa! To test and work with LoRa I suggest working with the LoRaSender and LoRaReceiver examples and modifying them to your needs, this is exactly what I did!
I gathered the sensors I will be using in the SensorBox (DHT22, BMP280, HL-83, and an RTC) put them all on a breadboard with one of the Arduinos, and using a USB power bank, I had my first Sensor Box prototype!
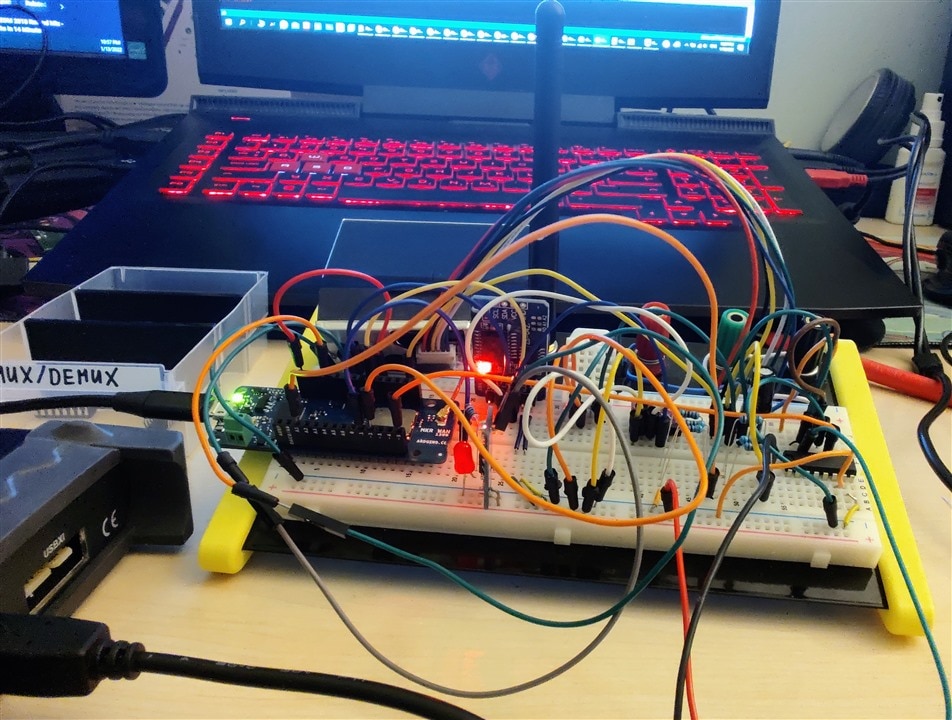
Besides the components I've mentioned above, I added a small red LED which would blink every time I tried sending a LoRa message. To conduct the experiment, I took the sensor box prototype and started walking from the house, while someone in the house was monitoring if the messages were received on that Arduino. That was easy to do since every message besides readings had a counter for the number of each message sent from the sensor box, so it was just a matter of looking if the message numbers were consecutive. The other Arduino was placed just outside the house on a 2m USB cable. With the setup sorted out, I started going through the yard and then through the neighborhood carrying the sensor box prototype.
Everything worked great! My idea with this test was to see what kind of range I could get with that setup. Looking at Google Maps once I got home, I determined that the max range at which I was able to send and receive messages was around 150m by air (but there were around 6 houses in the direct line of sight since it is a pretty tightly packed neighborhood). For the beginning, I was planning on conducting tests in my yard for the most part, so these were some awesome results!
3. Sensor Box
Since I've already touched upon the sensor boxes with the sensor box prototype test, might as well go through them first. In this blog, I will be covering making one of the boxes, but the other box will be identical to this one since I want to measure the same things in multiple locations. Let's first begin with the electronics.
Electronics
I'll begin with the list of components that will be in the sensor box:
- Arduino MKR WAN 1300
- Small Antenna and a small O ring for sealing the hole for the antenna
- 2 x AA holder and 2 AA batteries
- DHT22 - measuring temperature, humidity and calculating the heat index
- BMP280 - measuring air pressure
- QYF-919 - RTC module
- HL-83 - Rain sensor
- Hammond cable gland and an internet cable
- Cables, connectors, perfboard
- N channel MOSFET and some resistors
My initial idea was to have everything connected to power via the MOSFET so I can turn ON/OFF the sensors to save more battery life, but that didn't work out as planned so I had to abandon the idea for the most part since I'm running low on time. RTC and the BMP280 are connected to the Arduino using I2C, while the HL-83 sensor is just connected to an analog pin. DHT22 is connected to one of the digital pins. Another thing I'm measuring is the battery voltage with the built-in voltage divider on the Arduino.
Design
In the starter kit, we were provided with 2 Hammond Manufacturing electronics enclosures. My plan is to one of them utilize as the body of the rover, while I want to use the other one as the GCS. That leaves the question of what to use for the sensor boxes. To stay true to the theme and the competition I managed to find the perfect size Hammond enclosures in one of the electronics stores near me.
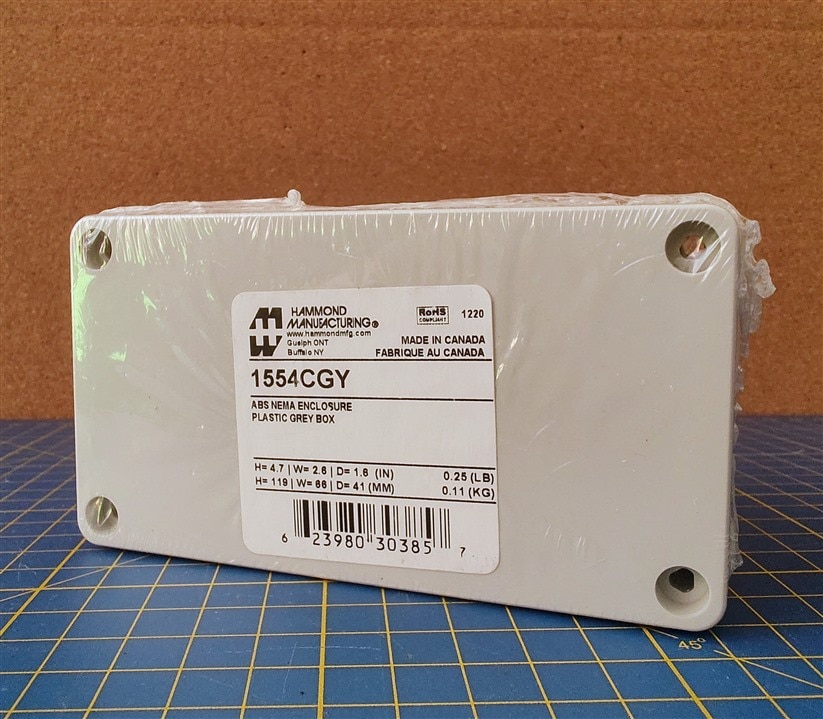

I would say that the enclosure is in the same category as the ones provided in the kit, rubber ring for stopping any water from getting in, metal threaded inserts for the screws, really thick plastic walls, so I think it would be safe to say it's up for the same tests and abuse as its bigger brothers!
Since the box will be outside in the cold/warm, rain (currently snow) outside, my main goal was to keep the enclosure waterproof, but then again, for the sensor box to perform its function it needs to have an antenna and sensors on the outside. To get to the sensors, I decided to go with one of the provided cable glands and use a standard ethernet cable, since it has a lot of conductors and the cable gland grabs it really nicely. As for the antenna, I had to improvise a bit, I drilled a smaller hole and got it bigger a bit by bit using hand tools until I could barely screw it into the plastic wall. As an additional measure, I also put a small O-ring around the antenna connector that was squished against the wall of the enclosure as I tightened it down.
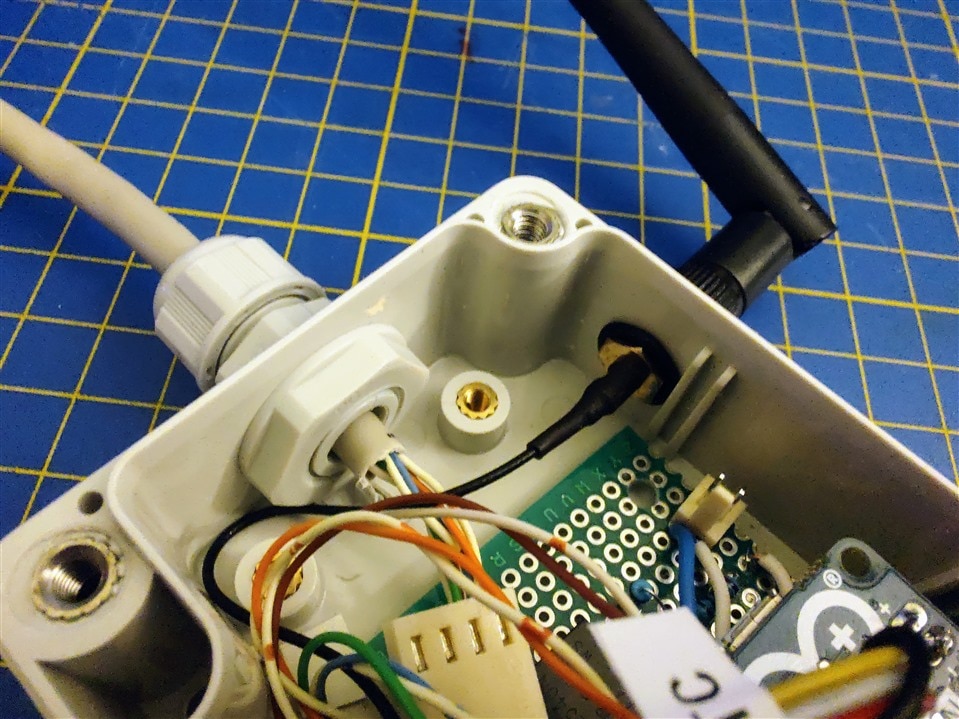
Those precautions will make sure that this box is much more than splashproof for sure. The sensors need to be exposed to the elements to get the measurements, but it's critical we keep the Arduino nice and dry. Before I get to the sensors, On the inside of the sensor box there are a few things, the perfbord with the Arduino and connectors, 2 AA batteries, and an RTC module. I glued the RTC module to the lid of the enclosure using some double-sided sticky tape.
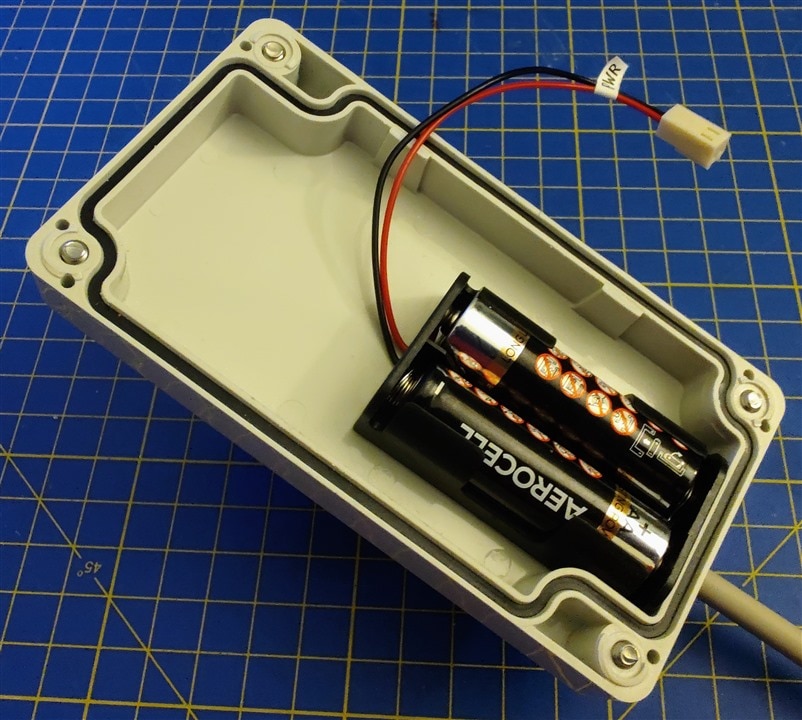
As for the electronics inside, my idea was to make a simple perfboard with a few crimp nylon connectors so I can easily take everything out and work on it if I need to. One thing I would like to add but didn't have time to play with was to maybe add a reed switch somewhere that can be triggered without opening the lid to turn on the sensor box. Currently, there is a connector for the battery that needs to be disconnected to turn off the Sensor Box.

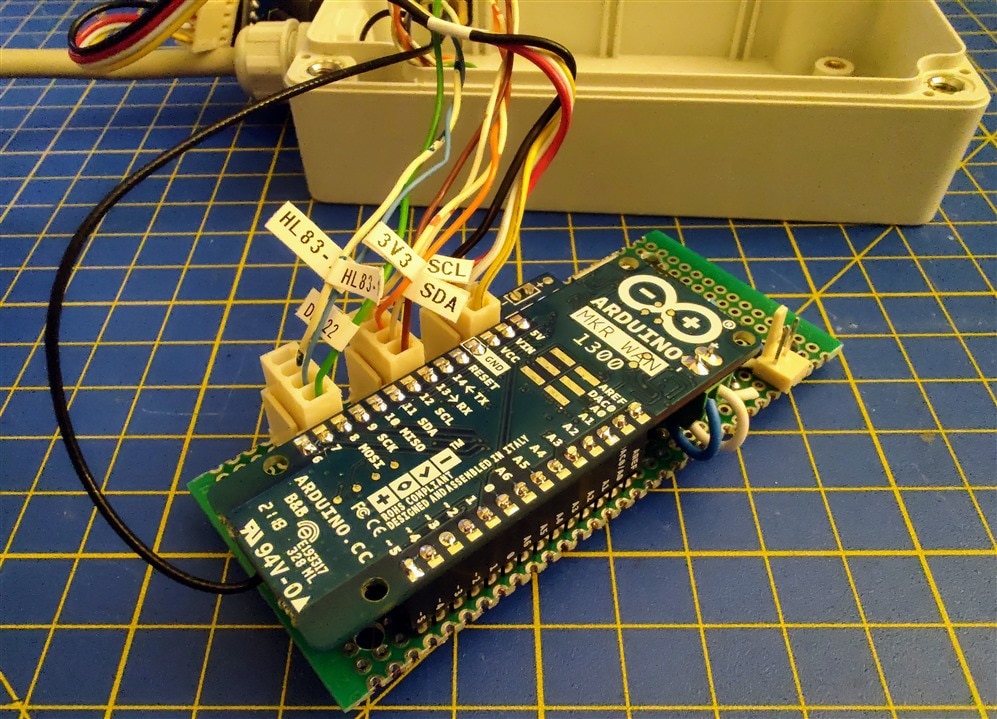
I left screw holes in the perfboard to screw the board into the threaded inserts, but the Arduino is too high by about a few millimeters for everything to fit in properly when the lid is closed, so I had to abandon screwing in the perfboard and just put it on the bottom of the enclosure.
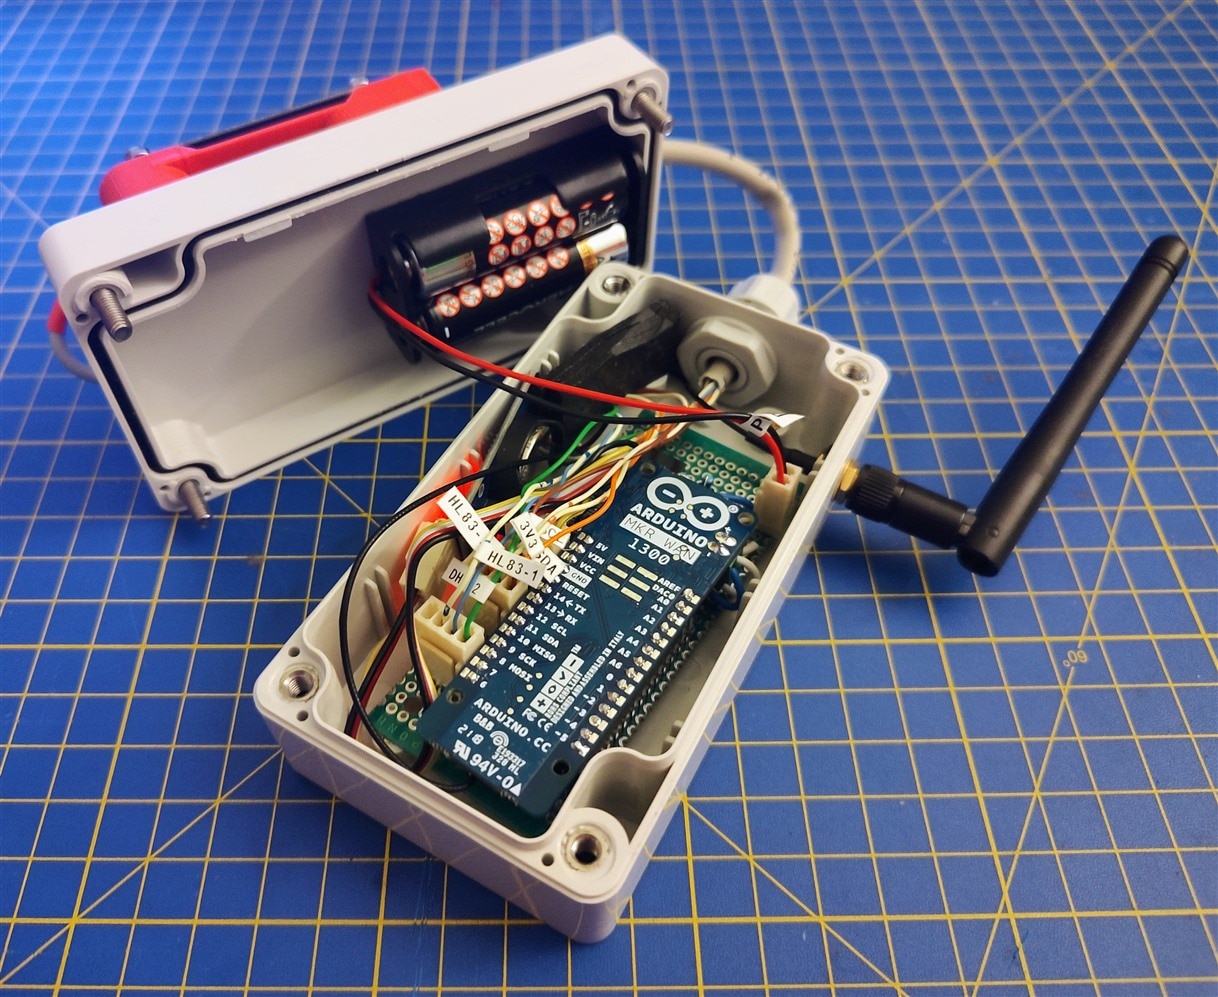
The last thing left was mounting the sensors on the outside of the box. For this, I designed a small sensor mount that is designed to hold all of the sensors and is attached to the box using some double-sided sticky tape so I don't have to drill more holes in the box and make new paths for the water to get in.
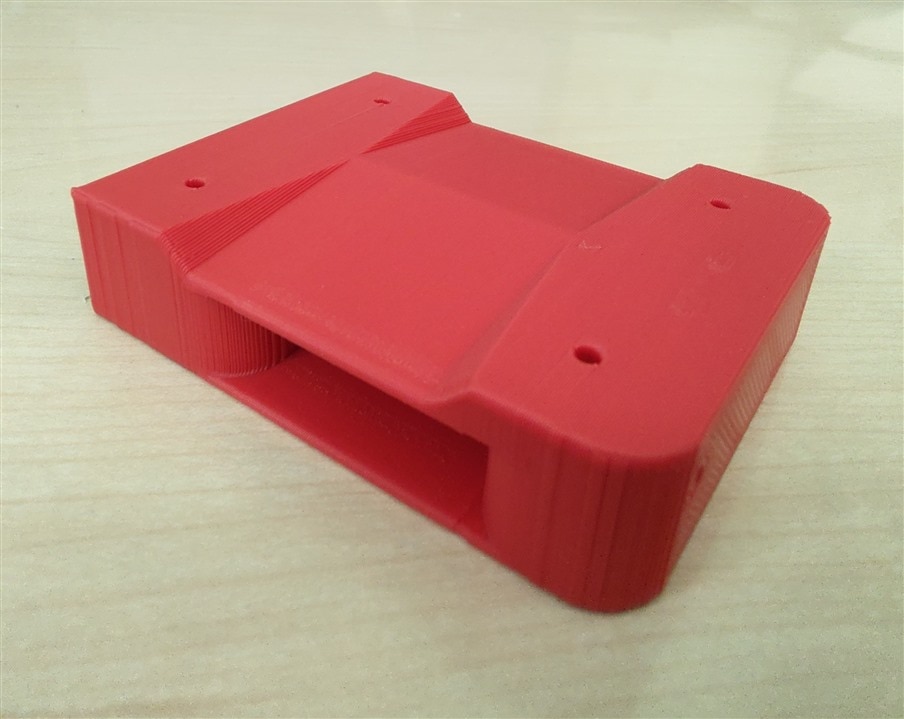

All of the 3D models I am using can be found on the GitHub page that will be available soon (check the bottom of the blog for the link). The mount has slanted edges for water to run off in case it starts raining while the rain sensor will be exposed on top. This isn't the final design of the sensor box since it's still missing the part for how it's supposed to be picked up, but I will be adding that in the next blog. Until then, here is how the sensor box looks like fully assembled.
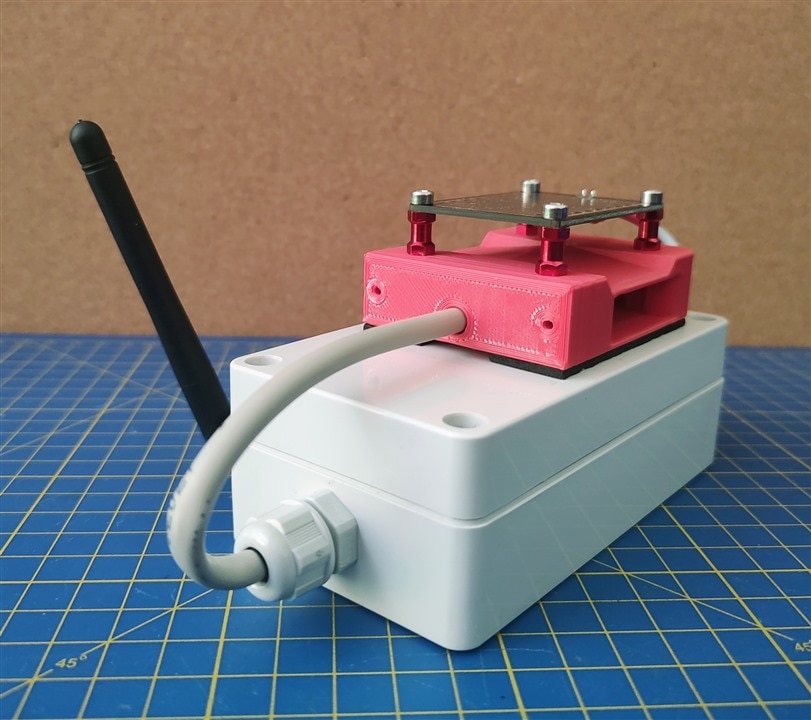
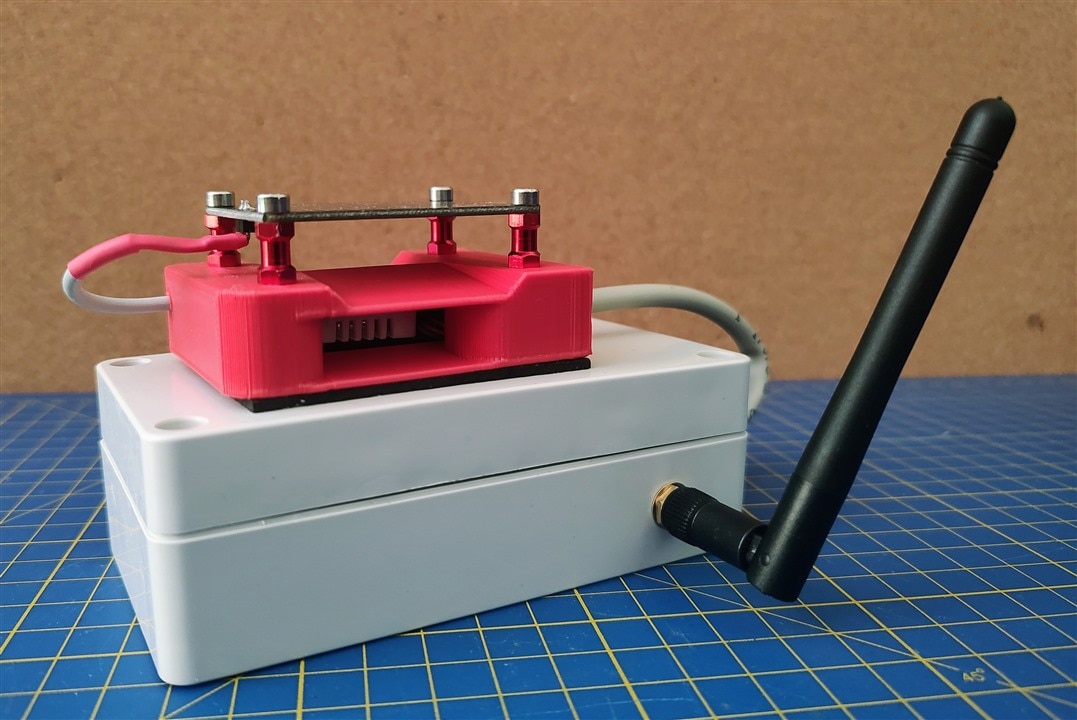
Code
This is the current code that I was using to perform the tests. It's not yet the final code, I will update the code on GitHub as I make changes to it. The code takes measurements from all of the sensors, measures the battery voltage, packs that into a single message, and sends it using LoRa so we can catch the message using the GCS. One thing to point out here is how I form the message. I form the message by packing all of the data between start and end flags. Each start flag starts with "&S" followed by the unique name of that field and ends with "&E" followed by the same unique field name. This enables me to easily extract data on the other side once sent.
/*
 * ORBWEAVER ROVER PROJECT
 * Code for the Sensor Box module
 */

// Libraries
#include "ArduinoLowPower.h"
#include "DHT.h"
#include <Wire.h>

//Libraries
#include <Adafruit_BMP280.h>
#include <ds3231.h>
#include <SPI.h>
#include <LoRa.h>

// ID of this sensor box - unique for each box
#define BOX_ID 1

// MOSFET Pin
#define MOSFET 3

// DHT22
#define DHTPIN 2
#define DHTTYPE DHT22
DHT dht(DHTPIN, DHTTYPE);
float temperature;
float humidity;
float heatIndex;

// Pressure sensor
Adafruit_BMP280 bmp; // use I2C interface
Adafruit_Sensor *bmp_temp = bmp.getTemperatureSensor();
Adafruit_Sensor *bmp_pressure = bmp.getPressureSensor();
double pressure = 0;

// RTC module
struct ts t;
String current_time;
String current_date;

// Rain sensor
int rain_sensor = 0;

// LoRa counter
int msg_counter = 0;

// Battery voltage
float battery_voltage = 3.0;
float voltage;

void setup() {

  // Starting serial
  Serial.begin(9600);

  // Setting up pins
  pinMode(MOSFET, OUTPUT);

  // Setting up the ADC
  analogReadResolution(10);

  // DHT22
  dht.begin();

  // Pressure Sensor
  unsigned status;
  status = bmp.begin(0x76, 0x58);

  /* Default settings from datasheet. */
  bmp.setSampling(Adafruit_BMP280::MODE_NORMAL,     /* Operating Mode. */
                  Adafruit_BMP280::SAMPLING_X2,     /* Temp. oversampling */
                  Adafruit_BMP280::SAMPLING_X16,    /* Pressure oversampling */
                  Adafruit_BMP280::FILTER_X16,      /* Filtering. */
                  Adafruit_BMP280::STANDBY_MS_500); /* Standby time. */

  bmp_temp->printSensorDetails();

  // RTC
  Wire.begin();
  DS3231_init(DS3231_CONTROL_INTCN);

  // LoRa
  if (!LoRa.begin(915E6)) {
    Serial.println("Starting LoRa failed!");
    while (1);
  }

}

void loop() {
  // First we need to get all of the data from the sensors
  // List of things we need to read:
  // 1 - DHT22    - temperature, humidity, heat_index
  // 2 - BMP280   - pressure
  // 3 - RTC      - time and date
  // 4 - Battery  - battery voltage
  // 5 - Rain     - rain sensor reading

  // DHT22
  temperature = dht.readTemperature();
  humidity    = dht.readHumidity();
  heatIndex   = dht.computeHeatIndex(temperature, humidity, false);

  // BMP280
  sensors_event_t pressure_event;
  bmp_pressure -> getEvent(&pressure_event);
  pressure = pressure_event.pressure;

  // RTC
  DS3231_get(&t);
  current_date = String(t.mday) + "/" + String(t.mon) + "/" + String(t.year);
  current_time = String(t.hour) + ":" + String(t.min) + "/" + String(t.sec);

  // Battery voltage
  analogReference(AR_INTERNAL1V0);
  voltage = analogRead(ADC_BATTERY) * (battery_voltage / 1023.0);
  analogReference(AR_DEFAULT);

  // Rain sensor
  digitalWrite(MOSFET, HIGH);
  delay(100);
  rain_sensor = analogRead(A1);
  digitalWrite(MOSFET, LOW);

  /* After gathering all of the necessary data, we need to format it into our message
  // Each field is enclosed in a start flag (&S...) and end flag (&E...)
  // List of all flags:
  # Data Contained in the Sensor Message forwarded by the GCS
  # Numb  - Name          - Start         - Stop          - Description
  # 1     - Message ID    - &SID          - &EID          - ID of the message packet
  # 2     - Box ID        - &SBOXID       - &SBOXID       - ID of the sensor box - Arduino MKR WAN 1300
  # 3     - Date          - &SDATE        - &EDATE        - Date when the message was sent
  # 4     - Time          - &STIME        - &ETIME        - Timestamp when the message was sent
  # 5     - Temperature   - &STEMP        - &ETEMP        - Temperature measured by the DHT22
  # 6     - Heat Index    - &SHEATINDEX   - &EHEATINDEX   - Heat index calculated using the measurements made by the DHT22
  # 7     - Humidity      - &SHUMIDITY    - &EHUMIDITY    - Humidity measured by the DHT22
  # 8     - Pressure      - &SPRESSURE    - &EPRESSURE    - Pressure measured by the BMP280
  # 9     - Battery       - &SBAT         - &EBAT         - Voltage of the batteries powering the sensor box
  # 10    - Rain sensor   - &SRAIN        - &ERAIN        - Measurement of the Arduino Rain Sensor
  */

  // 1  - Message ID
  String msg1 = "&SID" + String(msg_counter) + "&EID";

  // 2  - Box ID
  String msg2 = "&SBOXID" + String(BOX_ID) + "&EBOXID";

  // 3  - Date
  String msg3 = "&SDATE" + current_date + "&EDATE";

  // 4  - Time
  String msg4 = "&STIME" + current_time + "&ETIME";

  // 5  - Temperature
  String msg5 = "&STEMP" + String(temperature) + "&ETEMP";

  // 6  - Heat Index
  String msg6 = "&SHEATINDEX" + String(heatIndex) + "&EHEATINDEX";

  // 7  - Humidity
  String msg7 = "&SHUMIDITY" + String(humidity) + "&EHUMIDITY";

  // 8  - Pressure
  String msg8 = "&SPRESSURE" + String(pressure) + "&EPRESSURE";

  // 9  - Battery
  String msg9 = "&SBAT" + String(voltage) + "&EBAT";

  // 10 - Rain Sensor
  String msg10 = "&SRAIN" + String(rain_sensor) + "&ERAIN";

  // To form the final message, we need to combine all 10 messages into one single message
  String lora_message = msg1 + msg2 + msg3 + msg4 + msg5 + msg6 + msg7 + msg8 + msg9 + msg10;

  // Incrementing the msg_counter
  msg_counter++;

  // Sending the LoRa message
  LoRa.beginPacket();
  LoRa.print(lora_message);
  LoRa.endPacket();

  LowPower.sleep(5000);

}
4. GCS - Ground Control Station
This will be the second thing I will be covering in this blog, the GCS. My plan is to control the rover and get all of the measurements on my PC, but that requires me to have a link between the laptop and the rover, that's where the GCS comes into play. Just an Arduino with an antenna and a USB cable would be sufficient as a GCS, but I wanted to make it a bit more special and add a few more things.
Electronics
Before going over how I connected everything, let's see the component list for this part of the build:
- Arduino MKR WAN 1300 and antenna
- Grove starter kit LCD module
- Grove starter kit Buzzer module
- TM1651 battery level module
- USB type B connector
- Micro USB cable
- Perfboard and some crimp-on connectors
Again, all of the stuff except the Arduino and the antenna are not necessary, though I love how they look put together as you will see in a bit. The micro USB cable I mentioned wasn't for directly connecting the Arduino to the PC, rather, for making a USB type B plug on the outside of the box. It will become more clear in the next section.
Design
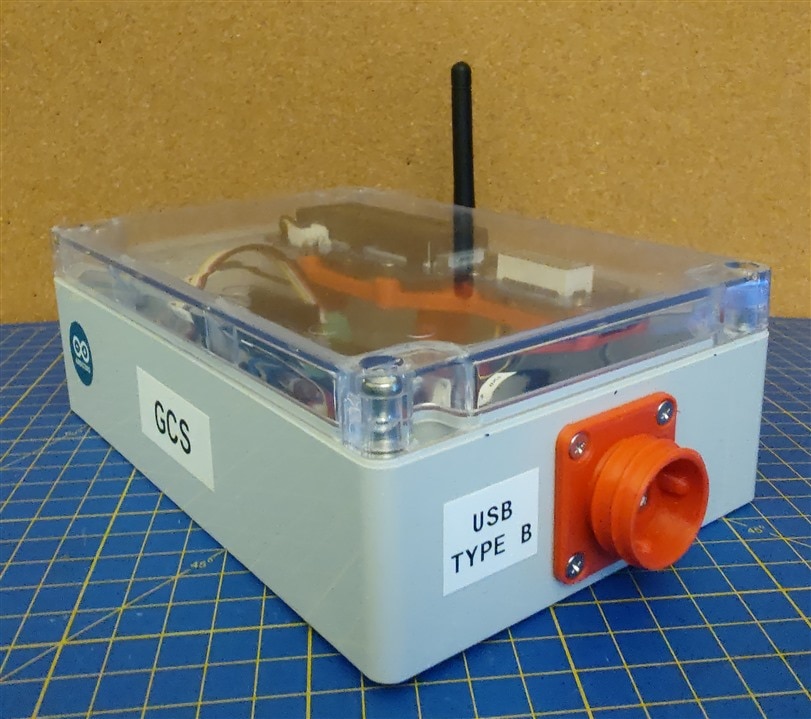
The main part of the design for the GCS is the enclosure. I chose to go with the clear lid enclosure that we got as a part of our starter kit, so I can have a clear view of the displays without needing to cut or drill additional holes on the outside of the box. The only thing left to do is model a 3D printed mount in Fusion360 and print it out. The GCS requires 3 printed parts, 2 of which are part of the mount for the electronics and the third one is a mount for the USB connector that I designed about a year ago for my 1 Meter of Pi Design Challenge.
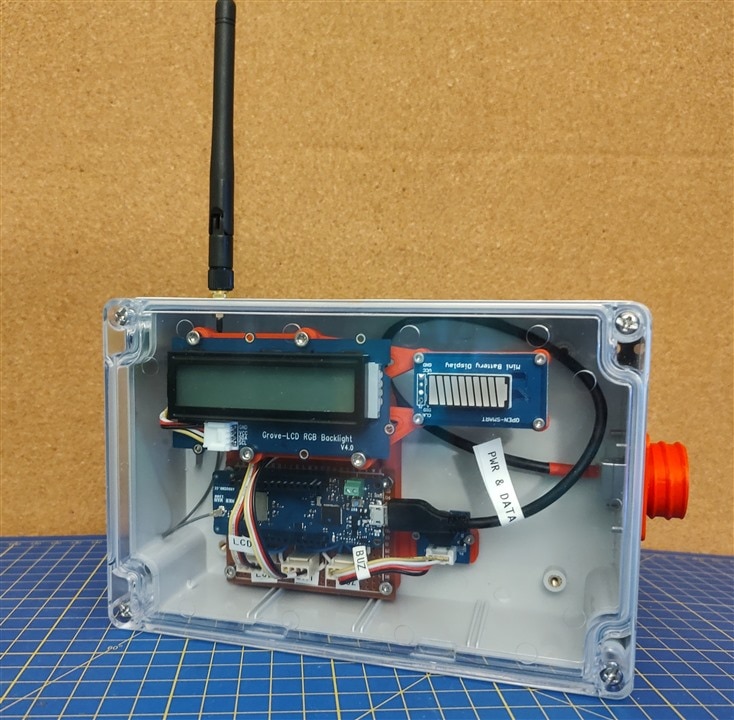
In the first picture, you can see the perfboard mount. The perfboard is mounted using the 4 center holes, the small thing on the right is for mounting the buzzer, while the elevated part is the place where we mount the display mount. The display mount can be seen in the second picture. It has holes left for attaching both the displays and 4 holes for attaching the mounts together using 4 M3 screws. I've designed this so I don't use any nuts, all of the holes are a bit smaller so I can cut a thread into them. I found that this is a great method for 3D prints, especially when we don't need maximum strength like it's the case here. All assembled it looks like this.
In the last picture on the right you can see in red the connector I was talking about. I didn't take too much great care to waterproof it since this will be always near me when using the rover, but it's a nice way of accessing the Arduino without opening the box ever. I designed it so it can be locked with a nut when the cable is plugged in, or have a cap to keep dirt and water out while not in use.
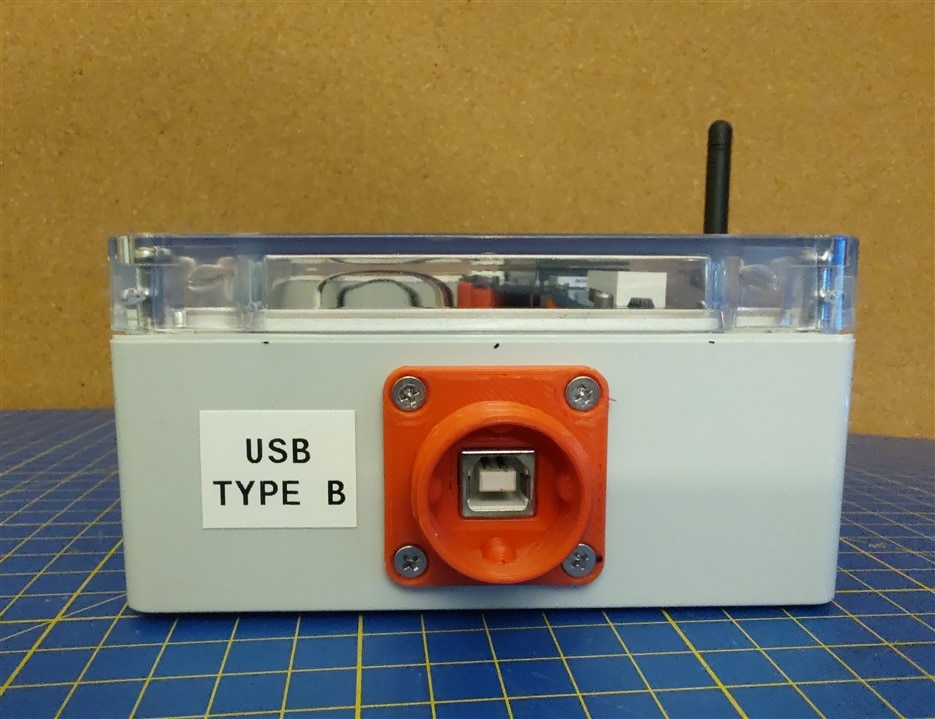
All that's left now is to print out the parts and assemble everything! As I've mentioned previously above, at the end of each blog will be the GitHub link with all of the 3D models. These parts were designed to be printed without any supports, all overhangs are a maximum of 45 degrees.
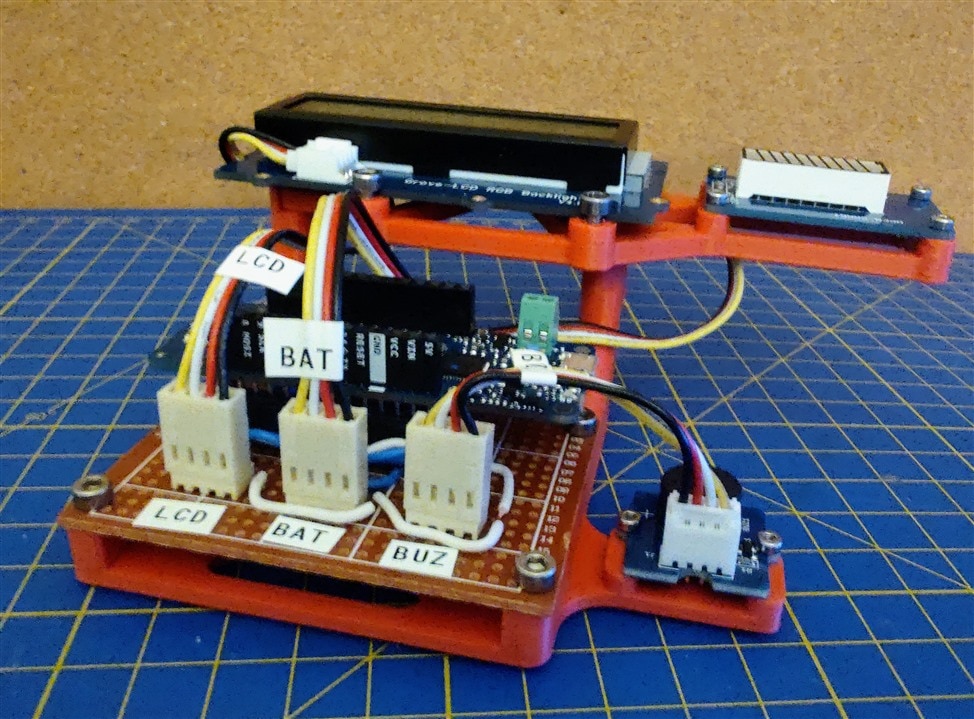
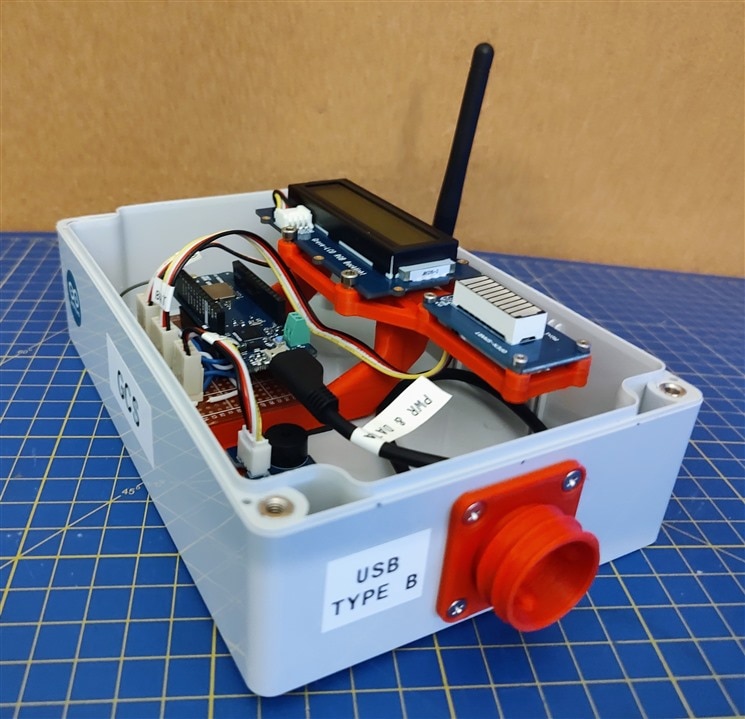
I love the clean look I got from it at the end. For the wires, I used the wires that were in the Grove starter kit, cut the ends off where needed, and added the crimp-on nylon connectors. I was a bit more relaxed here with mounting the antenna compared to the sensor box as it didn't have to be as watertight as that. All it's missing now is the lid, and then we're off to coding!
Code
The main purpose of the GCS code, for now, will be to act as a simple receiver. It will forward all of the data it receives over LoRa to the Serial port, which the GUI will catch process further. To test out the other components, I put the battery display on a cycle, and to make sure that everything is working, the LCD is writing out the number of the package that it received from the sensor box, so I can keep track if that number is increasing or not.
#include <SPI.h>
#include <LoRa.h>
#include <Wire.h>
#include "rgb_lcd.h"
#include "TM1651.h"

#define CLK 3    //pins definitions for TM1651 and can be changed to other ports
#define DIO 4
#define BUZZER 5
TM1651 batteryDisplay(CLK,DIO);

String inputString = "";
bool stringComplete = false;

int batLevel = 0;
long previousTime = 0;
bool risingLevel = true;
int packetNumber = 0;

rgb_lcd lcd;

const int colorR = 200;
const int colorG = 50;
const int colorB = 150;

void setup() {
  // put your setup code here, to run once:
  pinMode(BUZZER, OUTPUT);
  Serial.begin(9600);
  lcd.begin(16, 2);
  lcd.setRGB(colorR, colorG, colorB);
  batteryDisplay.init();
  batteryDisplay.set(7);//set brightness: 0---7
  if (!LoRa.begin(915E6)) {
    Serial.println("Starting LoRa failed!");
    while (1);
  }
}

void loop() {
  // put your main code here, to run repeatedly:
  if(stringComplete == false)
  {
    char c = 'a';
    if(Serial.available() != 0)
    {
      c = (char)Serial.read();
      inputString += c;
    }
    if(c == '\n')
    {
      stringComplete = true;
    }

  }
  else
  {
    Serial.println(inputString);
    lcd.clear();
    lcd.setCursor(0, 0);
    lcd.print(inputString.substring(0, inputString.length() - 1));
    inputString = "";
    stringComplete = false;
  }

  if(millis() - previousTime >= 1000)
  {
    if(risingLevel == true)
    {
    batLevel++;
    if(batLevel == 7) risingLevel = false;
    if(batLevel == 7) beepSiren();
    }
    else
    {
    batLevel--;
    if(batLevel == 0) risingLevel = true;
    if(batLevel == 0) beepSiren();
    }
    batteryDisplay.displayLevel(batLevel);
    previousTime = millis();
  }
  // try to parse packet
  int packetSize = LoRa.parsePacket();
  if (packetSize) {
    // received a packet
    Serial.print("Received packet '");

    // read packet
    while (LoRa.available()) {
      char inChar = (char)LoRa.read();
      Serial.print(inChar);
      inputString += inChar;
    }

    // print RSSI of packet
    Serial.print("' with RSSI ");
    Serial.println(LoRa.packetRssi());

    packetNumber++;
    lcd.clear();
    lcd.setCursor(0, 0);
    lcd.print("Received package with ID:");
    lcd.setCursor(0, 1);
    int pos = inputString.indexOf("&EID");
    lcd.print(inputString.substring(4,pos));
    inputString = "";
  }

}

void beepSiren()
{
  return;
  digitalWrite(BUZZER, HIGH);
  delay(200);
  digitalWrite(BUZZER, LOW);
  delay(100);
  digitalWrite(BUZZER, HIGH);
  delay(200);
  digitalWrite(BUZZER, LOW);
  delay(100);
}
5. GUI
This is the place where I had to work the most, but thankfully, everything worked out great in the end as you will see, which will make the rest of the project go a bit easier. For designing and programming the GUI I went with Python and PyQt5. I have some experience working with PyQt, plus, Python makes it really easy to gather all of the data from the serial port and then process it. My idea is to design a 2 window application, where one window will be for looking at the data coming from the rover and sending the commands to the rover, while the other one will be for displaying the data from the sensor boxes. I've for now done the data displaying for sensor box 1 because I haven't yet built the other one. Here is how the GUI looks at the moment.
Design
On the picture is the second window of the GUI, the sensor window. The window is divided into 2 sections, each containing the relevant data for that sensor box. For now, I've done the live graph for all of the values that the sensor box is tracking, but I left some space in the bottom for a few things:
- Sensor box info data - Just general data about the sensor box, I may add this as a message that is sent every hour or so from the sensor box
- GPS coordinates - the rover will have a GPS module, so it will update the GPS for the box as long as the box is still on the rover
- Latest readings for the data
- RSSI
As I've already mentioned above, the second window is currently blank, so I haven't included any pictures of it, but I will get working on it pretty soon! Here's a video of how to the live graphs look through about an hour of measurement compressed into one minute.
Code
The code for this is still a work in progress of course, and it will be that until the end of the project since will be the place that will require the most amount of work alongside the rover code. For now, though, the code for this GUI does a few things:
- Collects data from a specified serial port
- Extracts the data from the raw serial data
- Updates all of the graphs as soon as it extracts the data
- Logs all of the data into a CSV file for further processing - this is something I will cover in one of the parts of this blog!
# PYQT Stuff
from PyQt5.QtWidgets import QApplication, QPushButton, QLineEdit, QLabel, QWidget, QSlider, QSpinBox, QComboBox, QMainWindow
from PyQt5.QtGui import QPainter, QColor, QPen, QFont, QBrush
from PyQt5.QtCore import Qt, QTimer
from PyQt5 import QtWidgets
from pyqtgraph.Qt import QtGui, QtCore
from pyqtgraph import PlotWidget, plot
import pyqtgraph as pg

# Libraries
import csv
import datetime
import os
import sys
import threading
import time
import serial
from random import randint


# Design Variables
borderColor = QColor(180, 180, 180)
borderWidth = 3

gcs = serial.Serial("COM3", 9600)

print("Writing to Arduino")

# Data Contained in the Sensor Message forwarded by the GCS
# Numb  - Name          - Start         - Stop          - Description
# 1     - Message ID    - &SID          - &EID          - ID of the message packet
# 2     - Box ID        - &SBOXID       - &EBOXID       - ID of the sensor box - Arduino MKR WAN 1300
# 3     - Date          - &SDATE        - &EDATE        - Date when the message was sent
# 4     - Time          - &STIME        - &ETIME        - Timestamp when the message was sent
# 5     - Temperature   - &STEMP        - &ETEMP        - Temperature measured by the DHT22
# 6     - Heat Index    - &SHEADINDEX   - &EHEATINDEX   - Heat index calculated using the measurements made by the DHT22
# 7     - Humidity      - &SHUMIDITY    - &EHUMIDITY    - Humidity measured by the DHT22
# 8     - Pressure      - &SPRESSURE    - &EPRESSURE    - Pressure measured by the BMP280
# 9     - Battery       - &SBAT         - &EBAT         - Voltage of the batteries powering the sensor box
# 10    - Rain sensor   - &SRAIN        - &ERAIN        - Measurement of the Arduino Rain Sensor

# Variables for storing all of the data from the GCS
message_id  = 0
box_id  	= 0
msg_date    = ''
msg_time    = ''
temperature = 0.0
heat_index  = 0.0
humidity    = 0.0
pressure    = 0.0
battery     = 0.0
rain_sensor = 0

batch_size = 7000
sb1_temp = []
sb1_humidity  = []
sb1_pressure = []
sb1_battery = []
sb1_heatindex = []
sb1_time = []

flags = ['ID', 'BOXID', 'DATE', 'TIME', 'TEMP', 'HEATINDEX', 'HUMIDITY', 'PRESSURE', 'BAT', 'RAIN']

def is_float(number):
    try:
        float(number)
        return True
    except ValueError:
        return False

# Function for logging the data into a CSV file
def log_data(data, id):

    file_name = 'SensorBox' + str(id) + '.csv'
    file_path = './' + file_name

    if os.path.isfile(file_path) == False:
        print('The CSV file for the box ' + str(id) + ' doesn\'t exist, trying to create it')
        print('Name of the file: ' + file_path)

        with open(file_path, mode = 'w', newline = '') as log_file:
            writer = csv.writer(log_file)
            writer.writerow(['MESSAGE_ID', 'DATE', 'TIME', 'TEMP', 'HEATINDEX', 'HUMIDITY', 'PRESSURE', 'BAT', 'RAIN'])

    with open(file_path, mode = 'a', newline = '') as log_file:
        writer = csv.writer(log_file)
        writer.writerow(data)

    return

count = 0

# Function for parsing the Sensor Box data
def parseData(data):
    global message_id, box_id, msg_date, msg_time, temperature, heat_index, humidity, pressure, battery, rain_sensor

    global flags

    id_box = 0
    csv_data = []

    for flag in flags:
        start_flag  = '&S' + flag
        end_flag    = '&E' + flag
        extracted_data  = data[data.find(start_flag) + len(start_flag) : data.find(end_flag)]
        print(flag + ':\t' + extracted_data)

        if flag == 'BOXID':
            id_box = 1
            #id_box = int(extracted_data)
        else:
            csv_data.append(extracted_data)

        # Test plotting
        global sb1_temp, sb1_time, sb1_humidity, sb1_pressure, sb1_battery, sb1_heatindex, count

        if flag == 'TEMP' and is_float(extracted_data) == True:
            sb1_temp.append(float(extracted_data))
            sb1_time.append(count)
            count += 1

        if flag == 'HEATINDEX' and is_float(extracted_data) == True:
            sb1_heatindex.append(float(extracted_data))

        if flag == 'HUMIDITY' and is_float(extracted_data) == True:
            sb1_humidity.append(float(extracted_data))

        if flag == 'PRESSURE' and is_float(extracted_data) == True:
            sb1_pressure.append(float(extracted_data))

        if flag == 'BAT' and is_float(extracted_data) == True:
            sb1_battery.append(float(extracted_data))

    print('----------------------------------------------------------------------------------------------')
    log_data(csv_data, id_box)

class RoverWindow(QWidget):

    def __init__(self):
        super().__init__()
        self.title = 'Rover Command'
        self.left = 200
        self.top = 200
        self.width = 1920
        self.height = 1080
        self.qTimer = QTimer()
        self.qTimer.setInterval(50)
        self.qTimer.start()
        self.setWindowIcon(QtGui.QIcon('./Orbweaver.png'))
        self.initUI()

    def initUI(self):
        self.setWindowTitle(self.title)
        self.setGeometry(self.left, self.top, self.width, self.height)
        self.setAutoFillBackground(True)
        p = self.palette()
        p.setColor(self.backgroundRole(), QColor(25, 35, 40))
        self.setPalette(p)
        self.show()

    def paintEvent(self, event):
        global borderColor, borderWidth

        painter = QPainter()
        painter.begin(self)
        painter.setRenderHint(QPainter.Antialiasing)

        # Pen for drawing the sensor box borders
        painter.setPen(QPen(borderColor, borderWidth))


class SensorWindow(QWidget):

    global sb1_temp, sb1_time, sb1_heatindex, sb1_humidity, sb1_pressure, sb1_battery

    def __init__(self):
        super().__init__()
        self.title = 'Sensor Data'
        self.left = 200
        self.top = 200
        self.width = 1920
        self.height = 1080
        self.qTimer = QTimer()
        self.qTimer.setInterval(50)
        self.qTimer.start()
        self.qTimer.timeout.connect(self.update_plot_data)
        self.setWindowIcon(QtGui.QIcon('./Orbweaver.png'))
        self.initUI()

    def initUI(self):
        self.setWindowTitle(self.title)
        self.setGeometry(self.left, self.top, self.width, self.height)
        self.setAutoFillBackground(True)
        p = self.palette()
        p.setColor(self.backgroundRole(), QColor(25, 35, 40))
        self.setPalette(p)

        #
        # Graph widgets for Sensor Box 1
        #

        # Temperature and Heat Index
        self.label_sb1_temperature = QLabel(self)
        self.label_sb1_temperature.setText("Temperature & Heat Index")
        self.label_sb1_temperature.setGeometry(20, 17, 420, 20)
        self.label_sb1_temperature.setFont(QFont("Arial", 18))
        self.label_sb1_temperature.setStyleSheet("QLabel {color : rgb(150, 150, 150)}")
        self.label_sb1_temperature.setAlignment(QtCore.Qt.AlignCenter)

        self.graphWidget_sb1_temperature = pg.PlotWidget(self)
        self.graphWidget_sb1_temperature.setGeometry(20, 50, 440, 350)
        self.graphWidget_sb1_temperature.setBackground(None)
        self.graphWidget_sb1_temperature.setYRange(-20, 15, padding=0.04)

        data1_pen = pg.mkPen(color=(255, 7, 58), width=3)
        self.dataLine_sb1_temperature = self.graphWidget_sb1_temperature.plot(sb1_time, sb1_temp, pen = data1_pen)

        data2_pen = pg.mkPen(color=(255, 95, 31), width=3)
        self.dataLine_sb1_heatindex = self.graphWidget_sb1_temperature.plot(sb1_time, sb1_heatindex, pen = data2_pen)

        # Humidity
        self.label_sb1_humidity = QLabel(self)
        self.label_sb1_humidity.setText("Humidity")
        self.label_sb1_humidity.setGeometry(490, 17, 440, 20)
        self.label_sb1_humidity.setFont(QFont("Arial", 18))
        self.label_sb1_humidity.setStyleSheet("QLabel {color : rgb(150, 150, 150)}")
        self.label_sb1_humidity.setAlignment(QtCore.Qt.AlignCenter)

        self.graphWidget_sb1_humidity = pg.PlotWidget(self)
        self.graphWidget_sb1_humidity.setGeometry(490, 50, 440, 350)
        self.graphWidget_sb1_humidity.setBackground(None)
        self.graphWidget_sb1_humidity.setYRange(0, 100, padding=0.04)

        data1_pen = pg.mkPen(color=(255, 237, 39), width=3)
        self.dataLine_sb1_humidity = self.graphWidget_sb1_humidity.plot(sb1_time, sb1_humidity, pen = data1_pen)

        # Air Pressure
        self.label_sb1_pressure = QLabel(self)
        self.label_sb1_pressure.setText("Air Pressure")
        self.label_sb1_pressure.setGeometry(20, 412, 420, 20)
        self.label_sb1_pressure.setFont(QFont("Arial", 18))
        self.label_sb1_pressure.setStyleSheet("QLabel {color : rgb(150, 150, 150)}")
        self.label_sb1_pressure.setAlignment(QtCore.Qt.AlignCenter)

        self.graphWidget_sb1_pressure = pg.PlotWidget(self)
        self.graphWidget_sb1_pressure.setGeometry(20, 443, 440, 350)
        self.graphWidget_sb1_pressure.setBackground(None)
        self.graphWidget_sb1_pressure.setYRange(900, 1100, padding=0.04)

        data1_pen = pg.mkPen(color=(0, 200, 255), width=3)
        self.dataLine_sb1_pressure = self.graphWidget_sb1_pressure.plot(sb1_time, sb1_pressure, pen = data1_pen)

        # Battery Voltage
        self.label_sb1_battery_level = QLabel(self)
        self.label_sb1_battery_level.setText("Battery Voltage")
        self.label_sb1_battery_level.setGeometry(490, 412, 440, 20)
        self.label_sb1_battery_level.setFont(QFont("Arial", 18))
        self.label_sb1_battery_level.setStyleSheet("QLabel {color : rgb(150, 150, 150)}")
        self.label_sb1_battery_level.setAlignment(QtCore.Qt.AlignCenter)

        self.graphWidget_sb1_battery_level = pg.PlotWidget(self)
        self.graphWidget_sb1_battery_level.setGeometry(490, 443, 440, 350)
        self.graphWidget_sb1_battery_level.setBackground(None)
        self.graphWidget_sb1_battery_level.setYRange(2.4, 2.9, padding=0.04)

        data1_pen = pg.mkPen(color=(57, 255, 20), width=3)
        self.dataLine_sb1_battery = self.graphWidget_sb1_battery_level.plot(sb1_time, sb1_battery, pen = data1_pen)

        #
        # Graph widgets for Sensor Box 2
        #

        # Temperature and Heat Index
        self.label_sb1_temperature = QLabel(self)
        self.label_sb1_temperature.setText("Temperature & Heat Index")
        self.label_sb1_temperature.setGeometry(980, 17, 440, 20)
        self.label_sb1_temperature.setFont(QFont("Arial", 18))
        self.label_sb1_temperature.setStyleSheet("QLabel {color : rgb(150, 150, 150)}")
        self.label_sb1_temperature.setAlignment(QtCore.Qt.AlignCenter)

        self.graphWidget_sb1_temperature = pg.PlotWidget(self)
        self.graphWidget_sb1_temperature.setGeometry(980, 50, 440, 350)
        self.graphWidget_sb1_temperature.setBackground(None)
        self.graphWidget_sb1_temperature.setYRange(-20, 40, padding=0.04)


        # Humidity
        self.label_sb2_humidity = QLabel(self)
        self.label_sb2_humidity.setText("Humidity")
        self.label_sb2_humidity.setGeometry(1450, 17, 440, 20)
        self.label_sb2_humidity.setFont(QFont("Arial", 18))
        self.label_sb2_humidity.setStyleSheet("QLabel {color : rgb(150, 150, 150)}")
        self.label_sb2_humidity.setAlignment(QtCore.Qt.AlignCenter)

        self.graphWidget_sb2_humidity = pg.PlotWidget(self)
        self.graphWidget_sb2_humidity.setGeometry(1450, 50, 440, 350)
        self.graphWidget_sb2_humidity.setBackground(None)
        self.graphWidget_sb2_humidity.setYRange(0, 100, padding=0.04)

        # Air Pressure
        self.label_sb2_pressure = QLabel(self)
        self.label_sb2_pressure.setText("Air Pressure")
        self.label_sb2_pressure.setGeometry(970, 412, 440, 20)
        self.label_sb2_pressure.setFont(QFont("Arial", 18))
        self.label_sb2_pressure.setStyleSheet("QLabel {color : rgb(150, 150, 150)}")
        self.label_sb2_pressure.setAlignment(QtCore.Qt.AlignCenter)

        self.graphWidget_sb2_pressure = pg.PlotWidget(self)
        self.graphWidget_sb2_pressure.setGeometry(970, 443, 440, 350)
        self.graphWidget_sb2_pressure.setBackground(None)
        self.graphWidget_sb2_pressure.setYRange(900, 1100, padding=0.04)

        # Battery Voltage
        self.label_sb2_battery_level = QLabel(self)
        self.label_sb2_battery_level.setText("Battery Voltage")
        self.label_sb2_battery_level.setGeometry(1450, 412, 440, 20)
        self.label_sb2_battery_level.setFont(QFont("Arial", 18))
        self.label_sb2_battery_level.setStyleSheet("QLabel {color : rgb(150, 150, 150)}")
        self.label_sb2_battery_level.setAlignment(QtCore.Qt.AlignCenter)

        self.graphWidget_sb2_battery_level = pg.PlotWidget(self)
        self.graphWidget_sb2_battery_level.setGeometry(1450, 443, 440, 350)
        self.graphWidget_sb2_battery_level.setBackground(None)
        self.graphWidget_sb2_battery_level.setYRange(2.4, 3.1, padding=0.04)

        self.show()

    def update_plot_data(self):
        global sb1_temp, sb1_time, sb1_heatindex, sb1_humidity, sb1_pressure, sb1_battery, batch_size
        if len(sb1_time) > batch_size:
            self.dataLine_sb1_temperature.setData(sb1_time[len(sb1_time) - batch_size:], sb1_temp[len(sb1_time) - batch_size:])
            self.dataLine_sb1_heatindex.setData(sb1_time[len(sb1_time) - batch_size:], sb1_heatindex[len(sb1_time) - batch_size:])
            self.dataLine_sb1_humidity.setData(sb1_time[len(sb1_time) - batch_size:], sb1_humidity[len(sb1_time) - batch_size:])
            self.dataLine_sb1_pressure.setData(sb1_time[len(sb1_time) - batch_size:], sb1_pressure[len(sb1_time) - batch_size:])
            self.dataLine_sb1_battery.setData(sb1_time[len(sb1_time) - batch_size:], sb1_battery[len(sb1_time) - batch_size:])

        else:
            self.dataLine_sb1_temperature.setData(sb1_time, sb1_temp)
            self.dataLine_sb1_heatindex.setData(sb1_time, sb1_heatindex)
            self.dataLine_sb1_humidity.setData(sb1_time, sb1_humidity)
            self.dataLine_sb1_pressure.setData(sb1_time, sb1_pressure)
            self.dataLine_sb1_battery.setData(sb1_time, sb1_battery)

    def paintEvent(self, event):
        global borderColor, borderWidth

        painter = QPainter()
        painter.begin(self)
        painter.setRenderHint(QPainter.Antialiasing)

        # Pen for drawing the sensor box borders
        painter.setPen(QPen(borderColor, borderWidth))

        # Main sensor box borders
        painter.drawRect(10, 10, 940, 1000)
        painter.drawRect(970, 10, 940, 1000)

        # Sensor box input data retangles
        painter.drawRect(10, 800, 940, 210)
        painter.drawRect(970, 800, 940, 210)

        # Drawing the graph separators
        painter.drawLine(475, 10, 475, 800)
        painter.drawLine(10, 405, 945, 405)
        painter.drawLine(650, 800, 650, 1010)
        painter.drawLine(1430, 10, 1430, 800)
        painter.drawLine(970, 405, 1910, 405)
        painter.drawLine(1620, 800, 1620, 1010)

        painter.setPen(QPen(borderColor, borderWidth / 2))

        painter.drawLine(10, 40, 945, 40)
        painter.drawLine(970, 40, 1910, 40)
        painter.drawLine(10, 435, 945, 435)
        painter.drawLine(970, 435, 1910, 435)


class Controller:

    def __init__(self):
        pass

    def show_rover_window(self):
        self.rover_window = RoverWindow()
        self.rover_window.show()

    def show_sensor_window(self):
        self.sensor_window = SensorWindow()
        self.sensor_window.show()


def main():
    app = QApplication(sys.argv)
    controller = Controller()
    controller.show_rover_window()
    controller.show_sensor_window()
    sys.exit(app.exec_())

def serialDataFunction():
    global gcs

    while True:
        gcs_data = str(gcs.readline())
        parseData(gcs_data)


# Main function
if __name__ == "__main__":

    serialThread = threading.Thread(target = serialDataFunction)
    serialThread.start()

    main()
Some of the next steps for this code will be adding the support for the second sensor box, adding a console log to see all of the incoming and outgoing serial messages, adding sensor monitoring for all of the rover sensors (still deciding on all of the sensors that the rover will be carrying around), rover commands and so on.
6. Processing the data
As mentioned above, all of the data is saved into a CSV file using the python CSV library. This allows me to open the data later in Excel or similar software and to check it out or, use python again to load up that data and do some processing with it, plotting it and stuff like that. Here is how the data looks saved in a CSV file.
From left to right we have, the message ID, date, time, temperature, heat index, humidity, air pressure, battery voltage, and rain sensor readings (I had some trouble with the rain sensor that I still wasn't able to troubleshoot properly, but I will get it fixed soon). In the ideal world, I would just load up the data in python and display it, but, there are a few issues. On the picture above, you can see that some of the messages are doubled looking at the message ID. That's one of the things that we need to take care of. Another thing is messages from different sources or corrupted messages, that can be seen in this picture:
This data processing could have been done before saving it into a CSV file which would be a better approach, which I plan on fixing, but since these were my first tests, I had to do some data correction at this stage. That was easily done with a small python script that loaded up the data, discarded any messages that weren't with a new ID, and also discarded messages that just don't have an ID at all. There's another place where I have to make a correction and that's the time column. Instead of having the time in the format hh:mm:ss, I accidentally put in the hh:mm/ss format. This wasn't my desired way of storing it, though, it made it quite easy to extract the fields out of the time data.
import csv
import datetime
import matplotlib.pyplot as plt
import matplotlib.dates as mdates

# Data that we will be extracting from the CSV file
temperature = []
heat_index  = []
humidity    = []
pressure    = []
battery     = []
timestamps  = []

# Message counter we will be using to not double up on data
# We don't start from the beginning, since I deployed the sensor box from my room
message_counter = 400
last_message = 0

# Function for converting our csv cells to a datetime object
def convert_to_datetime(date, time):
  day       = date[:date.find('/')]
  month     = date[len(day) + 1 : date.find('/', len(day) + 1, len(date))]
  year      = date[len(day) + len(month) + 2:]
  hour      = time[:time.find(':')]
  minute    = time[len(hour) + 1 : time.find('/')]
  second    = time[time.find('/') + 1:]

  timestamp = datetime.datetime(int(year), int(month), int(day), int(hour), int(minute), int(second))
  return timestamp

with open('./SensorBox1.csv', mode = 'r') as log_file:
  csv_reader = csv.reader(log_file)

  # Extracting the headers from the CSV file
  header = []
  header = next(csv_reader)
  print(header)

  # Reading the data from the CSV file
  rows = []
  for row in csv_reader:
    rows.append(row)
  print(len(rows))

  # Data for each row is in this format:
  # 0 - Message ID
  # 1 - Date
  # 2 - Time
  # 3 - Temperature
  # 4 - Heat Index
  # 5 - Humidity
  # 6 - Pressure
  # 7 - Battery
  # 8 - Rain

  # Extracting all of the data into it's own arrays
  for i in range(len(rows)):
    # We're checking here if we're on the right row
    if rows[i][0].isnumeric() == True and rows[i][0] != str(last_message):
      # This is the case where we actually use the data
      temperature.append(float(rows[i][3]))
      heat_index.append(float(rows[i][4]))
      humidity.append(float(rows[i][5]))
      pressure.append(float(rows[i][6]))
      battery.append(float(rows[i][7]))
      timestamps.append(convert_to_datetime(rows[i][1], rows[i][2]))
      last_message = int(rows[i][0])


# plot
fig, ax = plt.subplots()
ax.grid(axis = 'both', color = 'black', linestyle = '-', linewidth = 0.2)
ax.set_title('Temperature & Heat Index Measurements Room')
ax.set_xlabel('Timestamp')
ax.set_ylabel('Temperature [C°]')
ax.plot(timestamps, temperature, linewidth = 0.9, color = 'r', label = 'temperature')
ax.plot(timestamps, heat_index, linewidth = 0.9, color = 'b', label = 'heat index')
#ax.vlines(x=datetime.datetime(2022,1,25,7,0,0), ymin=-13, ymax=8, colors='g', ls='--', lw=1, label='sunrise')
plt.gcf().autofmt_xdate()
myFmt = mdates.DateFormatter('%H:%M')
ax.xaxis.set_major_formatter(myFmt)
ax.legend()
fig.savefig('./RoomGraphs/TemperatureMeasurementRoom.png', dpi = 200)
plt.show()


# plot
fig, ax = plt.subplots()
ax.grid(axis = 'both', color = 'black', linestyle = '-', linewidth = 0.2)
ax.set_title('Humidity Measurements Room')
ax.set_xlabel('Timestamp')
ax.set_ylabel('Relative Humidity [%]')
ax.plot(timestamps, humidity, linewidth = 1.0, color = 'b', label = 'humidity')
plt.gcf().autofmt_xdate()
myFmt = mdates.DateFormatter('%H:%M')
ax.xaxis.set_major_formatter(myFmt)
fig.savefig('./RoomGraphs/HumidityMeasurementRoom.png', dpi = 200)
plt.show()

# plot
fig, ax = plt.subplots()
ax.grid(axis = 'both', color = 'black', linestyle = '-', linewidth = 0.2)
ax.set_title('Air Pressure Measurements Room')
ax.set_xlabel('Timestamp')
ax.set_ylabel('Air Pressure [kPa]')
ax.plot(timestamps, pressure, linewidth = 1.0, color = 'b', label = 'pressure')
plt.gcf().autofmt_xdate()
myFmt = mdates.DateFormatter('%H:%M')
ax.xaxis.set_major_formatter(myFmt)
fig.savefig('./RoomGraphs/AirPressureMeasurementRoom.png', dpi = 200)
plt.show()

print(len(battery))
batch_size = 50
batch_num = 0
avereaged_data = []
timestamps1 = []
current_batch = 0
for i in range(len(battery)):
  current_batch += battery[i]
  if i >= batch_size * (batch_num + 1) - 1:
    avereaged_data.append(current_batch / batch_size)
    timestamps1.append(timestamps[i])
    current_batch = 0
    batch_num += 1

# plot
fig, ax = plt.subplots()
ax.grid(axis = 'both', color = 'black', linestyle = '-', linewidth = 0.2)
ax.set_title('Battery Voltage')
ax.set_xlabel('Timestamp')
ax.set_ylabel('Battery Voltage [V]')
ax.plot(timestamps, battery, linewidth = 0.3, color = 'b', label = 'Raw readings')
ax.plot(timestamps1, avereaged_data, linewidth = 2.0, color = 'r', label = 'Averaged data')
#ax.vlines(x=datetime.datetime(2022,1,25,7,0,0), ymin=2.825, ymax=3, colors='g', ls='--', lw=2, label='sunrise')
plt.gcf().autofmt_xdate()
myFmt = mdates.DateFormatter('%H:%M')
ax.xaxis.set_major_formatter(myFmt)
fig.savefig('./RoomGraphs/BatteryVoltageRoom.png', dpi = 200)
plt.show()
The code, in the end, gives us 4 different graphs, one that displays temperature and heat index, one that displays humidity, one that displays the air pressure, and one that displays the battery voltage. The live graphs are a great visualization tool to see the trend of how the data is changing, but we can get much more from these graphs by working with the data and tweaking with a lot of the parameters. One of the things I had to do was do an extra plot for the battery voltage. Since the Arduino uses a 10 bit ADC for measuring the voltage, the voltage would jump between 2 values on the graph before settling down to the lower one. To get a clearer view, I made a graph that took the average of every 100 measurements and plotted that, which gave us a great representation of the trend of the battery voltage. You will see all of these graphs in the next section
7. Testing
Now comes the fun part, testing all of this. The messages were sent every 5 seconds which is too much by any means for the type of measurements I'm doing here, but I wanted to get as many data points as I could and also see the batteries deplete faster. I've conducted 3 tests with I would say around 40 to 50 thousand data points on a single pair of AA batteries. Here are the tests I performed, my results, and my findings!
Test 1 - Night Outside
The first test I performed was a night outside test for the sensor box. As soon as I finished assembling the box and made sure I was receiving the data, I put it outside my window for the whole night. It was a pretty tough night for the sensor box not gonna lie, since the temperatures dropped below -10C. But the sensor box had no issues dealing with that at all. One thing I might do in the future when conducting these long night cold experiments is adding a silica bag or something like that inside the box since I am assembling them in a room that has moisture. Here are the results from that night, beginning with the temperature.
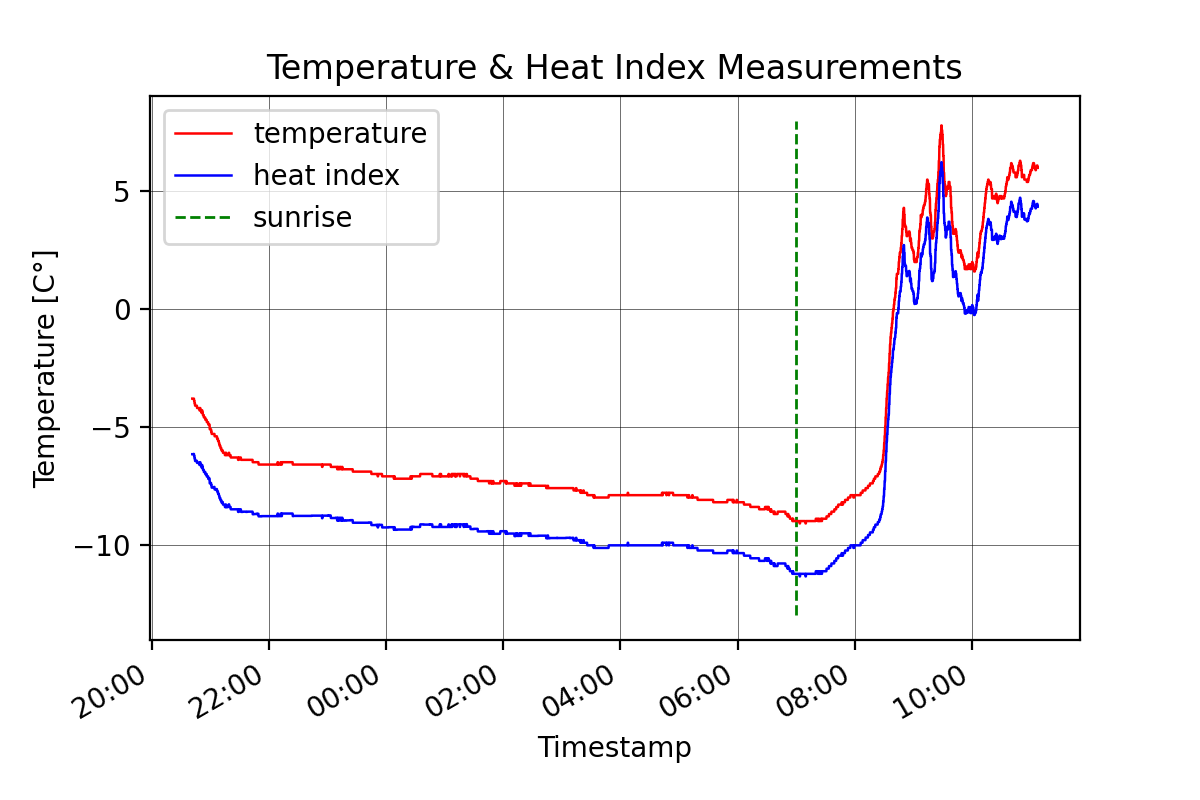
I found on google the approximate sunrise time and added it to the graph. It was a pretty cold night as you could see from the graph, and I love how you can see the temperature leveling out as soon as the sun came out. The heat index is what is the temperature that we are feeling that is based on a calculation using the current temperature and humidity. Now we have the humidity and air pressure graphs.
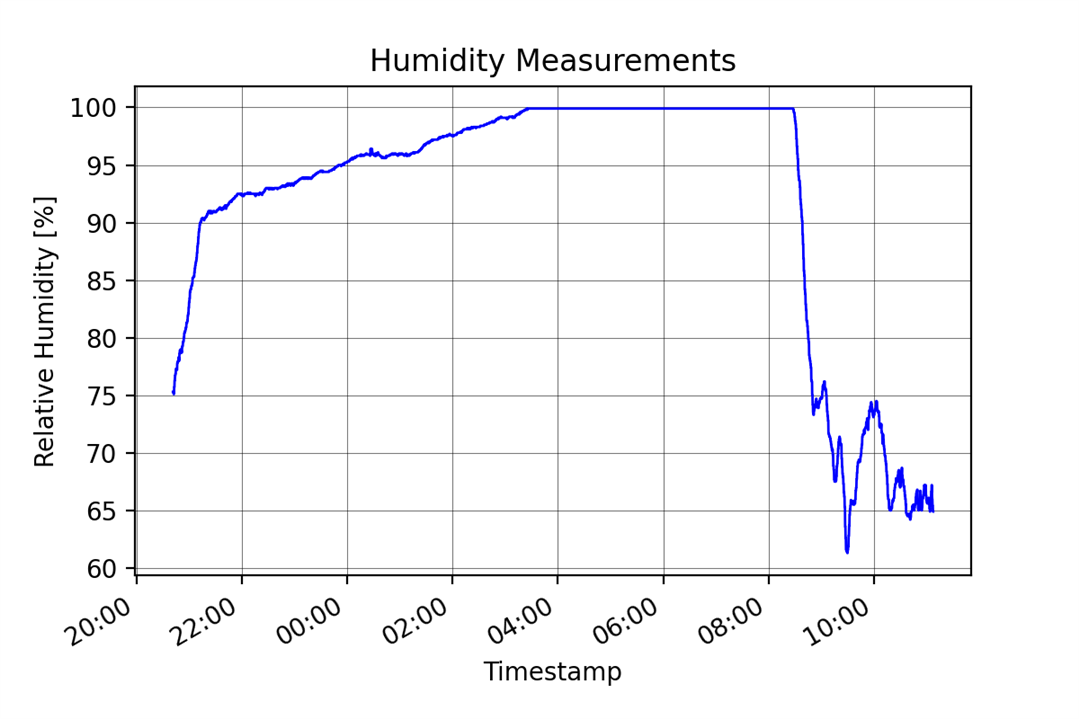
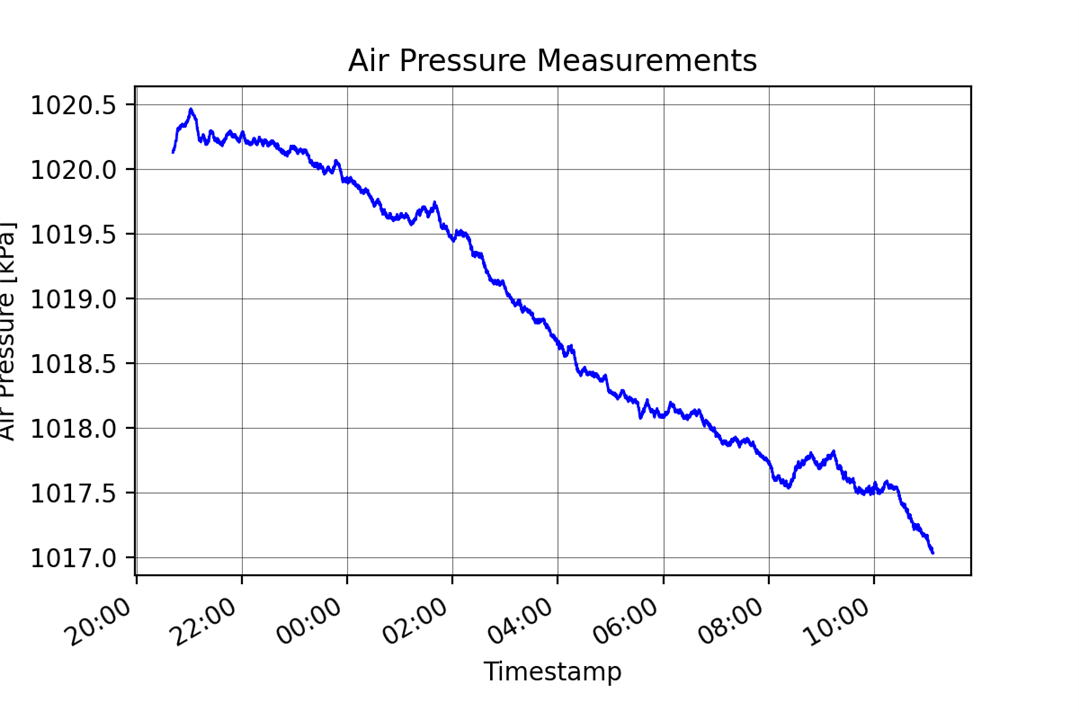
The last graph from the night that I have is the battery voltage measurement. As explained above, the voltage jumps a lot because of the bit count of the ADC as the battery voltage goes down, so I made a second plot over the original data that took the average of every 100 data points to see the trend of the battery voltage better.
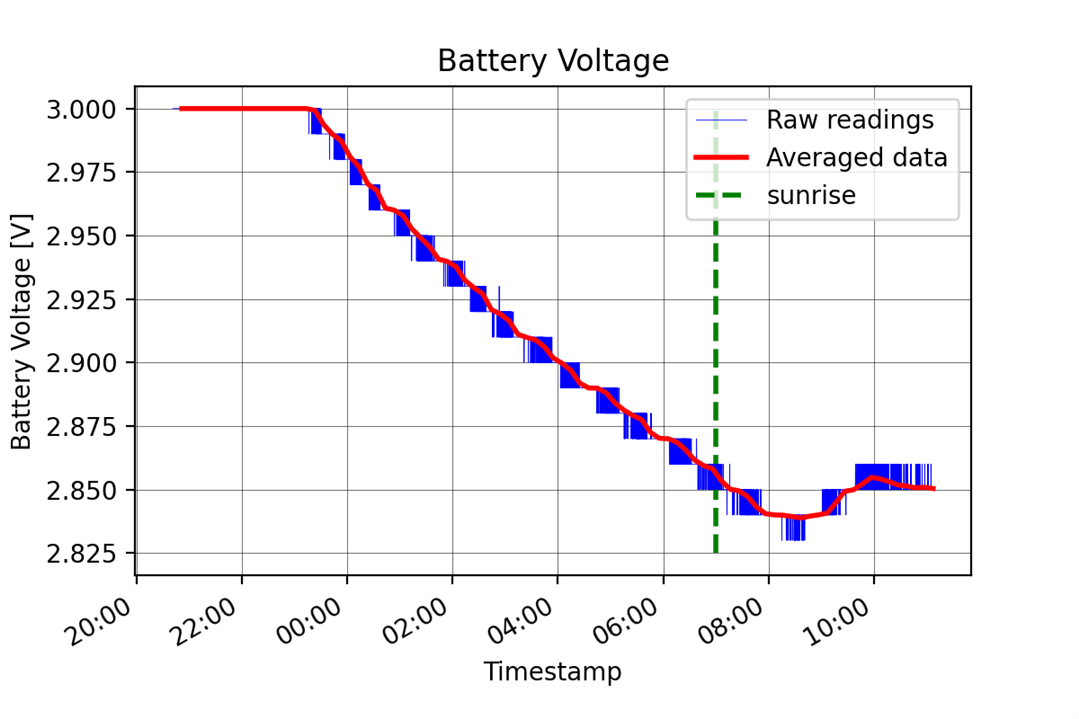
I looked a lot online to see how to work with the voltage references on the Arduino MKR WAN to measure the battery voltage and this is the best result I got by comparing the reading to the reading of my voltmeter. This way, I can't measure above 3V but that doesn't concern me, as much more critical are the lower voltages for me. One interesting thing that can be seen is the slight increase in the battery voltage after sunrise as the temperature went up.
Test 2 - Room Measurements
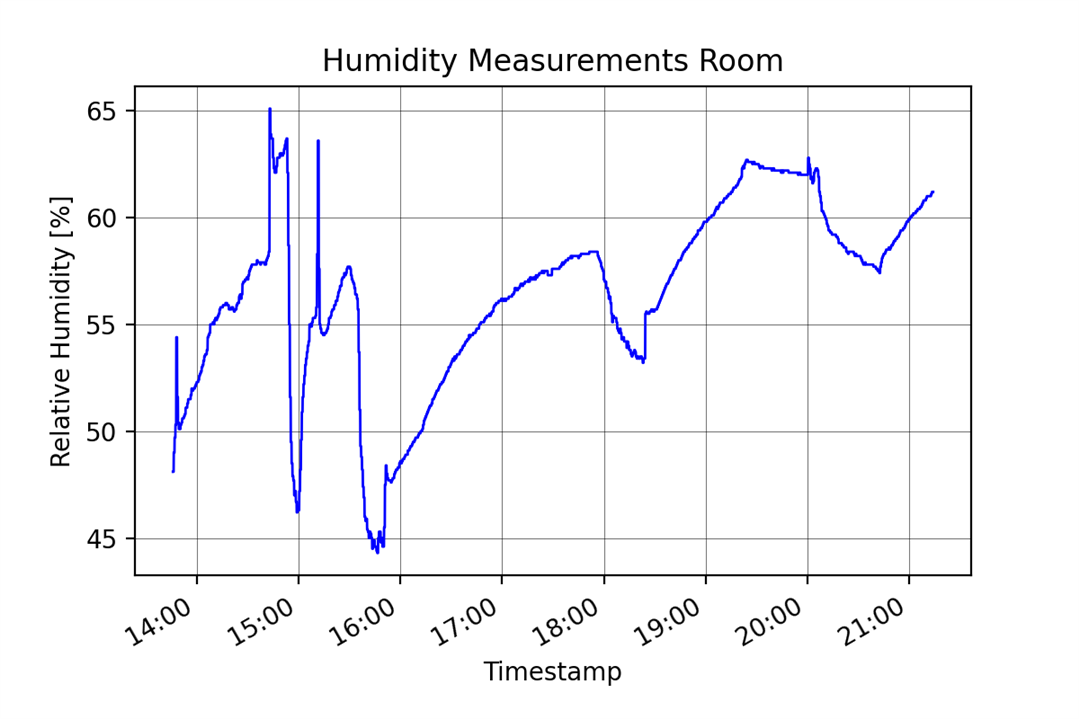
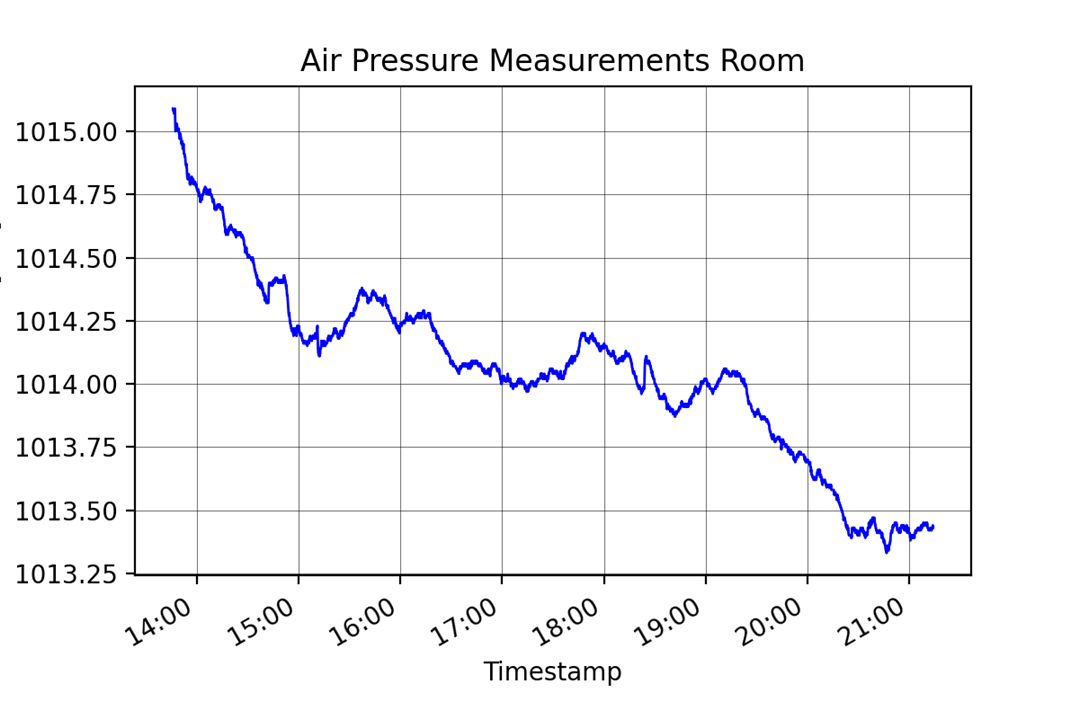
For the second test, I wanted to see measurements from my room during the day. So right before lunch, I placed the box on a shelf and let it run until 9 or 10 pm. Here are the graphs from those measurements.
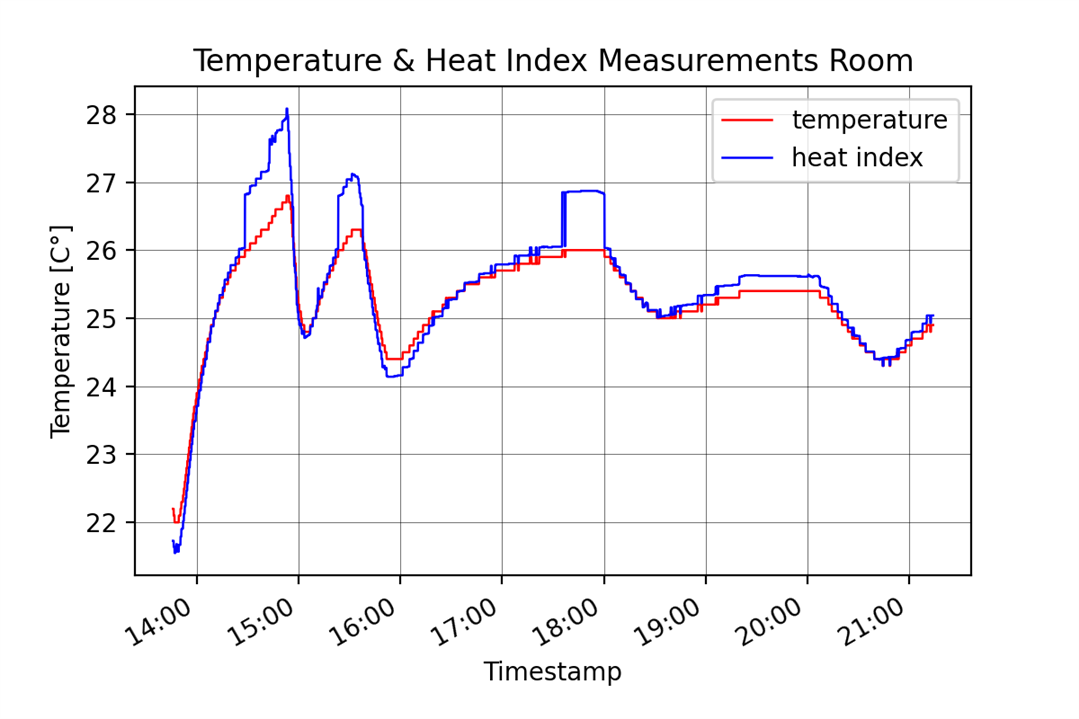

As you can see from the temperature graph, there are clearly visible oscillations which are to be expected, as I would open up the window anytime I felt it was getting too hot in the room. The battery seemed to drain far less in a warm room compared to the freezing temperatures outside.
Test 3 - Night & Day Outside
This is the last test I've conducted for this blog. Similar to the first test, I just left the box out for much longer compared to the first time. I wanted to get a full 24-hour test in, but I had to cut it short since the battery level dropped low enough for the DHT22 temperature and humidity sensor to stop working at all. The BMP280 was giving okay measurements still, but I cut it short. The voltage at where this occurred was around 2.66V. I thought maybe there was a bad solder connection or something similar, but as soon as I tried new batteries it worked. I tried warming up the old batteries and it worked for a bit until it stopped working completely again.
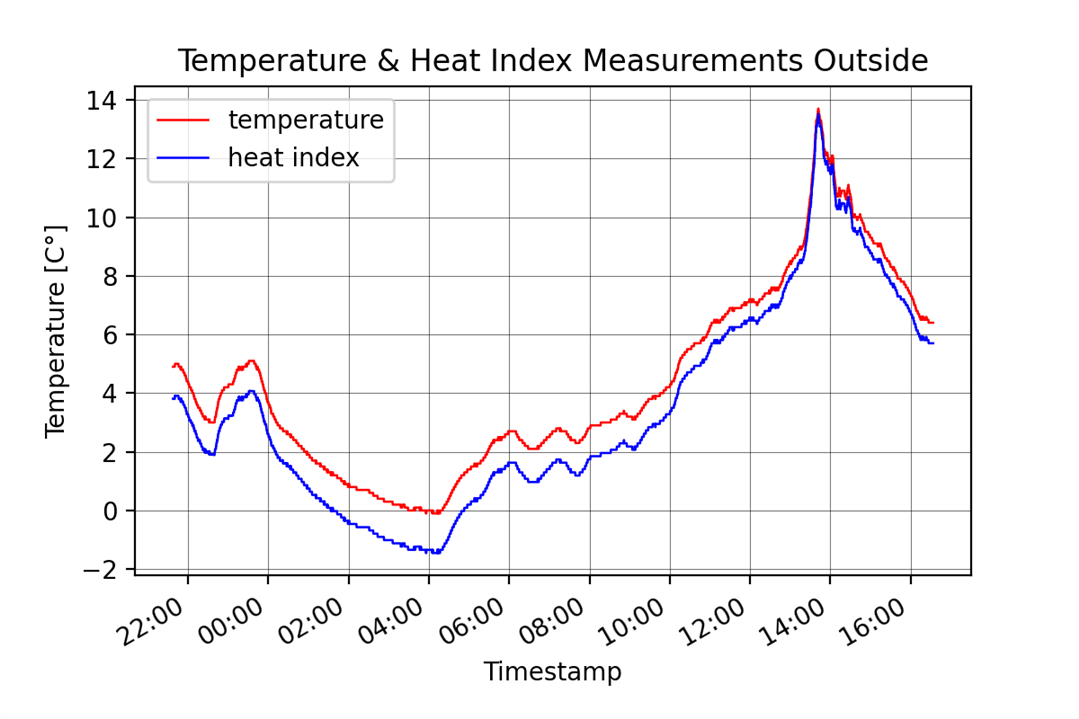
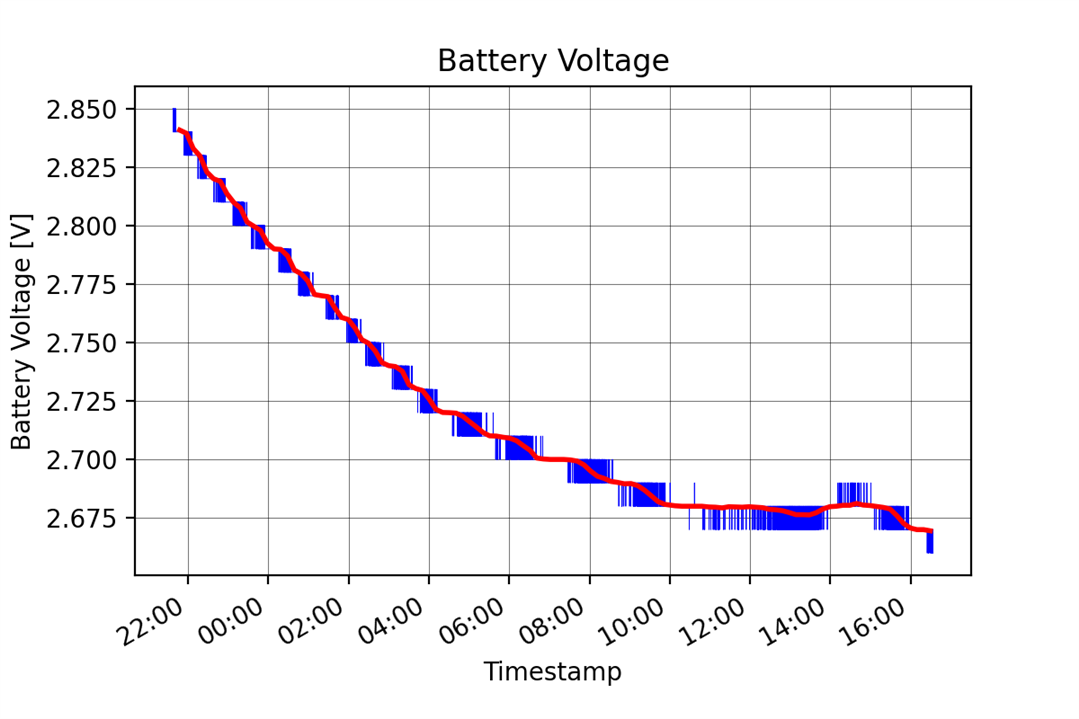
I didn't manage to get the full 24-hours, but I still managed to get the maximum and minimum temperature in the day. Here are also the humidity and air pressure plots.
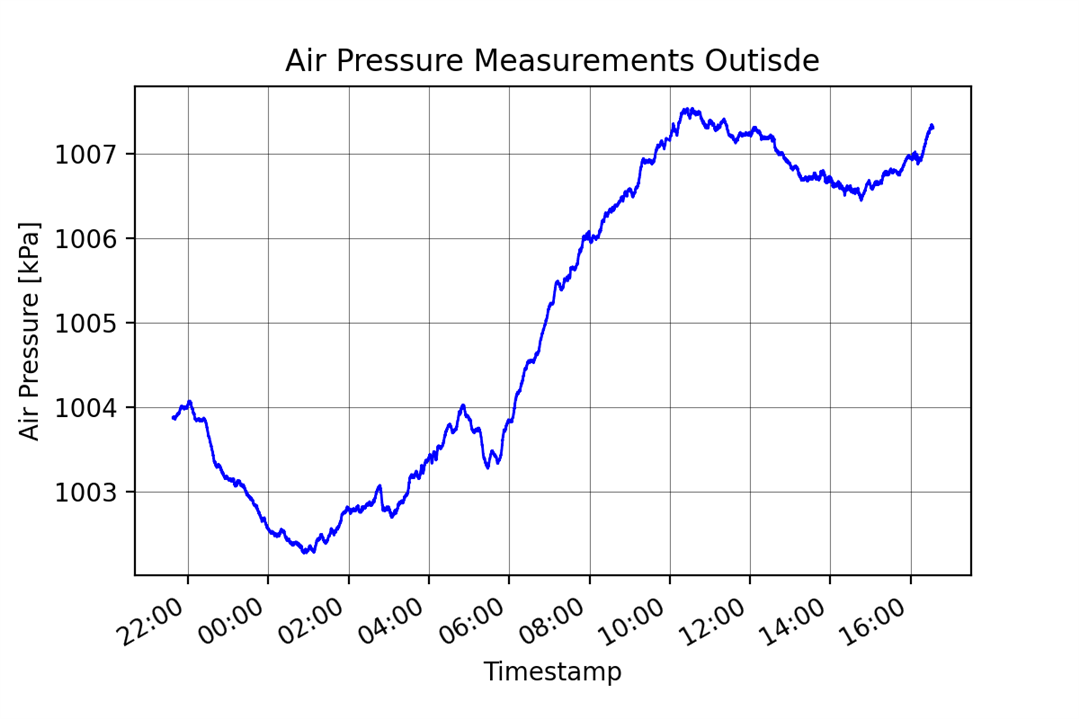
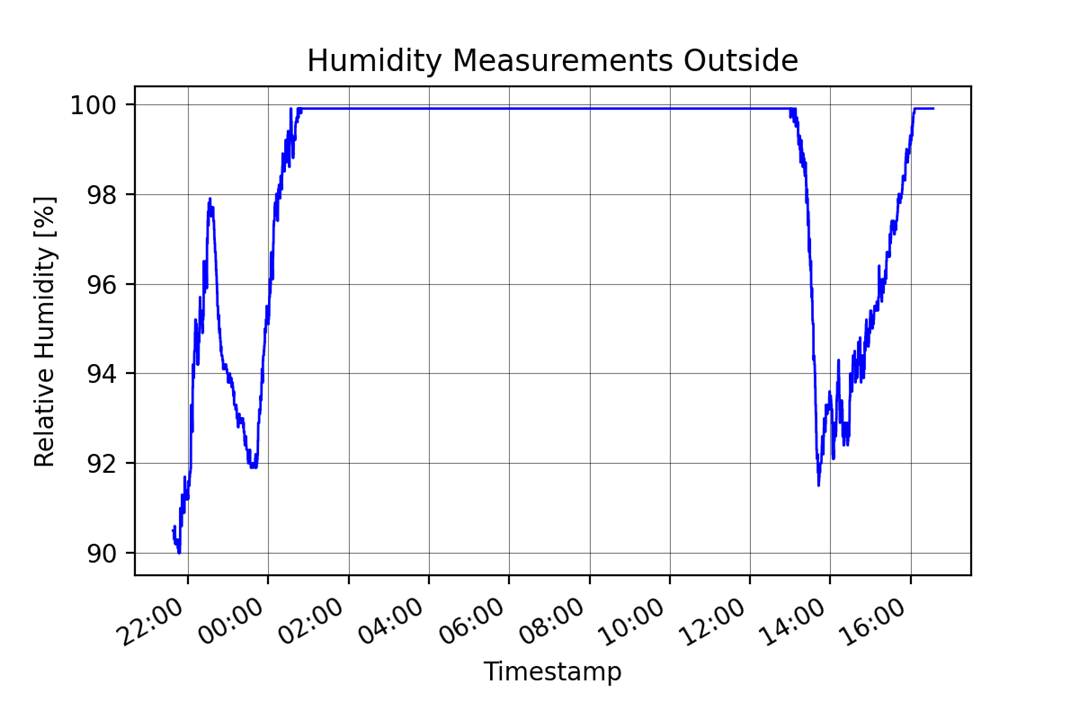
I also managed to grab a couple of screenshots from the GUI for these graphs because I put the graphs to show the last 5000 data points, which is a bit too much but looks pretty good in my opinion.
8. Summary
There was a lot of work to get to this point, but this will make sure I have less trouble down the road because I managed to get a lot of little bugs out of the GUI and the LoRa communication. It was interesting to see how the sunrise affected the temperature as well as the temperature oscillations in my room during the day. This part of the project is about 90% done I would say, though, there will be a lot of tweaks made along the way. In the next blog, I will go over the mechanical design and build of the rover itself which should be a lot of fun! Thanks for reading the blog, hope you liked it!
Milos
Relevant links for the competition:
- Just Encase Design Challenge
- Just Encase Design Challenge - About
- Just Encase Design Challenge - Challengers
Link to my GitHub where you can find all of the files used for this project (codes, 3D models,...):
Link to my Project Collection:
Orb-weaver Rover - Concept <----- Previous blog
Next blog -----> Orb-Weaver - Blog #3 - Full Battery Test

