


Orbweaver Rover - Full Battery Test
Orb-weaver Rover - Monitoring and Data Collection <----- Previous Blog
Table of Contents
 1. Introduction
Hi! This will be my third blog for the Orb-weaver Rover project. This will be a shorter blog where I want to cover another experiment I did with the sensor box that I've made last time, the link for that blog is at the top of this blog. In the previous blog, I covered three different experiments: night outside, room during the day, night, and part of the day outside. Those experiments were conducted one after the other with the same batteries each time. For this experiment, I wanted to put in a new fresh set of batteries and see for how long the box can keep going. If you take a look at the last blog, last time I had to stop around 2.67V where the DHT22 stopped working, so I will be aiming for a voltage at that range this time.
2. Plan
As described above, this test will see how long a pair of AA batteries can go in a setup like this where we send a message every 5 seconds. One thing I was thinking of doing maybe was adjusting the rate of the messages depending on battery life.
Another thing I want to try is to compare different kinds of batteries and see how well they perform this task. Sadly, I can't really compare the results from this test with the previous tests because those tests weren't done continuously, and also, one of the tests was conducted in my room that has a 20C temperature difference which greatly affects battery life.
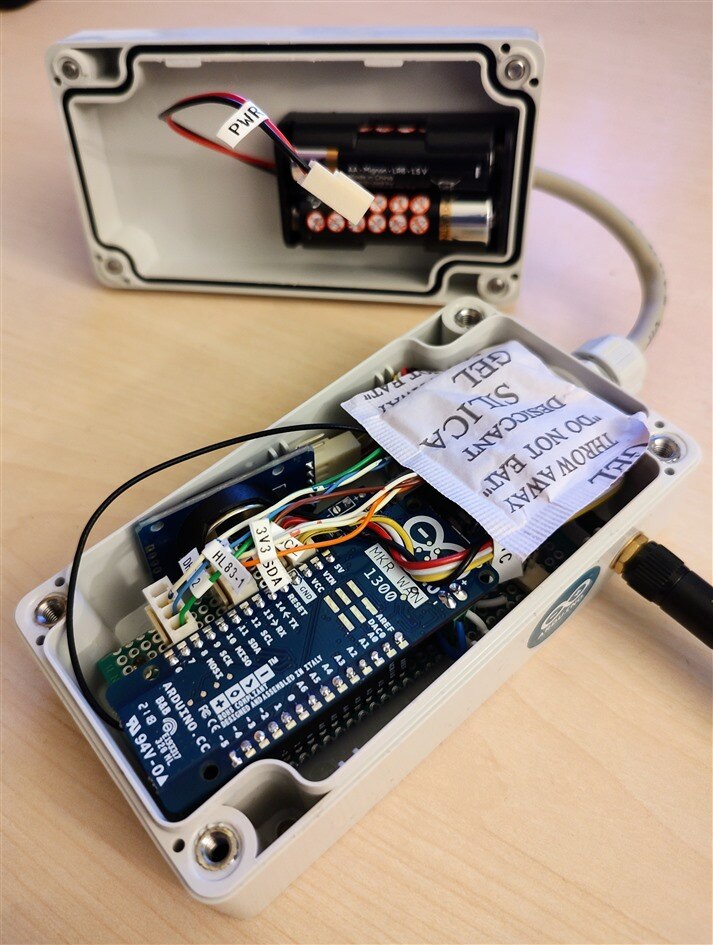
The last thing that will be different this time will be in the setup of the hardware. While the hardware is completely waterproof and I'm not concerned about any water getting in like that, one thing I am concerned about is moisture in the air because of the lower temperatures here. The last time I opened the box after leaving it out for the whole night, all of the surfaces seemed to be a bit wet to the touch, so I decided to remedy that with the simplest solution, I used a small silica bag and put it inside to deal with any moisture trapped in the box. For this method to be completely effective, it would mean we would have to leave the box in a warm place for a while once we're done using it, or open it in a dry place since condensation will occur as soon as the fresh air touches the cold components inside.
3. Test
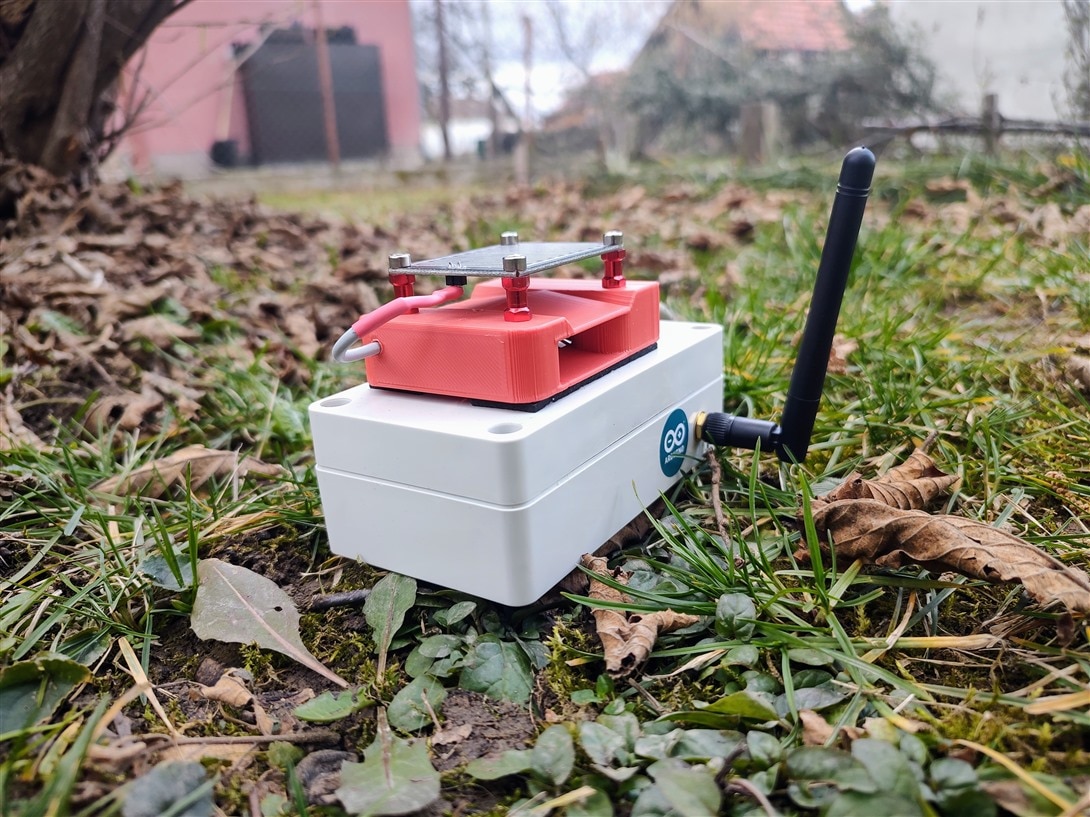
With the setup out of the way, it was time to conduct the experiment! There was some rain in the forecast for the days when I wanted to conduct the test, so I thought it would be a good test to leave the box somewhere in the grass on the ground like the rover will, to test how it handles water.
Compared to last time, the temperature was much more forgiving this time and it didn't deep below zero, where it was constantly pretty much the last time. If you wish to check out the design and the code for the box, follow this link which will lead you to my previous blog for this project: Orb-weaver Rover - Blog #2 - Monitoring and data collection (GCS, Sensor Boxes, GUI)
4. Results
Before getting to the results, once I took a look, I realized I messed up the RTC while I was putting everything inside the box. I remember pulling the battery and putting it back in without setting the time on it, so the time and date I got were incorrect as absolute values, but by simply adding the offset for the hours (date isn't crucial for the measurements) I managed to overcome this hurdle. Let's first take a look at how long the test lasted and how many measurements I've got. I've started the test on February 7th around 9 pm and ended it on February 9th around 6 pm, so the test went for around 45 hours and took close to 27000 measurements.
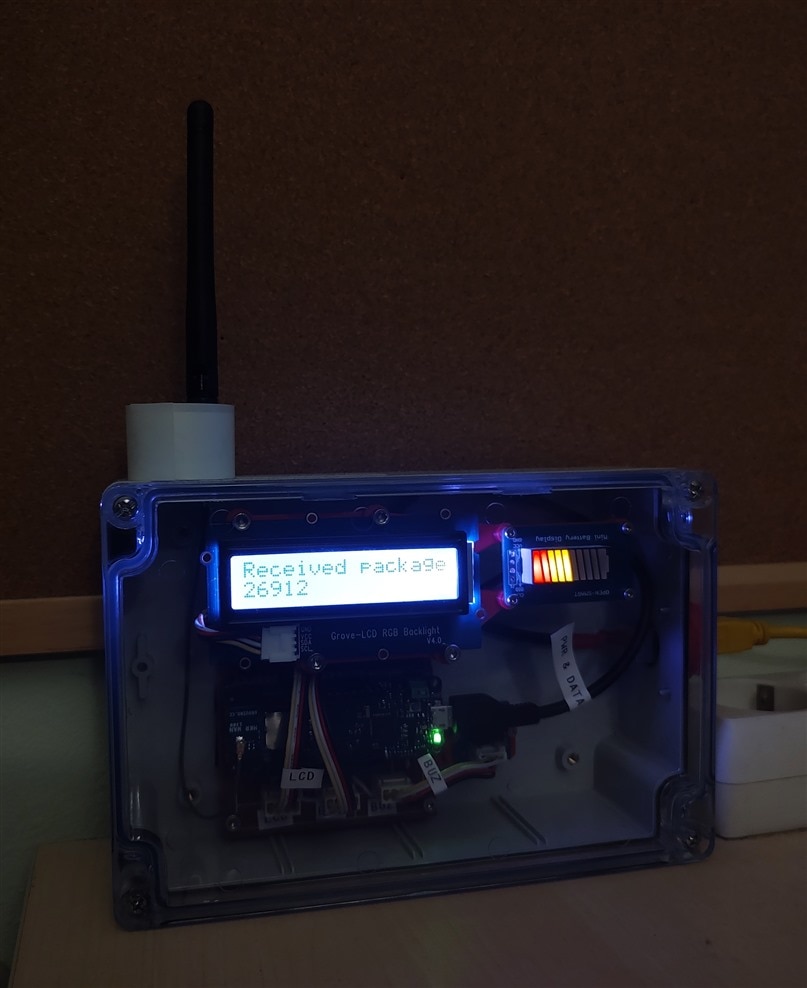
In the picture above is the GCS showing one of the last messages received before I unplugged the batteries from the Arduino. One thing I really need to add to sensor boxes is a reed switch so I can turn them on with a magnet without opening the box every time. You can see the build for the GCS and the code for it here: Orb-weaver Rover - Blog #2 - Monitoring and data collection (GCS, Sensor Boxes, GUI)
The test went smoothly for most of it, there was just a single hiccup, where my laptop decided to blue screen, so I didn't record a few data points while I turned everything back on but considering that I'm working with 27000 measurement points, that doesn't cause any issues there. One place where it did cause an issue though was the python script for working with the data. It appears that the blue screen happened while the program was writing to the CSV file, so there was NUL somewhere in the CSV, but it was a rather easy fix to get everything working nicely again. Here is that code:
import csv
import datetime
import matplotlib.pyplot as plt
import matplotlib.dates as mdates
import statistics

# Data that we will be extracting from the CSV file
temperature = []
heat_index  = []
humidity    = []
pressure    = []
battery     = []
timestamps  = []

# Message counter we will be using to not double up on data
# We don't start from the beginning, since I deployed the sensor box from my room
message_counter = 400
last_message = 0

# Function for converting our csv cells to a datetime object
def convert_to_datetime(date, time):
  day       = date[:date.find('/')]
  month     = date[len(day) + 1 : date.find('/', len(day) + 1, len(date))]
  year      = date[len(day) + len(month) + 2:]
  hour      = time[:time.find(':')]
  minute    = time[len(hour) + 1 : time.find('/')]
  second    = time[time.find('/') + 1:]

  # Adding the hour difference because I accidentally reset the RTC
  hours_to_add = datetime.timedelta(hours = 21)

  timestamp = datetime.datetime(int(year), int(month), int(day), int(hour), int(minute), int(second))
  timestamp = timestamp + hours_to_add
  return timestamp

with open('./SensorBox1.csv', mode = 'r') as log_file:
  # The part in the brackets is what fixed the NUL error
  csv_reader = csv.reader((line.replace('\0','') for line in log_file))

  # Extracting the headers from the CSV file
  header = []
  header = next(csv_reader)
  print(header)

  # Reading the data from the CSV file
  rows = []
  for row in csv_reader:
    rows.append(row)
  print(len(rows))

  # Data for each row is in this format:
  # 0 - Message ID
  # 1 - Date
  # 2 - Time
  # 3 - Temperature
  # 4 - Heat Index
  # 5 - Humidity
  # 6 - Pressure
  # 7 - Battery
  # 8 - Rain

  # Extracting all of the data into it's own arrays
  for i in range(2000, len(rows)):
    # We're checking here if we're on the right row
    if rows[i][0].isnumeric() == True and rows[i][0] != str(last_message):
      # This is the case where we actually use the data
      temperature.append(float(rows[i][3]))
      heat_index.append(float(rows[i][4]))
      humidity.append(float(rows[i][5]))
      pressure.append(float(rows[i][6]))
      battery.append(float(rows[i][7]))
      timestamps.append(convert_to_datetime(rows[i][1], rows[i][2]))
      last_message = int(rows[i][0])

# Temperature and Heat Index
# plot
fig, ax = plt.subplots()
ax.grid(axis = 'both', color = 'black', linestyle = '-', linewidth = 0.2)
ax.set_title('Temperature & Heat Index Measurements Outside')
ax.set_xlabel('Timestamp')
ax.set_ylabel('Temperature [C°]')
ax.plot(timestamps, temperature, linewidth = 0.75, color = 'r', label = 'temperature')
ax.plot(timestamps, heat_index, linewidth = 0.75, color = 'b', label = 'heat index')
ax.vlines(x=datetime.datetime(1900,1,2,6,49,0), ymin=-1, ymax=14, colors='g', ls='--', lw=1.6, label='sunrise')
ax.vlines(x=datetime.datetime(1900,1,3,6,48,0), ymin=-1, ymax=14, colors='g', ls='--', lw=1.6)
ax.vlines(x=datetime.datetime(1900,1,2,16,58,0), ymin=-1, ymax=14, colors='purple', ls='--', lw=1.6, label='sunset')
ax.vlines(x=datetime.datetime(1900,1,3,16,59,0), ymin=-1, ymax=14, colors='purple', ls='--', lw=1.6)
plt.gcf().autofmt_xdate()
myFmt = mdates.DateFormatter('%H:%M')
ax.xaxis.set_major_formatter(myFmt)
ax.legend(prop={'size': 10})
fig.savefig('./Graphs/TemperatureMeasurementBatteryLife.png', dpi = 200)
plt.show()

# Humidity
# plot
fig, ax = plt.subplots()
ax.grid(axis = 'both', color = 'black', linestyle = '-', linewidth = 0.2)
ax.set_title('Humidity Measurements Outside')
ax.set_xlabel('Timestamp')
ax.set_ylabel('Relative Humidity [%]')
ax.plot(timestamps, humidity, linewidth = 0.5, color = 'b', label = 'humidity')
plt.gcf().autofmt_xdate()
myFmt = mdates.DateFormatter('%H:%M')
ax.xaxis.set_major_formatter(myFmt)
fig.savefig('./Graphs/HumidityMeasurementBatteryLife.png', dpi = 200)
plt.show()

# Air Pressure
# plot
fig, ax = plt.subplots()
ax.grid(axis = 'both', color = 'black', linestyle = '-', linewidth = 0.2)
ax.set_title('Air Pressure Measurements Outisde')
ax.set_xlabel('Timestamp')
ax.set_ylabel('Air Pressure [kPa]')
ax.plot(timestamps, pressure, linewidth = 1.0, color = 'b', label = 'pressure')
plt.gcf().autofmt_xdate()
myFmt = mdates.DateFormatter('%H:%M')
ax.xaxis.set_major_formatter(myFmt)
fig.savefig('./Graphs/AirPressureMeasurementBatteryLife.png', dpi = 200)
plt.show()


# Battery
print(len(battery))
batch_size = 1000
batch_num = 0
avereaged_data = []
timestamps1 = []
current_batch = 0
for i in range(len(battery)):
  current_batch += battery[i]
  if i >= batch_size * (batch_num + 1) - 1:
    avereaged_data.append(current_batch / batch_size)
    timestamps1.append(timestamps[i])
    current_batch = 0
    batch_num += 1

# plot
fig, ax = plt.subplots()
ax.grid(axis = 'both', color = 'black', linestyle = '-', linewidth = 0.2)
ax.set_title('Battery Voltage')
ax.set_xlabel('Timestamp')
ax.set_ylabel('Battery Voltage [V]')
ax.plot(timestamps, battery, linewidth = 0.2, color = 'b', label = 'Raw readings')
ax.plot(timestamps1, avereaged_data, linewidth = 2.0, color = 'r', label = 'Averaged data')
#ax.vlines(x=datetime.datetime(2022,1,25,7,0,0), ymin=2.825, ymax=3, colors='g', ls='--', lw=2, label='sunrise')
plt.gcf().autofmt_xdate()
myFmt = mdates.DateFormatter('%H:%M')
ax.xaxis.set_major_formatter(myFmt)
fig.savefig('./Graphs/BatteryVoltageBatteryLife.png', dpi = 200)
plt.show()
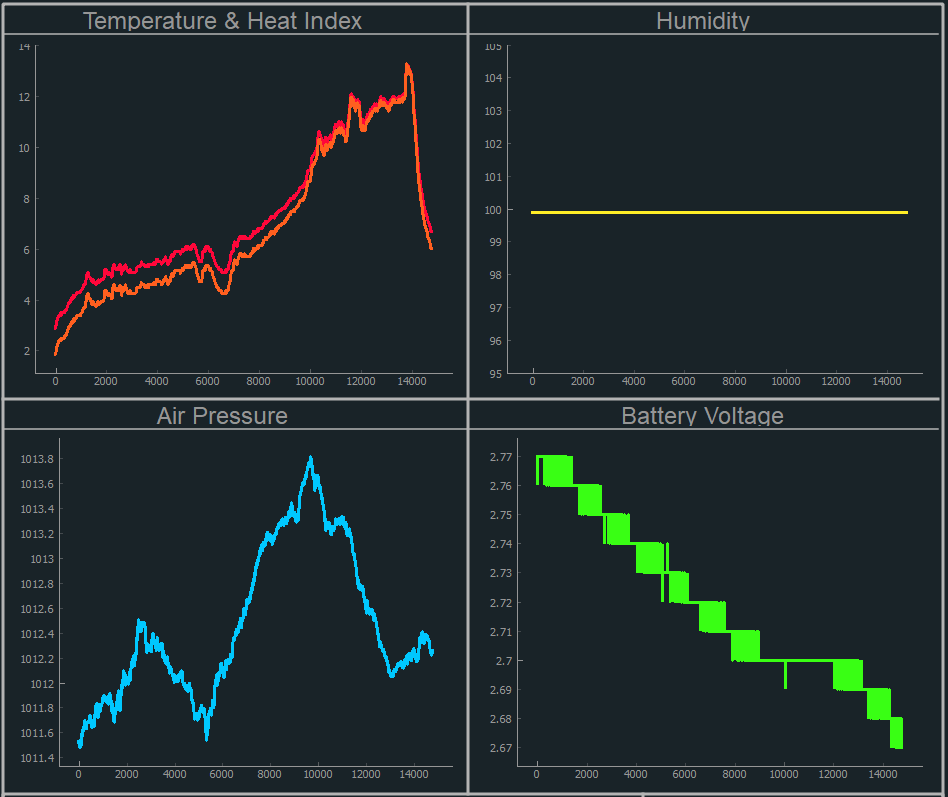
Of course, besides logging all of the data in a CSV file, the GUI was updating all of the graphs live while the test kept going. Sadly, this was split in half because of the blue screen, but I got a screenshot at the end of the whole experiment which shows a bit of it.
If you're interested in more details about the GUI, as well as the code for it, check the previous blog: Orb-weaver Rover - Blog #2 - Monitoring and data collection (GCS, Sensor Boxes, GUI)
Temperature & Heat Index
The first thing to check out is the temperature and heat index graph. The forecast showed that the weather was getting nicer with much warmer temperatures, which was confirmed by the graph (although there was a bit of rain here and there).
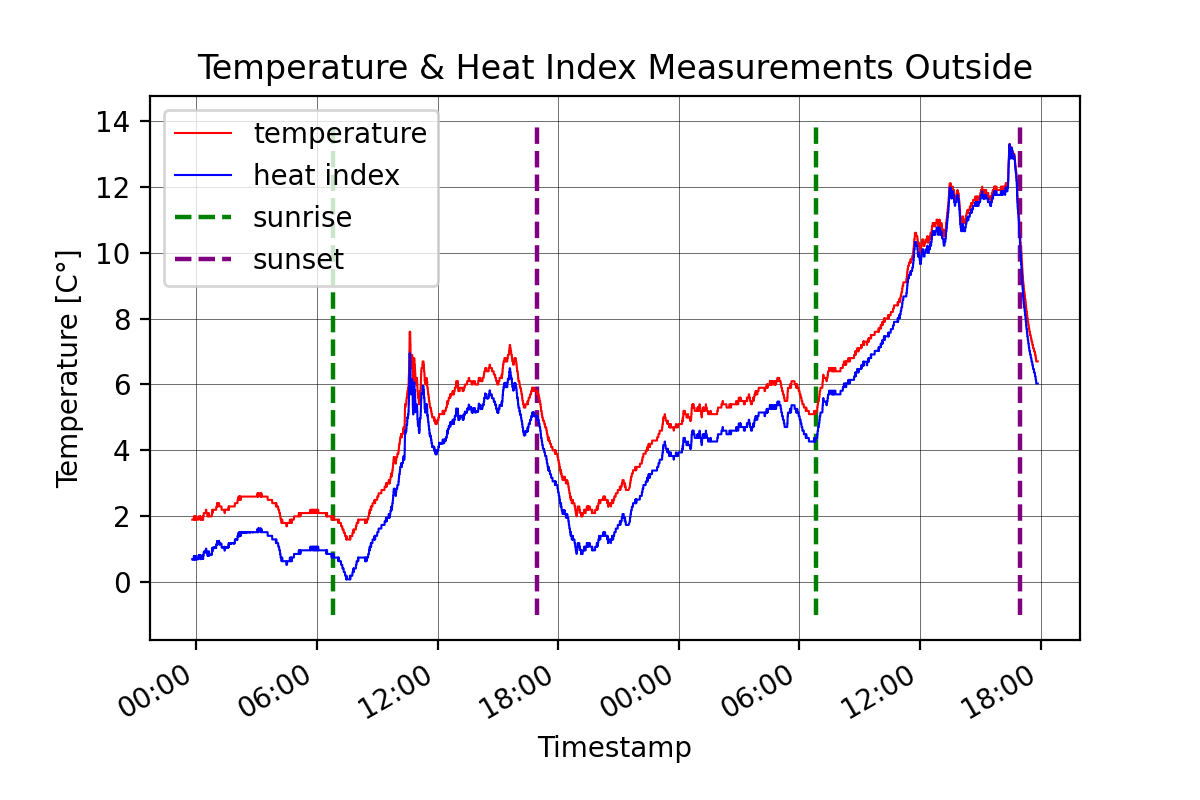
I've looked on Google the sunrise and sunset times for the place where I live and added them to this graph. Those times correspond really nicely with the temperature shown on the graph, especially the sunset because a massive drop in temperature can be seen at sunset as expected.
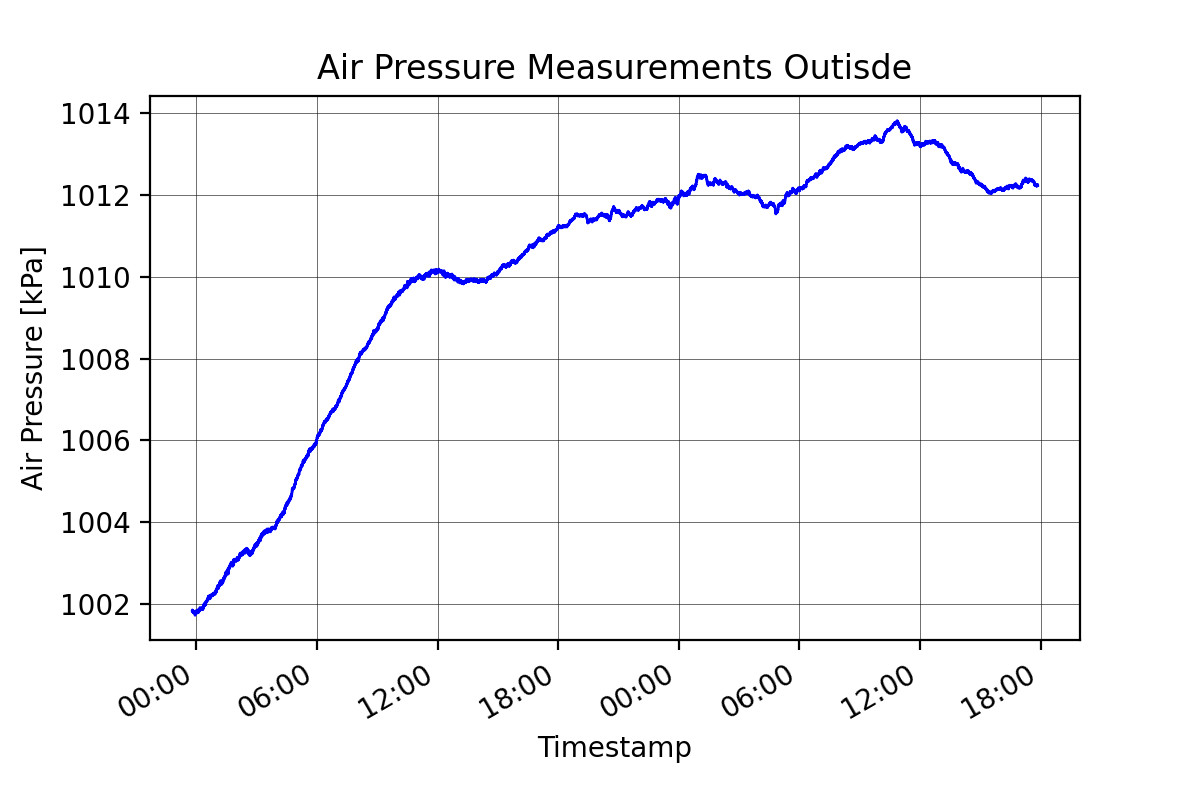
Air Pressure
Humidity
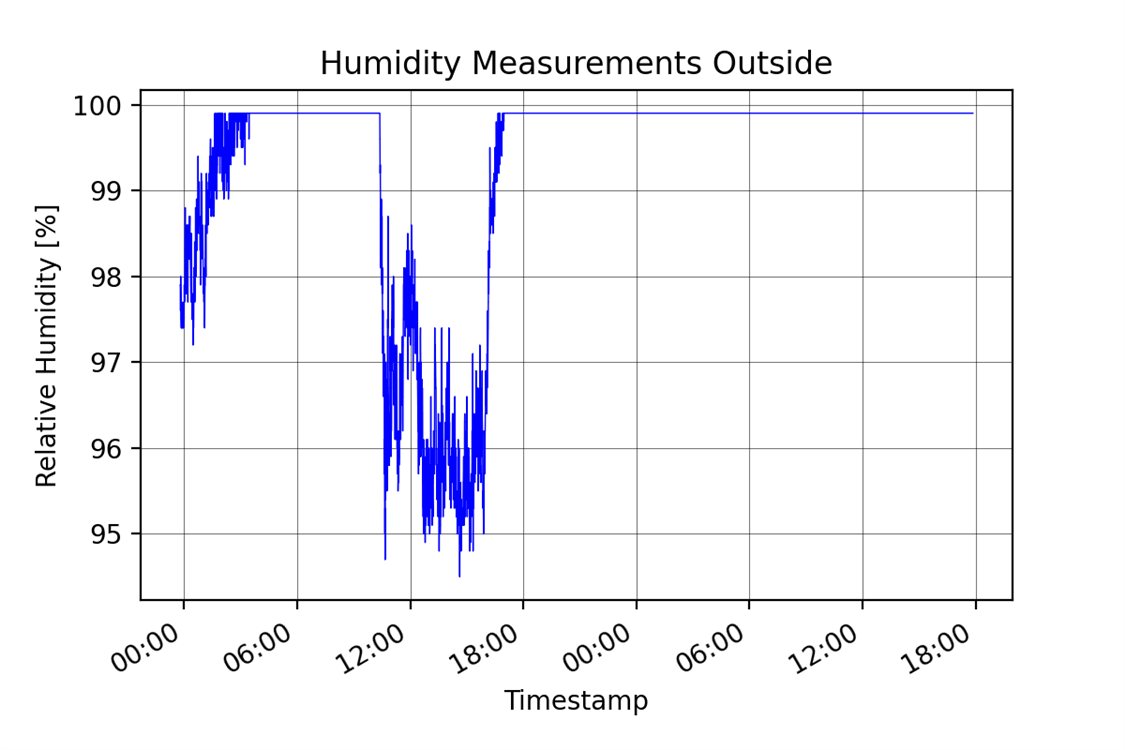
The weather was pretty rainy and cloudy during the test, so the values are high throughout the test. This graph reminded me to check one thing though, in my room attached to a radiator, there is a small open water container that I fill up with water so the air isn't too dry in the room. As soon as I got the sensor box outside from my room, I could see the humidity starting to climb really fast which got me curious. I went and checked the water container only to find it completely empty, which explains the measurements from the room (the first 2000 measurements were ignored for the graphs because the DHT22 needs some time to adapt to "drastically" different conditions).
Battery Voltage
I cut the test a bit short, but the battery voltage measurement at that point was around 2.68V, so it wouldn't have lasted much longer anyway. While I know I said I can't compare my findings now with the tests from the last blog, I think that the batteries I used last time performed a bit better. Both times I used generic off-the-shelf batteries that I found in a local store, I'll probably run the test again, but maybe use some more expensive batteries to see if they actually make a difference. Another idea I had was to maybe switch to the smaller AAA batteries, but try and pack 4 or 6 of them in the box.
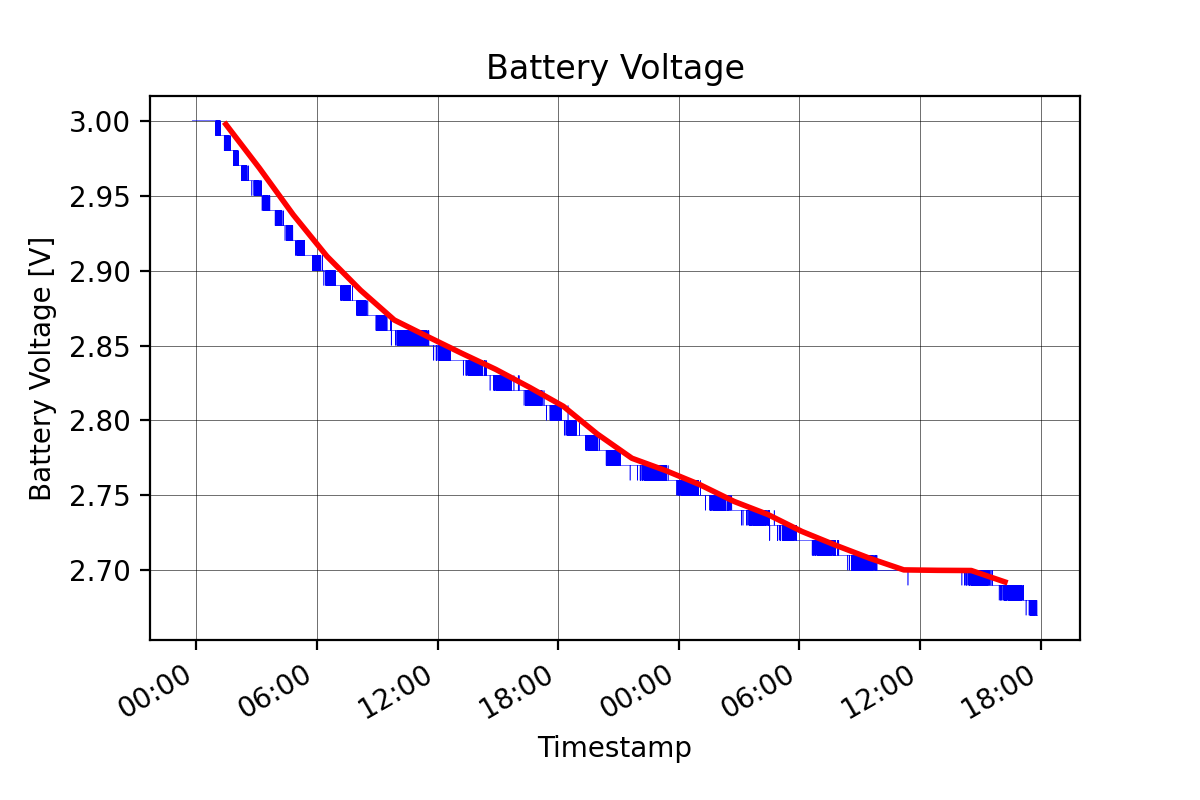
The blue line on the graph is the raw data I got from the Sensor Box, while the red line is made out of average points every 1000 measurements to get a more realistic view of how the battery voltage behaves as it drops. I did this because the ADC uses a finite number of bits and there will be some oscillations when the voltage is on the edge between 2 values that the Arduino can measure.
5. Summary
I'm gonna call this test a success, the setup worked without any errors for around 45 hours and almost 27000 measurements continuously. I'll probably conduct a few more tests like this one along the way when I put together the second Sensor Box, maybe compare the different battery manufacturers head to head or completely different battery setups as I've discussed above. The boxes are proving to work great, I need to come up with some more elaborate tests to test out their strength. If you're interested in any details about the hardware or software of the Sensor Boxes, GCS or GUI I highly recommend you check out my previous blog: Orb-weaver Rover - Blog #2 - Monitoring and data collection (GCS, Sensor Boxes, GUI). Thanks for reading the blog, hope you like it!
Milos
Relevant links for the competition:
- Just Encase Design Challenge
- Just Encase Design Challenge - About
- Just Encase Design Challenge - Challengers
Link to my GitHub where you can find all of the files used for this project (codes, 3D models,...):
Link to my Project Collection:
Orb-weaver Rover - Blog #2 - Monitoring and data collection (GCS, Sensor Boxes, GUI) <----- Previous blog
Next blog -----> Orb-weaver Rover - Blog #4 - Making the Rover!


